
Abstract
Electrochemotherapy is an established treatment option for patients with superficially metastatic tumors, mainly malignant melanoma and breast cancer. Based on preliminary experiences, electrochemotherapy has the potential to be translated in the treatment of larger and deeper neoplasms, such as soft tissue sarcomas. However, soft tissue sarcomas are characterized by tissue inhomogeneity and, consequently, by variable electrical characteristic of tumor tissue. The inhomogeneity in conductivity represents the cause of local variations in the electric field intensity. Crucially, this fact may hamper the achievement of the electroporation threshold during the electrochemotherapy procedure. In order to evaluate the effect of tissue inhomogeneity on the electric field distribution, we first performed ex vivo analysis of some clinical cases to quantify the inhomogeneity area. Subsequently, we performed some simulations where the electric field intensity was evaluated by means of finite element analysis. The results of the simulation models are finally compared to an experimental model based on potato and tissue mimic materials. Tissue mimic materials are materials where the conductivity can be suitably designed. The coupling of computation and experimental results could be helpful to show the effect of the inhomogeneity in terms of variation in electric field distribution and characteristics.
Introduction
Electrochemotherapy (ECT) is a local anticancer therapy that is focused on the treatment of small and superficial tumors. It is based on the combination of short-voltage pulses delivered by using needle or plate electrodes and a cytotoxic drug. 1 –5 In the standard clinical practice, ECT is applied by means of fixed-geometry electrodes, 7 needles with a distance of 7.3 mm hexagonally arranged, which apply the electric field in a volume close to 3 cm3 (depending on the needle length) based on the reference electroporation protocol described by Mir et al and Marty et al. 6,7 During ECT procedure, the operator has a relatively short time interval (after chemotherapy injection) for the application of the voltage pulses. In particular, the standard operative procedures prescribe the voltage pulse application within a 20-minute time interval after chemotherapy administration. 6,7 The drug can be a cheap and nonpermeant one in nonelectropermeabilization conditions which, thanks to its short biodisponibility, shows reduced side effects. For this reason, this type of technique shows interesting characteristics for the patient care.
Currently, ECT is applied to treat patients with superficially metastatic melanoma, skin tumors, and breast cancer recurrences on the chest wall. 1,2,4,6 –8 In recent years, this therapy has been also explored in other types of tumors, such as liver metastases and soft tissue sarcomas (STS), with promising results. 9 –13
The treatment of STS with ECT poses some peculiar challenges, due to their size, anatomical location, heterogeneity, and histological characteristics. In fact, patients with STS present large and usually deep-seated (eg, intramuscular) tumors and the tumor can arise from very different tissues (connective, adipose, muscular, nervous, etc). Finally, each single STS can be highly inhomogeneous from the histological point of view, due to the presence of different components within it (viable tumor cells [TCs], portions of tumor tissue necrosis, myxoid material, etc). Inhomogeneity in the tissue modifies the electric field distribution. This effect was already shown, for instance, in 2008 by Sersa et al. 14 In particular, they evaluated the effect of vasculature in the electric field distribution. 14
In a previous analysis, 15 the authors found differences in the resistance values evaluated for different needle pairs (needle pair schema in Figure 1A) in the same voltage pulse application as shown in Figure 1B. The resistance at each electrode pair was evaluated following the method used in Ex Vivo Study on Soft Tissue Tumours Electrical Characteristics (ESTTE) protocol. 15 –18 This resistance variation could be justified by tissue inhomogeneity.

A, Schema of the 7-needle electrode and resistance values evaluated applying 8 voltage pulses at each of the 12 pairs. B and C, Resistance values for the cases in Table 1 as function of the energized pair.
Histopathological analysis has highlighted some interesting cases of inhomogeneity that occurs in real tumors. This analysis allowed to isolate some interesting configurations that were analyzed by means of finite element analysis (FEM) and experimental models. The finite element simulations were used to evaluate the electric field intensity in some simplified geometries. In particular, in order to evaluate the electric field intensity in different inhomogeneity cases, a 2-needle model, suitably supplied, has been simulated. Simulation results were compared with experiments on suitable phantoms.
Material and Methods
Histopathological Analysis
The patient data were recorded following the ESTTE protocol described in the study by Tosi et al, 15,17,19 evaluating each cases at histological point of view as in those works according to the World Health Organization classification of tumors of soft tissue and bone. 20 Table 1 reports the tumor type and the stroma type. In particular to each specimen, a 7-needle electrode (Figure 2A for an electrode schema) was implanted and a sequence of 96 voltage pulses (8 pulses per each of the possible needle pairs), 100 µs long at 5 kHz with amplitude 730 V (needle distance 7.3 mm), was applied. After pulse application, samples were fixed in 10% buffered formalin, embedded in paraffin, and stained with hematoxylin and eosin. For each sample, the average resistance of the sample and the size of TC and atypical adipocytic component evaluated as in the study by Tosi et al 15,17,19 are also reported.
Data of Excised Mass Analyzed Including Type of Tumor and Stroma, Average Size of Cells, and Average Resistivity Evaluated in the study by Campana et al. 15

Abbreviations: AA, atypical adipocytic; TC, tumor cells.

Electric field distribution in (A) homogeneous model. B and C, Different configuration of the model B in Figure 3. The gray rectangle shows the potato area.
The inhomogeneity analysis has been performed comparing the area of inhomogeneity in real cases and the area covered by the standard 7-needle electrode. In this case, the 7-needle electrode was superposed to the 1× image according to the image scale and the electrode sizes. An example is in Figure 3. Moreover, for the points from P1 to PN, magnified images were captured and shown near the 1× image. In the 1× image, the size of the histology sample is reported.

Example of the inhomogeneity analysis in a real case (undifferentiated epithelioid sarcoma) with magnified images.
Computation Model
A simple parallelepiped model (35 mm × 50 mm × 10 mm) has been used in 3-dimensional numerical computations. 21 –25 The model includes 2 needles (1.0 cm long, 0.5 mm diameter, and an interneedle distance, d of 7.3 mm, inserted into the parallelepiped), as shown in Figure 4, in accordance with proposed literature models. 26,27 The parallelepiped volume was divided into 2 or 3 subvolumes, each one characterized by a different conductivity value. The different subvolumes considered are sketched in Figure 5. The difference in conductivity of the subvolumes would mimic the inhomogeneity of the tumor tissue as shown in the previous analysis (eg, in Figure 3).

Three-dimensional numerical model for the 2 needle case 26 : (A) problem geometry and (B) electric field intensity sampling line.

Different arrangement of the numerical models with 2 needles considering different inhomogeneity cases.
The electric field intensity due to the voltage applied between a pair of needles was computed using FEM as proposed by more research groups.
25,28
–32
The electric field intensity has been computed by means of finite element simulator (COMSOL; https://www.comsol.it/), solving Laplace equation in static condition. Then, an electrical conduction problem on electric scalar potential, V, imposing a constant potential on the needle surfaces
29,33
and considering a conductivity dependent on electric field
29,34
–37
σ(E) was solved as follows:
The potential imposed to the 2 needle surfaces was +730/2 V for electrode 1 in Figure 4 and −730/2 V for electrode 2 in Figure 4, according to the study by Marty et al and Mir et al.
6,7
Finally, a tangent condition of electric field lines was imposed on the external boundary of the model as in the study by Ongaro et al
26,27
:
The conductivity σ(E) in some cases was posed constant and in others follows the nonlinear model proposed by Breton et al
35
and used in
36,37
:
where σ0 and σEP are the conductivity of the nonelectropored and electropored tissue, respectively, and k v and E th are parameters obtained fitting experimental data as in the study by Campana et al and Dughiero et al. 36,37 For instance, possible parameter values for Equation 3 are σ0 = 0.04 S/m, σEP = 0.12 S/m, k v = 0.0004 m/V, E th = 11 500 V/m (potato as in the study by Breton et al 35 ) or σ0 = 0.2 S/m, σEP = 0.8 S/m, k v = 0.0004 m/V, E th = 9000 V/m (epidermis as in the study by Pavšelj et al 30,38 ). The parameters used in this article were evaluated experimentally by measurements.
A schematic representation of the models with 2 needles is shown in Figure 5. In these models, σ1 and σ2 represent different conductivities suitably designed in order to be lower or comparable to the one of the electroporated potato, according to the combinations of gel and potato in Table 2. In particular, 2 types of gel with different conductivity were used. The electric field has been sampled on the parallelepiped surface (xy layer) and 2-imensional equilevel maps were shown. 27,28
Setups for Numerical and Experimental Models.

Tissue Mimic Materials
The gel phantoms, made of tissue mimic materials (TMM), have been produced according to a slightly modified procedure as the one proposed in the study by Mobashsher and Abbosh. 39 Gelatin, water, agar, corn flour, glycerin, sodium azide (NaN3), and sodium chloride (NaCl) were commercially available and used as received. The list and amount of starting ingredients for the production of the phantoms is reported in Table 3. 36,37
The procedure for the preparation of the materials D2 and SC1 follows the procedure in the study by Campana et al and Dughiero et al, 36,37 whereas the one for the preparation of the modified TMM (D2′ and SC1′) follows the steps reported below (NaN3, was substituted by NaCl). First, the corn flour is mixed in a beaker with 20 mL of deionized water and glycerin at room temperature, while in a second beaker other 50 mL of deionized water was used to dissolve the NaCl and the gelatin or agar. The content of the second beaker is heated using a microwave oven (Qlive, 700 W microwave) for 30″ (mix final temperature close to 90°C). The 2 mixtures were mixed and heated by means of a microwave oven and stirred vigorously until the whole mixture turns semisolid (the total heating time depends on the dielectric properties of materials). The TMM is finally cast into boxes with the suitable sizes for experiments. In the experiments with potatoes, both the 2 types of gels, D2, SC1, D2′, and SC1′, were used.
Voltage Pulses
Voltage pulses were applied by means of plate electrode or 2-needle electrode connected to the generator EPS02 manufactured by Igea S.p.A., Carpi (MO), Italy. At electrode extremities, 8 rectangular voltage pulses, 100 µs long (duty cycle 50%) at 5 kHz, were applied. Voltage amplitude varied according to the electrode distance (eg, from 100 to 700 V for plate electrode and 730 V for the 2-needle or 7-needle electrode). The plate electrode was supplied with voltage pulses applied considering the same polarity for the plates (voltage pulse sequence, VPS8), whereas the 8 pulses of the 2-needle electrode were applied changing the polarity of the needles after 4 pulses (VPS4).
Experimental Tests
In experimental tests, a combination of potato samples and TMM was used. In fact, it is well known that potato became dark few hours after electroporation. 28,40,41 All the samples were preserved covered by plastic film at room temperature and observed for 24 hours after pulses applications as in the study by Ongaro et al and Campana et al. 28,42
The experimental tests were performed in 2 steps. The aim of the first step (step 1) is the evaluation of the conductivity of potato and gels obtained following the new procedure and the conductivity of the potato tuber. The experimental setup is illustrated in Figure 6A. In this case, each box of the chamber slide was filled by one of the gels or by potato samples. In particular, gels were cast avoiding air bubbles. For each type of gel, the plate electrode was positioned as in Figure 6A and was supplied with 8 pulses following the sequence VPS8. In this case, the voltage amplitude applied to gels was 100 and 500 V according to Campana et al and Dughiero et al. 36,37

Experimental setup for the step 1 (A) and step 2 (B, C).
From voltage V and current I, measured by EPS02, the conductivity σ (in S/m) has been computed from the estimated resistance, R = V/I, of a parallelepiped with section A (10 mm × 11.3 mm) and a plate distance L of 7 mm (Figure 7A):
Images of real specimens (magnification ×1) and zoom of some interesting points in terms of inhomogeneity: (A) case P15, (B) case P18, and (C) case P12.
The resistivity ρ (in Ω·m) is the inverse of the conductivity σ, ρ = σ−1.
In the case of the potato samples, the voltage amplitude was varied in the range 100 to 700 V in order to evaluate the parameters of Equation 3 according to Campana et al and Dughiero et al. 36,37 The color of potato sample was related to the sample resistivity as in the study by Bernardis et al. 43 Experiments were repeated at least twice, and the resulting conductivity is the average value.
The second step (step 2) helped evaluating the electric field distribution in inhomogeneous cases. In this step, the setup with the 2 needles (Figure 6B) was considered. The cases shown in Figure 6C were analyzed. In these experiments, the voltage amplitude was set to 730 V and the electrode was supplied with 8 pulses following the sequence VPS4 described at paragraph 2.5. After 24 hours, a picture was taken.
Results
Histopathological Analysis Results
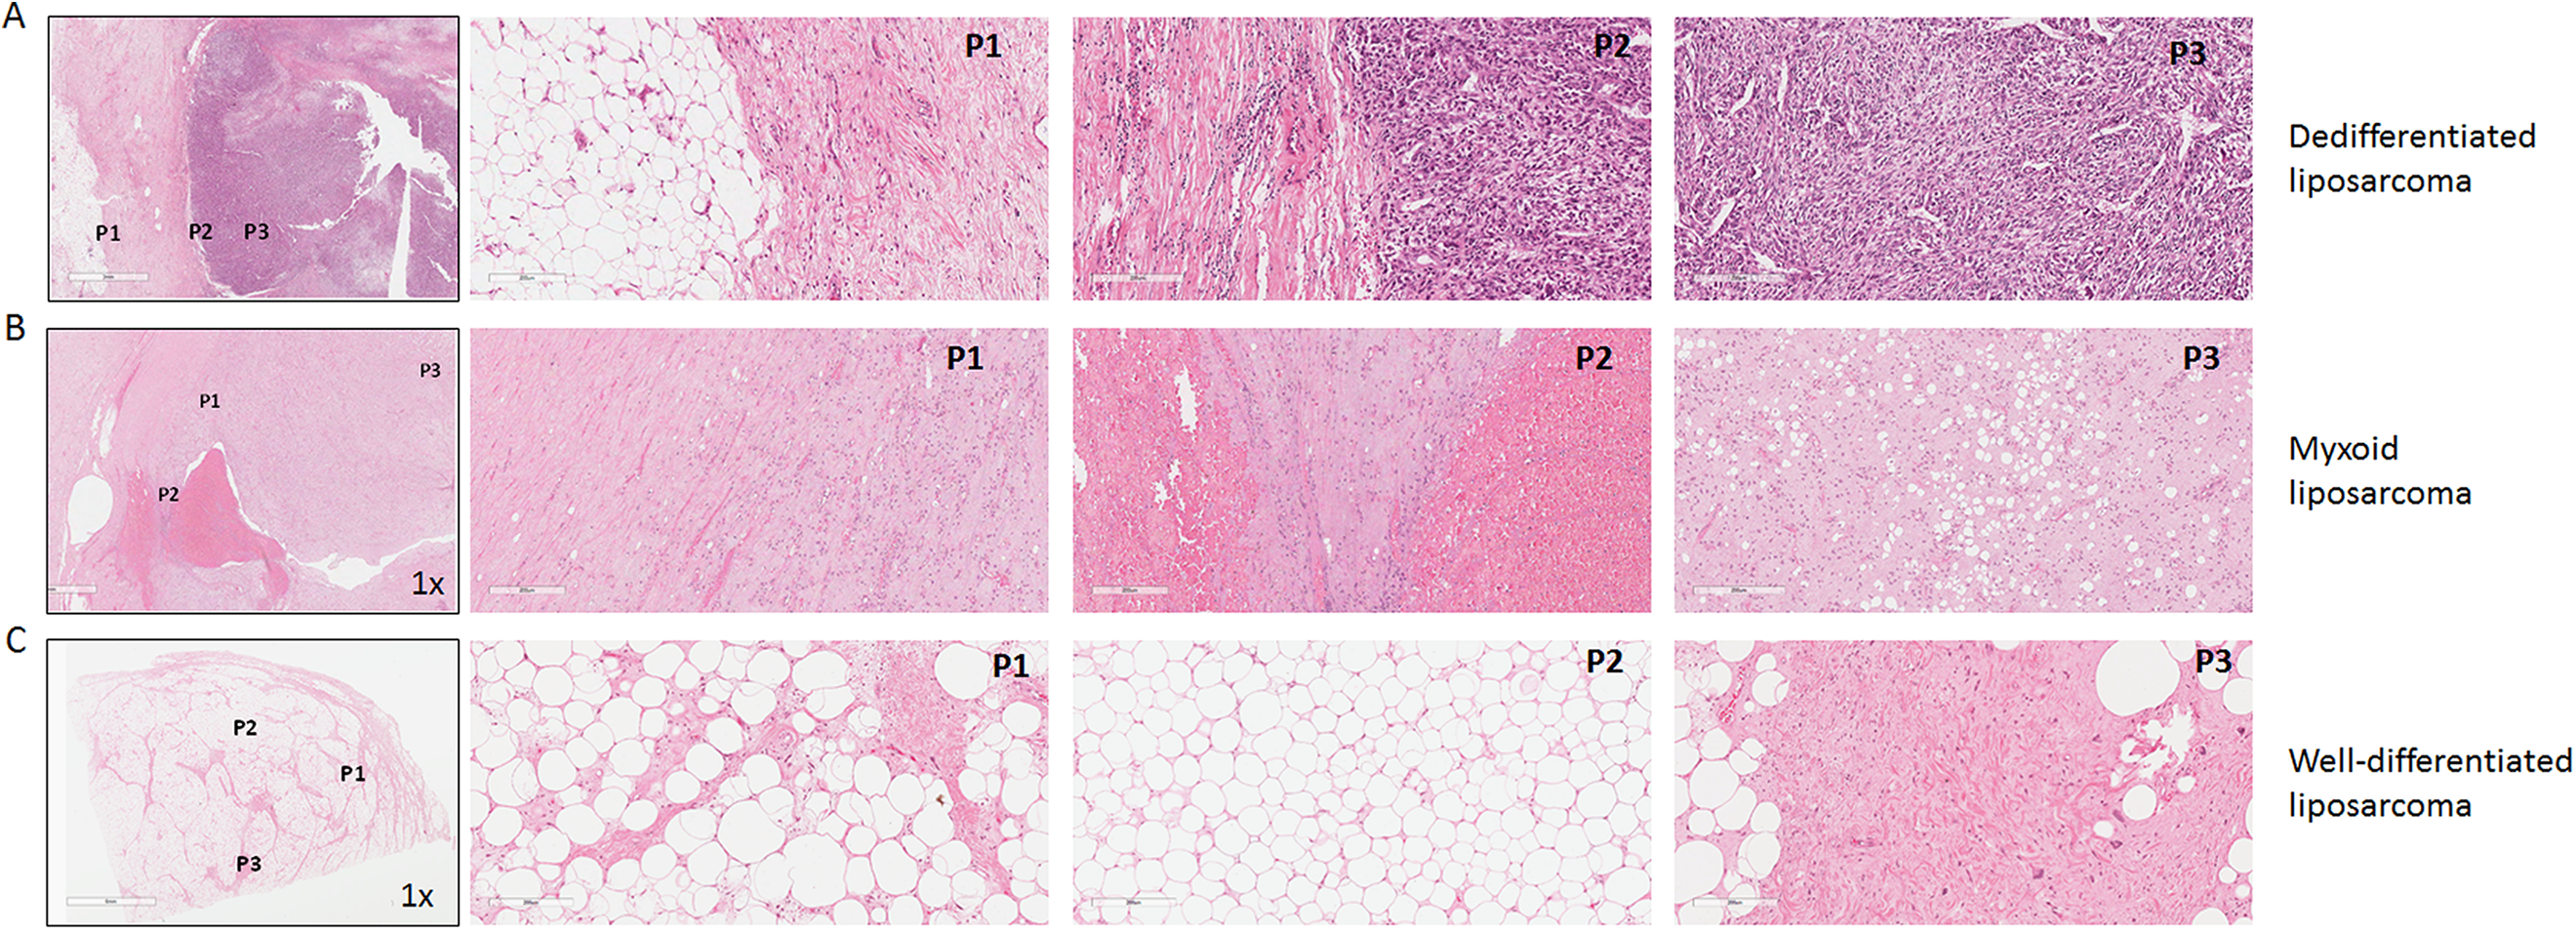
Figure 7 shows some interesting real cases in terms of inhomogeneity of the tumor tissues. In some cases, the tissue is composed by fat cells close to areas of fibrous tissues. In other cases, the inhomogeneities in adjacent areas are due to differences in cell density.
Moreover, Figure 8 shows that the inhomogeneities areas are macroscopic. In fact, superposing to the histology image with magnification 1× the area covered by a standard 7-needle electrode (dotted lines in Figure 8), the inhomogeneities between a needle pair appear to be evident.

Images of real specimens with the electrode area superposition and zoom of some interesting points in terms of inhomogeneity. (A) Dedifferentiated liposarcoma (P15 different area with respect to Figure 5) and (B) desmoid-type fibromatosis (P16).
Experimental Results for Material Characterization
The experiments performed to characterize the electrical conductivity of TMM and potatoes are resumed in Table 3. Potato conductivity as a function of the applied electric field is represented by a sigmoid function as the ones in Equation 3. The parameters of Equation 3 were evaluated by means of a fit of experimental data as in the study by Campana et al and Dughiero et al. 36,37 In particular, there is no relevant variations in the gel conductivities applying an electric field of 143 V/cm or of 715 V/cm (Table 4), whereas the difference in conductivity is relevant for potato samples as reported in Tables 4 and 5.
List of Ingredients for the Preparation of Phantom Materials.

Gel and Potato Conductivity at Different Electric Field Intensity.

a 715 V/cm for SC1′ and D2′ and 1000 V/cm for SC1 and D2.
Potato Resistivity and Conductivity Varying the Applied Electric Field and Parameters of Equation 3 Evaluated From Experimental Data.
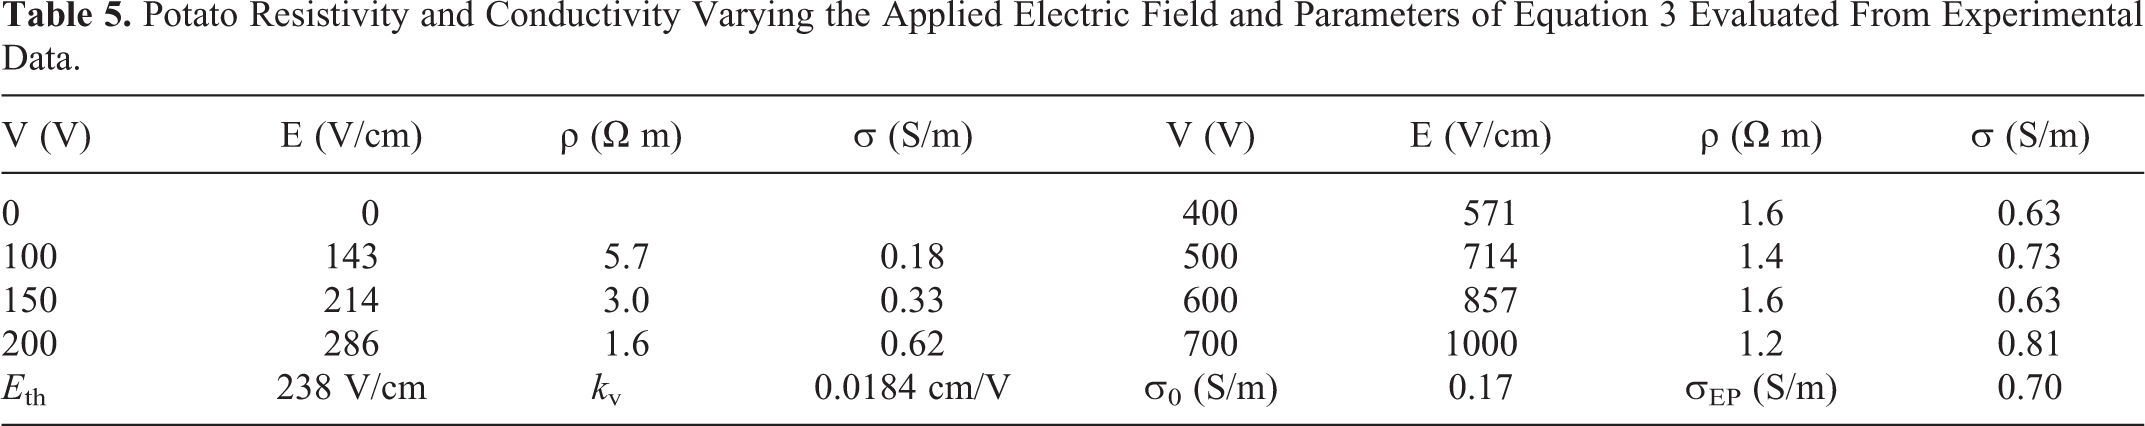
Considering the data reported in Table 5, it appears that, if the applied electric field increases, the resistivity decreases. From 143 to 286 V/cm, the variation in resistivity is larger than 40%, whereas for stronger electric field, it is close to 15% to 20%. From data in Table 5, the E th threshold and k v values in Equation 3 were evaluated fitting the experimental data by means of the minimum least square method. In this case, the E th threshold results equal to 238 V/cm and, considering the conductivity in Table 5, it appears that if the falling of the conductivity is close to 45% between 214 and 286 V/m, then it is close to the electric field at which occurs the half of conductivity gap. This value is coherent to the ones in the literature. 35,40 Finally, the coefficient k v results equal to 0.0184 cm/V.
Computation Results
Numerical computations were performed on the potato–gel phantom models following setup in Table 3 and considering conductivity data in Tables 4 and 5. Figure 2 reports the simulation results for model A in Figure 5 and the electric field evaluated in a homogeneous model (only potato). Figure 9 shows the electric field distribution in model B in Figure 5 and, finally, in Figure 10, and the electric field distribution in model C in Figure 5 is shown.

Electric field distribution of different configurations of the model B in Figure 3. The gray rectangle shows the potato area.

Electric field distribution of different configurations of the model c in Figure 3. The gray rectangle shows the potato area.
Figure 9 shows that the electric field distribution is affected by the conductivity of the band inserted into the parallelepiped. In particular, the lower the conductivity of the band, the greater the area of electroporated tissue (for potato, the electroporated value is considered, ρ(E) > 700 V/cm).
In the cases in Figure 10, the electric field distribution is affected by the conductivities of the material in the cylinder between the needles. Also in these cases, the cylinder modifies, according to the conductivity, the electric field lines. For instance, electric field intensity has a different behavior at the interface with the cylinder, depending on the material, D2 gel, SC1 gel, or potato.
Comparing the electric field distribution in the homogeneous case (Figure 2A) and the ones in the inhomogeneous cases, it is evident that the position of the line at 300 V/cm change considering different gel properties with respect to homogeneous cases. Its position is modified also in the potato tissue. The same occurs for the cases in Figures 9 and 10. The 300 V/cm electric field level is close to the electric field threshold for potato electroporation previously identified. 40,41,43
Experimental Results
Figure 11 shows the results of the experiments on potatoes. From Figure 11A, it appears that the potato piece close to the gel D2 shows an electroporated area greater than the potato approached to SC1 gel. The SC1 gel has a lower conductivity than D2. In the case of the cylinder, the electric field able to electroporate the potato covers a greater area compared to the case with the D2 gel, according to the computational results in Figure 10. The same accordance is with the strip geometry with D2 gel, where the electroporated area is larger than that in the SC1 gel case. This fact is in accordance with the simulation results where the position of the 300 V/cm electric field level was evaluated. Consequently, the area where the electric field is higher than 300 V/cm could be larger or shorter with respect to the homogeneous case. This fact is reflected also by the amplitude of the dark area in experimental results. For instance, if the material of the cylinder (eg, D2) in Figure 10A has a lower resistivity than the external tissue, the electric field intensity is lower than the one obtained considering the cylinder made on SC1 (higher resistivity with respect to the external tissue in electroporation condition). This fact is reflected also in the intensity of electroporation as evidenced in the experimental results (Figure 11C) where the D2 case shows a less dark intensity than the SC1 case.

Table 6 reports the amplitude of the voltage (it is set to 728 V for all cases) and current pulses. It appears that different experimental setups show different current amplitudes. The current amplitude is coherent with the inhomogeneity and the distribution of the electric field. For instance, if we consider the 2 models with the cylinder, in the case of the cylinder made of a more conductive material, for example, D2, the current is higher with respect to the case of the homogeneous model (only potato) and the one that considers a less conductive material, SC1, in the cylinder. On the contrary, in the model with the inhomogeneity shaped as a strip, the current value is higher when the material with higher conductivity, D2, is involved.
Voltage and Current Amplitude of the Pulses Applied to the Different Experimental Setup.a

a p represents potato tissue.
Discussion
The histological analysis of the presented sarcoma shows that in some cases the inhomogeneity of the tissues could be evident and very different from the electrical point of view. For instance, this arrangement, as shown in Figures 1 and 8, can generate a different distribution of the electric field, since the conductivity of fibrous tissue in nonelectroporated conditions is close to .8 S/m (the fibrous tissue could be considered, eg, approximately similar to cartilage tissue), whereas the conductivity of fat is close to.012 S/m. 44 Then, in this point, a discontinuity of normal component of the conduction field at the interface occurs. In fact, if the inhomogeneities of the tissue are macroscopic, as shown in Figure 8, in the area covered by the standard 7-needle electrode, some needle pairs can be inserted into different tissue types modifying the electric field distribution.
The effect of inhomogeneity is also evident in the analysis of the resistance related to the analyzed specimens. In fact, comparing data in Figure 1 and the histological images in Figures 7 and 8, the resistance variability is in accordance with the homogeneity or inhomogeneity in the tissue. For instance, for the cases P15, P16, and P18, the resistance is under 180 Ω (it varies in a range 40-160 Ω) and it could be noted that the value is more constant in case P18 where the tissue is more homogeneous (Figure 7B), whereas in the cases P15 and P16 varies substantially. The same behavior can be observed in the case P12 (2 different points were analyzed), but in this case the variation of the resistance is larger since it varies between 200 and 550 Ω. In this case, some area of fibrous tissue can be evidenced in the fatty tissue. The large volume of fat tissue increases the tissue resistivity. These differences could be due to the tissue inhomogeneity of the electroporated specimen as shown in Figures 7 and 8, since in the more homogeneous sample (P18) these variations are limited in a band of approximately 20 Ω. In fact, in the P12 specimen, the fatty component prevails with respect to the fibrous component.
These observations are also evident in the simulations obtained using potato and gel conductivity and in experimental models. In fact, the position of a specified electric field level is modified in the areas where the electrical conductivity changes. The displacement of the level line with a specified electric field intensity depends on the electrical conductivity. For instance, in the cases in Figure 9, if the strip in the middle has a lower conductivity with respect to the other volumes, panels A and D, electric field line at 300 V/cm (at this electric field level in potato, the electroporation is occurred 40,45 ) forms a larger band. For potato, the value of electroporated tissue is considered since the electric field in the middle of the 2 needles has an intensity able to electroporate potato cells. 40,46 On the contrary, in the cases shown in panels B and C, where the strip is more conductive with respect to the other 2 volumes, the electric field line at 300 V/cm forms a narrow strip. A similar behavior is shown in potato experiments in Figure 11. Considering the models where the inhomogeneity is like a cylinder, the electric field shows a behavior similar to the case that considers a strip with different electrical conductivities. Moreover, the positions of the different electric field levels in the cases of Figure 10 are different from the one obtained considering a homogeneous parallelepiped made only of potato tissue (Figure 2A). For instance, considering the potato with the cylinder made of SC1, the electric field line at 400 V/cm includes a larger area than the case of the cylinder made of D2, which is a more conductive material. Instead, the electric field line at 300 V/cm covers approximately the same area. This fact is reflected on the potato experiments where the potato shows a larger electroporated area in the SC1 case. The difference in electric field levels is also reflected in the current values reported in Table 6. In particular, the cylindrical inhomogeneity in the middle of the needle pair modifies the current value in opposite way with respect to the inhomogeneity shaped as a strip. In the case of the high-conductivity cylinder made of D2, the current is lower than that in the high-conductivity cylinder made of SC1.
The TMM and simulations were used by the author as a model to describe the electric field distributes in inhomogeneous tissues. In fact, the resistivity of the TMM could be easily designed changing the material composition. Consequently, it could be made close to the one of real tissue. On the other hand, potato tissue is useful to show electroporation effect since it becomes dark if cell electroporation occurs. 40 This way simulation and potato with gel experiment appear to be a useful model to compare experimental data and simulation results, since electrical properties of gel and potato could be known in an easy way like in the study by Bernardis et al. 43
The results showed the effect of the tissue inhomogeneity, opening the question about the effective distribution of the electric field in inhomogeneous tissues and the effective electroporation of the cells in the area of interest. In tissues, the effective electroporation has to be evaluated by means of suitable experiments. This aspect could be partially solved by a simulation model where the electric field intensity can be computed in all model area and compared with the known electroporation threshold. In this way, the voltage can be modified in order to obtain the optimal electric field intensity in inhomogeneous tissues modifying the applied voltage until all the treated area is covered by an electric field larger than the selected threshold. Nevertheless, the electric inhomogeneity is not a well-known parameter without a histological analysis. Consequently, it is not easy to define a formula to guarantee electroporation in this type of tissues. A possible solution could be increasing the pulse number in order to improve electroporation also at lower electric field levels. 26,47
Consequently, evaluating the analysis of the results obtained, the average electric field can be considered as a useful prediction of the effective electroporation zone even if only in some cases. In fact, it could be a good prediction if the electrical properties of different areas are close to each other, but it is not if the inhomogeneity areas show very different electrical properties.
Finally, this approach is difficult to apply in practice since it is not possible to know in advance the real inhomogeneity of the tissue in the treated tumor and the position of the needles with respect to the inhomogeneity. Nevertheless, this evaluation could show the behavior of the electric field in some inhomogeneous cases and it could evidence why in some cases the treatment could not be effective.
Conclusions
In this article, the authors showed how the electrical inhomogeneity of the tissues can affect the electric field applied in standard ECT. The effect of tissue inhomogeneity was analyzed using the macroscopic variation of the measured resistance coupled with the histological evidence of the treated volume. The effect of these differences on the electric field distribution was studied using some experimental phantoms where the tissue electrical characteristics were suitably designed. The experimental results were compared with simulation results. The effects of the tissue electrical properties on the electric field distribution were evidenced. The proposed analytical analysis is able to show the effect of the inhomogeneity in the tissues and how they can affect the therapy effectiveness.
Footnotes
Acknowledgments
Declaration of Conflicting Interests
The author(s) declared no potential conflicts of interest with respect to the research, authorship, and/or publication of this article.
Funding
The author(s) disclosed receipt of the following financial support for the research, authorship, and/or publication of this article: Project granted by CPDA138001 (Padua University).