
Abstract
This study quantifies the setup uncertainties to optimize the planning target volume (PTV) margin based on daily image guidance, its dosimetric impact, and radiobiological implication for intensity-modulated radiation therapy (IMRT) in head and neck cancer. Ten patients were retrospectively chosen who had been treated with IMRT and with daily image-guided radiation therapy (IGRT). The daily setup errors of the 10 patients from on-board imaging for the entire treatment were analyzed. Planning target volumes were generated by expanding the clinical target volumes (CTVs) with 0 to 10 mm margins. The IMRT plans with the same dose–volume constraints were created in an Eclipse treatment planning system. The effect of volume expansion was analyzed with biological indices such as tumor control probability, normal tissue complication probability (NTCP), and equivalent uniform dose. Analysis of 906 daily setup corrections using daily IGRT showed that 98% of the daily setups are within ±5 mm. The relative increase in PTV-CTV volume from 0 to 10 mm margins provides nearly 4-fold volume increase and is linearly related to monitor unit (MU). The increase in MU is about 5%/mm margin increase. The relative increase in NTCP of parotids from 5 to 10 mm margins is 3.2 ± 1.15. Increase in PTV margin increases extra tissue volume with a corresponding increase in MU for treatment and NTCP values. Even a small margin increase (eg, 1 mm) may result in increase of more than 20% in relative extra volume and 15% in NTCP value of organs at risk (OARs). With image guidance, the setup uncertainty could be achieved within ±5 mm for 98% of the treatments, and a margin <5 mm for PTV may seem desirable to reduce the extra tissue irradiated, but at the expense of a more demanding setup accuracy.
Keywords
Introduction
The tumor control probability (TCP) is directly related to radiation dose but may be at the expense of normal tissue complication probability (NTCP). Dose escalation is widely agreed to provide better TCP. On the other hand, normal tissue dosage needs to be reduced that is adjacent to the target volume. The margins needed for planning target volume (PTV) is dependent on internal target volume and setup uncertainty as defined by International Commission on Radiation Units & Measurements (ICRU), ICRU-50 and ICRU-62. 1,2 A conservative approach is to give a generous and large margin for the PTV, resulting in larger volume of healthy tissue being irradiated whereby dose escalation cannot be easily performed. This paradigm is slowly being addressed by image guidance that could provide opportunity in reducing the PTV margin. 3
Intensity-modulated radiation therapy is preferred over the conventional 3-dimensional (3D) conformal planning in cases where various normal tissues and organs at risk (OARs) are in close vicinity to target volumes. 4,5 This is especially relevant for head and neck (H-N) irradiation where intensity-modulated radiation therapy (IMRT) has become the treatment of choice due to its ability to preferentially spare OARs, such as the salivary glands and the parotids, while providing the desirable coverage to the target volume. 6 –10
Fundamental to the generation of a clinically optimal plan is the delineation of target volume and surrounding critical organs that have a direct impact on treatment planning. 11,12 Since the publication of ICRU-50, 1 the concept of margins for gross target volume (GTV), clinical target volume (CTV), and PTV has been used in external beam radiation therapy. Delineation of target volumes and OARs becomes more complicated in the presence of dental work and other high contrast media in the treatment volume. The problem in target delineation may be further complicated when clinical experience becomes part of the decision process, for example, the extension from GTV to CTV. Thus, for high-risk patients, a larger margin may be used for the CTV than that for the lower risk patients. Subsequent ICRU publications concerning margins emerged 2,13 due to evolving technologies and considerations of the effects of target motion. It has long been recognized that there is a need to quantify the PTV margin so that the target volume is adequately covered for a given prescribed dose and the doses to OARs are minimized.
The overall uncertainty caused by organ motion and setup errors is commonly referred to as the geometrical uncertainty. Geometrical uncertainty may be due to systematic errors in the system (computed tomography [CT] simulation, treatment planning system [TPS], treatment delivery system, etc) and it may also be due to random errors (daily setup variations, etc). The effects of geometric uncertainty on the choice of margins in treatment planning have been studied extensively by several investigators. Using 2-dimensional (2D) orthogonal films, 14 –19 daily patient setup uncertainty was determined by comparing the acquired 2D images (KV-KV, KV-MV, or MV-MV) with the corresponding reference 2D images such as digitally constructed radiographs (DRRs) or simulator radiographs. 15,20 Using 3-D cone beam CT (CBCT), setup variations in H-N patients were determined and the margins used in the treatment planning were assessed. 21,22 By convolving the random translational and rotational uncertainties with a static dose distribution, an equation for margin was proposed to estimate the expansion of CTV to define PTV. 18
A question arises. Does a CTV expansion margin, which provides the desirable coverage of the PTV, also satisfy dose–volume constraints for the OARs? It is obvious that larger margins provide better coverage to the target compared to smaller margins, but at the expense of a larger volume of the normal tissues irradiated.
Clinically, the margins used to define PTV vary among clinicians and different institutions and found to be in the range of 1 to 10 mm for H-N IMRT. 23 In H-N IMRT, organ motion is mainly associated with patient movement. The use of an immobilization device (such as a standard S-frame with a thermoplastic mask and head rests, etc) may reduce organ motion to a minimum. On the other hand, setup errors may be estimated from the daily shifts of the treatment couch between the planning isocenter and treatment isocenter with image guidance.
All previous studies on PTV margin, in particular for H-N irradiation, were focused on the target coverage. The impact of the PTV margin on the extra normal tissue (PTV-CTV) irradiated has been addressed qualitatively by Verellen et al 3 but quantitative analysis is missing from the literature. Another issue associated with the size of the expansion margin is the resulting monitor unit (MU) required to deliver the dose, a subtle effect that has not been addressed in previous publications on margin study. A larger MU leads to higher whole body dose due to leakage and scatter radiation. We have carried out a systematic study to address these 2 issues. Specifically, we attempted to quantify the setup uncertainties from the daily image-guided radiation therapy (IGRT) images and the radiobiological implication of NTCP and equivalent uniform dose (EUD) as a function of margin expansion for the surrounding normal structures to optimize the PTV margin.
Materials and Methods
Ten H-N patients were retrospectively chosen for the study who had been treated with IMRT in conjunction with daily IGRT. Patients were immobilized using standard S-frames with thermoplastic masks and head rests and simulated on a GE CT scanner, model GE Light Speed 16/64 (GE Healthcare, Milwaukee, Wisconsin) with 2.5 mm slice thickness. Images were sent to the Eclipse TPS, Version 9.0 (Varian Medical Systems, Palo Alto, California) for planning. The GTV, CTV, and OARs were delineated by the same physician. For each patient, various PTVs were generated by expanding the CTV with a given uniform margin in the range from 0 to 10 mm (0, 1, 2, 3, 5, 7, and 10 mm). For each expansion margin, a standard 9-field coplanar IMRT plan with equally spaced gantry angles for 6 MV photons was generated subject to the same optimization criteria for PTV and OAR. The dose–volume constraints consist of minimum, maximum, and mean doses to the PTV as defined by ICRU-83 13 and the OARs as well as specific dose–volume points for each structure. In the present study, we allowed up to a maximum of 300 iterations in the dose optimization process to balance between the efficiency in optimization and the quality of the plan. The final dose distributions were calculated with a grid size of 2.5 × 2.5 mm2 using the anisotropic analytical algorithm for inhomogeneity correction. Dose volume histogram for the PTV and OAR was calculated for each plan. In addition, the extra volume of normal tissue (Vex) irradiated was determined by subtracting CTV from PTV. The PTV volume, extra tissue volume (Vex), relative Vex as defined by ([PTV − CTV]/CTV) and the total MU required were recorded for all IMRT plans.
To examine the radiobiological effects on OARs due to the change in the PTV margins, the NTCP of parotid gland and EUD of brain stem were also calculated. Lyman-Kutcher-Burman model 24,25 was used to calculate the NTCP by using the published values of TD50/5, m, and n, where TD50 is an uniform dose that produces 50% complication risk after 5 years, m is the slope parameter of the sigmoid curve, and n is the volume factor for a particular OAR of interest. Parameters used to calculate NTCP of the parotid gland and EUD of brain stem are TD50 = 25 Gy, m = 0.18, and n = 0.7 and TD50 = 65 Gy, m = 0.16, and n = 0.14, respectively. 26
Mathematical expressions for NTCP and EUD are as follows:

where ϕ(x) is the probit function as defined in Equation 2:

where EUD is the generalized EUD, v i is the partial volume receiving dose D i, and n is a dimensionless tumor or normal tissue-specific parameter.
For simplicity, CTV is assumed to be either spherical or cubic with dimension r and m is the margin added to CTV to form the PTV. The extra tissue irradiated, V ex can be calculated from Equation 4:

For a given patient, r is constant. Equation 4 can be simplified as

The relative extra volume dose was analyzed along with biological indices (TCP, NTCP, and EUD). The daily setup errors for the 10 patients were obtained from the On-Board Imager (OBI) with which IGRT was performed for each patient before their daily treatment for the entire treatment course. General clinical practice is to use image guidance to help set up the patient with reference to the treatment isocenter generated from TPS. To quantify the setup uncertainties, 2D orthogonal images were acquired prior to the treatment and were matched with the corresponding DRR generated during the treatment planning process. The amount of shifts of the treatment couch required to match the treatment isocenter with the planning isocenter was calculated along the lateral (x), anteroposterior (y), and craniocaudal (z) directions which also represent the setup errors.
Results
The shift data points in x–y–z direction over the entire treatment for 10 patients, total of 906 data points are shown in Figure 1. Only 1.6% (14 of 906) of the data points is beyond the +5 mm and 0.9% (8 of 906) of the data points (0.9%) is lower than the −5 mm limits. Figure 1 also shows that the data points are randomly distributed. Thus, more than 98% of the points have a setup error within ±5 mm based on the daily IGRT. On the other hand, only 85% and 80% of the daily setup had shifts of less than or equal to ±4 mm and ±3 mm, respectively.

Plot of setup errors determined from daily On-Board Imager (OBI) over the entire treatment course for 10 head and neck (H-N) patients. Note that only a fraction of points are over ±5 and ±7 mm boundaries defined by the 2 horizontal lines.
The impact of margin on the MU in a treatment plan is examined by plotting the volume of PTV versus the total MU as shown in a scatter plot in Figure 2. In general, the MU required increases linearly with the PTV volume with a regression coefficient (r 2 = .568). The wide scatter of data points in Figure 2 reflects the variation in plan optimization with inverse planning as well as the variation in the CTV volume among the 10 patients.

The correlation of planning target volume (PTV) and the resultant monitor unit in the plan to cover the volume with the prescribed dose.
The relative increase in Vex (relative) is plotted as a function of the margins in Figure 3. For each patient, a cubic polynomial is fitted to the data points as suggested by the fact that PTV = CTV + Vex and Vex ∼ (margin)3. The average regression coefficient (r 2) is .996 and variation in standard deviation of r 2 is .002.

Variations of Vex (relative) with PTV margin for the 10 head and neck (H-N) patients. Vex is planning target volume (PTV) − clinical target volume (CTV). Each curve represents a patient. Symbols are active data and line fit to cubic equation as shown in Equation 5. Vex indicates extra volume of normal tissue.
The value of Vex (relative) for a margin change from 1 to 10, 3 to 10, and 5 to 10 mm is 7.1, 3.8, and 2.2, respectively.
To gain more insight on the effect of margin expansion on the total MU required in the treatment plan, MU is plotted versus margin in Figure 4. The relative increase in MU for margin change from 1 to 10, 3 to 10, and 5 to 10 mm is 1.6, 1.5, and 1.4, respectively. On the other hand, the relative increase in MU for margin change from 1 to 5, 2 to 5, and 3 to 5 mm is 1.2, 1.2, and 1.1, respectively, for these H-N patients. The increase in MU with respect to margin increase creates a dilemma in that the improved in coverage also leads to extra dose delivered to whole body as reported in many literatures 27 –30 and should be avoided. For each patient, a cubic equation may be fitted to the data points with an average R 2 of .997.

Variation in the resultant MU required as a function of margin expansion for each patient. Monitor unit (MU) is not directly correlated with linear dimension of the expansion. Each curve represents a patient.
The radiobiological consequence of increasing Vex as a result of margin change is illustrated with the NTCP calculation for the parotid glands. Figure 5 shows a plot of NTCP of the right parotid versus margin. It is noticed that NTCP of the right parotid gland varies as a quadratic function with margin, indicating that more damage is expected with increasing margin. For the 10 patients in this study, the average regression coefficient (r 2) is .99 ± .01. Similar pattern was also observed for the left parotid gland. The relative increase in NTCP of the parotids for margin change from 1 to 10, 3 to 10, and 5 to 10 mm is 4.5, 3.6, and 2.5, respectively. On the other hand, the relative increase in NTCP for margin change from 1 to 5, 2 to 5, and 3 to 5 mm is 1.8, 1.7, and 1.5, respectively, for these H-N patients.
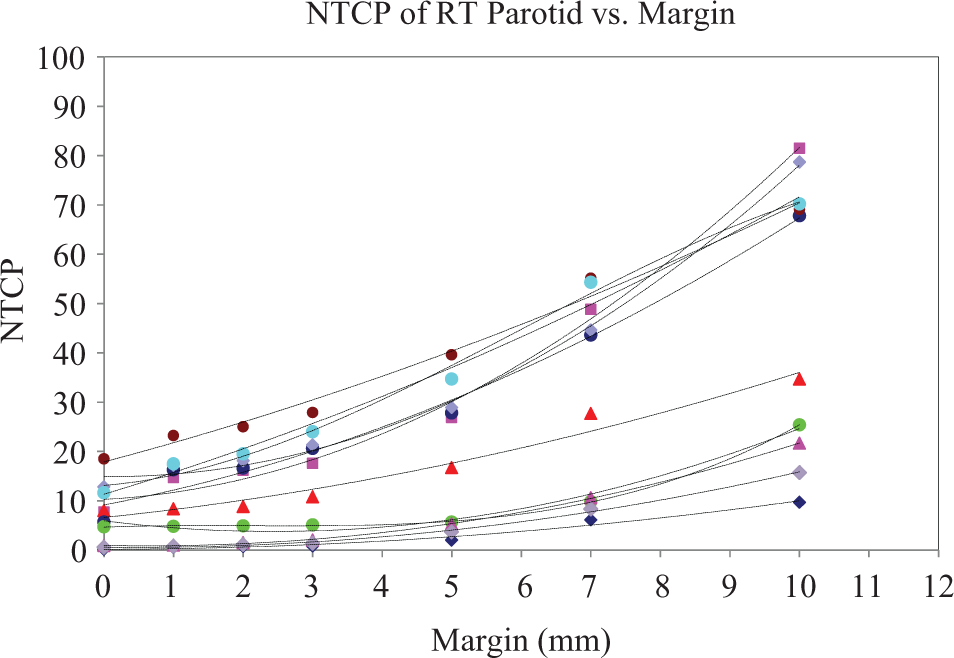
Plot of normal tissue complication probability (NTCP) of right parotid versus margin. Ten graphs represent 10 patients.
The effects of margin increase in Vex, MU, and NTCP are summarized in Table 1 for the various margins used in this study. An increase in margin from 1 to 10 mm results in the largest increase in Vex, MU, and NTCP.
The Effects of Margin Increase in Vex, MU, and NTCP.

Abbreviations: MU, monitor unit; NTCP, normal tissue complication probability; Vex, extra volume of normal tissue.
As a rule of thumb, as margin increases Vex, MU, and NTCP all increase as cubical polynomial. It is also found that EUD of brain stem increases with margin quadratically with an average regression coefficient (r 2) of .97 ± .027. Average relative increase in EUD of brain stem from 3 to 10 and 5 to 10 mm margin is 1.8 and 1.4, respectively.
Discussion
The PTV is generated from CTV with a certain margin expansion. However, margin depends on immobilization and motion control. The IGRT provides a unique avenue in reducing setup errors. It is known that margin increases OARs dose and the normal tissue volumes. The increased PTV volume also leads to an increase in the MU required to achieve similar dose conformity and the NTCP values.
With proper immobilization and IGRT, it is possible to achieve a setup uncertainty within ±5 mm for 98% of the H-N treatments. Although 4 mm margin is definitely better in terms of volume irradiated and OAR sparing but only 85% (770 of 906) of the setup data in our study meet this criterion. With even smaller margins, the volume of extra tissue irradiated and the OARs dose will be smaller but patient setup uncertainty will increase. Even though some institutions may achieve better setup uncertainty as shown by Suzuki et al, 23 5 and 3 mm margins for PTV and OAR were adopted, respectively.
The PTV volume and MU for every patient are linearly related (MU = 0.844PTV + 595; r 2 = .6). The relative MU increase is 1.7 ± 0.20, 1.54 ± 0.14, and 1.4 ± 0.10 for margin increase from 0 to 10, 3 to 10, and 5 to 10 mm, respectively. Such increases (70%, 54%, and 40% in MU) should be avoided since extra MU is also potentially related to the whole body exposure. 27 –30 On the other hand, a 1-mm margin change (eg, from 4 to 5 mm) is often accepted treatment planning with little concern if the PTV coverage is improved to meet the planning objectives. It is interesting to note that the corresponding increase in Vex, MU, and NTCP (parotid) is 22%, 5%, and 15%, respectively, which are not insignificant. Even larger increase in Vex and NTCP (parotid) is resulted for margin increase from 2 to 3 and 3 to 4 mm, which is 41%, 17% and 28%, 27%, respectively. The MU increase, however, is around 5% for both.
We have shown that extra tissue volume and the total MU are both cubic functions of margin. Thus for larger tumor, more MU is required. Further increase in margin will result in increase in MU following a cubic polynomial, which will potentially increase whole body dose and secondary incidence of cancer. Verellen and Vanhavere 30 estimated a whole body dose equivalent of 1969 mSv for head and neck IMRT and predicted the risk of secondary malignancies with a factor of 8 in comparison with 3D conformal head and neck radiation therapy. They reported estimated whole-body equivalent dose was 2.73 × 10⁻² mSv/MU with head and neck IMRT using 6 MV photon beam. The associated cancer risk may be estimated from the percentage increase in MU for a given margin increase as presented in this study. The cancer risk could increase up to 70%, 54%, and 40% for margin increase from 0 to 10, 3 to 10, and 5 to 10 mm, respectively. Thus, any further increase in MU due to margin increase will lead to increase in whole body dose equivalent. On the other hand, since 6 MV is used for H-N IMRT, there is insignificant activation of treatment head and/or concretes in the treatment room.
There are few limitations in our study. The matching of 2D/2D or 3D/3D images during IGRT can be very subjective and sometimes it could be misleading due to rotations of patients. It is very difficult to differentiate shifts due to rotation and yaw from those due to translation. One of the possible solutions for these shifts is to have 6-dimensional couch to correct not only translational but also rotational, pitch, and yaw. Many investigators have also addressed these issues. 21,22
Various investigators have proposed 5 mm expansion margin for CTV in head and neck IMRT. Suzuki et al 23 have analyzed interfractional setup errors and organ motion during head and neck IMRT and concluded that 5 mm expansion margin for CTV is adequate. Our study on the analysis of the OBI data has shown similar results. A recent study by Selvaraj et al 31 described nicely the implication of PTV margin on the radiobiological indices such as TCP and NTCP. They concluded that to achieve higher dose conformity, a larger margin is needed. There is a delicate balance between reducing margin and dose conformity in order to maximize TCP while reducing the NTCP of the OARs of interest.
The IGRT corrects for patient setup errors but it does not eliminate all setup uncertainties as images taken in IGRT process are snap shots of patient positioning. To ensure that PTV is adequately covered with daily IGRT, a margin is needed. In our study, we observed, based on daily OBI shift results, that by increasing expansion margin of CTV from 3 to 5 mm, the percentage of treatments in the 95% isodose line covers PTV could be improved from 80% to 98%. The additional 2 mm margin from 3 to 5 mm may be considered as margin required for residual errors, which is not accounted for by the 3 mm margin even with daily IGRT. Djordjevic et al 32 suggested that daily IGRT required PTV margin from 2.3 to 6.8 mm. Our results seem to be consistent with their findings. It should be pointed out that our result of 5 mm margin for CTV expansion is from snap shots of patient positioning. In reality, the margin may be more or less than 5 mm depending on patient anatomy and IGRT techniques such as OBI, CBCT, MVCT, and Calypso.
Conclusion
With daily IGRT using an on-board imaging or other imaging devices, the setup uncertainty could be easily achieved within ±5 mm for 98% of the H-N treatments. Increase in PTV margin increases extra tissue volume with a corresponding increase in MU for treatment and NTCP values. Even a 1-mm margin increase may result in >20% increase in Vex and 15% NTCP values (for the parotids in our study). The increase in MU is around 5%/mm margin increase. Relative extra tissue volume, NTCP, and EUD of OARs increase with increase in margin. On the other hand, margin reduction will definitely result in lower dose to OARs and possibly reduce the probability of complications. A PTV margin <5 mm may seem desirable to reduce the extra tissue irradiated but at the expense of a more demanding setup accuracy.
Footnotes
Abbreviations
Declaration of Conflicting Interests
The author(s) declared no potential conflicts of interest with respect to the research, authorship, and/or publication of this article.
Funding
The author(s) received no financial support for the research, authorship, and/or publication of this article.