
Abstract
This article proposes quantitative analysis tools and digital phantoms to quantify intrinsic errors of deformable image registration (DIR) systems and establish quality assurance (QA) procedures for clinical use of DIR systems utilizing local and global error analysis methods with clinically realistic digital image phantoms. Landmark-based image registration verifications are suitable only for images with significant feature points. To address this shortfall, we adapted a deformation vector field (DVF) comparison approach with new analysis techniques to quantify the results. Digital image phantoms are derived from data sets of actual patient images (a reference image set, R, a test image set, T). Image sets from the same patient taken at different times are registered with deformable methods producing a reference DVFref. Applying DVFref to the original reference image deforms T into a new image R′. The data set, R′, T, and DVFref, is from a realistic truth set and therefore can be used to analyze any DIR system and expose intrinsic errors by comparing DVFref and DVFtest. For quantitative error analysis, calculating and delineating differences between DVFs, 2 methods were used, (1) a local error analysis tool that displays deformation error magnitudes with color mapping on each image slice and (2) a global error analysis tool that calculates a deformation error histogram, which describes a cumulative probability function of errors for each anatomical structure. Three digital image phantoms were generated from three patients with a head and neck, a lung and a liver cancer. The DIR QA was evaluated using the case with head and neck.
Introduction
Several commercial software packages provide deformable image registration (DIR) tools to enhance target delineation in the era of intensity-modulated radiation therapy, image-guided radiation therapy, and image-guided adaptive radiation therapy. 1–3 Moreover, researchers continue to develop new DIR algorithms—diffeomorphic demons, 4–9 diffeomorphic morphons, 10 optical flow, 11,12 finite element model (FEM), 13–15 small deformation inverse consistent linear elastic, 16 thin plate spline, free form deformation, 17–21 and Markov random field 22 —reflecting the growing interest in deformable contours for adaptive radiation therapy and composite dose visualization of multiple treatment plans.
In order to introduce these DIR tools into clinical practice, established quality assurance (QA) and acceptance test procedures are essential. Although there have been many research efforts 15,23–36 to devise a quantitative evaluation method for DIR, robust QA and acceptance test procedures are still lacking. In this article, we implemented a localized error analysis tool proposed by Wang et al, 35 which displays a color-keyed map of deformation registration errors on each image slice. In addition, a global error analysis tool is presented that calculates deformation errors per anatomical structure. This new tool is called a deformation error histogram (DEH). These tools are useful for quantifying intrinsic errors of DIR systems, but a truth set consisting of a reference image set, a test image set, and a deformation vector field (DVF) is needed as a benchmark. Previous efforts have not translated into realistic clinical use. In this regard, a novel truth set reconstruction method is proposed. A truth set created from the proposed method is called a “digital image phantom” and consists of a reference image set, a test image set, and a DVF. A “phantom” refers to a known object (or set of files—thus “digital”) which is used to benchmark a system. In this application, the digital phantom is created from actual patients for QA of multiple anatomical sites so that a generated truth set may be used in clinics and made available to the community for analyzing DIR errors.
Overview of DIR
Deformable image registration is a process to find the best-estimated DVF, which forms the voxel correspondence between 2 different image sets. In other words, DIR finds a matrix that represents how individual voxels of 1 image are “deformed” (moved, etc), so they optimally line up with corresponding voxels from another image. Figure 1 shows a schematic of the DIR process. For a given spatial transformation (a DVF), the interpolator applies the transformation to a test image and compares the transformed test image with the reference image. The metric evaluates the degree of similarity between the reference image and the transformed test image. The optimizer can now estimate the best candidate for the DVF. A newly estimated DVF is used by the interpolator for the next iteration. Iteration continues until the metric of similarity satisfies the given criteria or threshold. The performance and accuracy of the DIR depend on the configuration settings of each component, similarity measure, interpolator, and optimizer.

Diagram of deformable image registration process.
There are multiple DIR algorithms available such as B-spline, demon, and FEM registration. Although the different methods utilize the same general iterative process described in Figure 1, they can arrive at different results, given the distinct similarity measures such as mutual information (MI) 37 or statistical approaches. 38–40 Additionally, the algorithms’ decision on when an image is successfully deformed to another image is central to how the algorithm arrives at the final iteration. Furthermore, different methods for image interpolation after the transformation (linear interpolation, cubic spline interpolation, and sinc interpolation) result in different end points. The selection of the interpolation method can affect the calculation time and accuracy of the registration. 37,41 Regular step gradient descent, stochastic gradient descent (SGD), and limited-memory Broyden-Fletcher-Goldfarb-Shanno (L-BFGS) are some of the available choices for optimizers. Regular step gradient descent is a generally well-known optimizer. 42 The L-BFGS can find a good registration for most DIRs but consumes a lot of calculation time. 42 Stochastic gradient descent can find a comparable result in reduced calculation time. 43
Components outside the core DIR process can also affect the characteristics and/or effectiveness of a registration. Image modality, allowed duration of the optimization process (iteration time), tissue type focus (soft tissue vs. bone, for example), and registration’s purpose (image registration vs. transformed contour) can affect the results. Moreover, most DIR implementations utilize randomly sampled pixels to reduce calculation time. An accurate evaluation of systematic and random errors in a DIR system is essential before utilizing a DIR package for clinical applications.
Previous Approaches to DIR QA
Image subtraction approach
The traditional method of DIR system evaluation involves a paired image set composed of a reference image, R, and that same reference image deformed using an artificial DVF (DVFartifiical) to produce the test image, T artificial. 35 To test the DIR, T artificial is registered to R. The DVF created (DVFtest) should match DVFartificial. There are 2 analysis methods that can be used to quantify the accuracy of the registration. The image subtraction method compares the intensity difference between the reference image and the registered test image after DIR. A shortfall of using image difference analysis is measuring registration errors in regions where the neighboring pixels have the same intensity values. It is possible that 2 voxels may have the same value but should not be aligned to each other. A difference image would not show differences in the region, although the voxels are not registered correctly by location.
Artificial DVF comparison
Artificial DVF comparison is the second approach, 34,44 which compares the given DVFartificial and the new DVFtest. Although a DVF comparison can overcome the shortfall of image subtraction analysis, both traditional approaches utilize an artificial DVF. However, comparing artificial DVFs may be unrealistic if it is assumed to apply to images of the full range of human anatomy. The unique characteristics of deformations at different anatomical sites may be unsuitable for a single DIR setting. For example, head and neck, lung, and liver anatomies may deform in different ways, demanding unique solutions and QA. Although some DIR software packages do provide anatomic-specific parameters, optimal settings are unknown since quantifiable QA of the results are missing.
Landmark-based approach
Previous efforts 24,25,28,29,45 to evaluate image registration errors utilize patient landmarks that appear within the image and quantifying their deformation and registration. Researchers typically employ visual checks that compare manually designated landmarks such as point of interests or organ contours between 2 image sets. Brock and Consortium 24 and Castillo et al. 25 developed a software tool to generate large landmark point sets automatically. They produced a large number (>1000) of matching landmark point sets for lung image sets. Similarly, Brock and Consortium 24 utilized manually chosen landmark point sets to compare DIR results among multiple institutions.
In these landmark-based approaches, 2 different image sets are utilized from the same patient. An expert physician finds matching landmarks between 2 image sets; after DIR, the landmarks on the test image set should be matched with the landmarks corresponding to the reference image set. By measuring the distance between the reference landmark point and the registered landmark point on the test image set, the error magnitude of the image registration system can be measured as maximum and an average distance to agreement. These approaches quantify the correlation between the computerized image registration and human visual judgment.
Vaman et al. 33 devised a way to reduce the number of landmarks since entering a large number of landmark points is clinically tedious and impractical. To quantify the errors in a DIR for 4-dimensional computed tomography (CT) image sets, they applied principal component analysis (PCA) to landmark patient motion due to respiration. The PCA can estimate the fundamental eigenmodes of human respiration and difference between the eigenmodes from the landmarks and the eigenmodes from the deformation vectors were measured. They showed their efficacy by comparing eigenmodes from randomly selected subsets of landmarks. They also found that validation through a selected small number of landmarks can lead to unrepresentative results.
Murphy et al. 30 recently utilized a similar scheme using a small number of landmarks to estimate the uncertainty in daily dose mapping due to DIR error. Although their efforts made significant progress, these landmark-based approaches have significant limitations. Visual verification of landmarks can only be performed where significant image features exist (ie, at limited sites). As well, intrinsic uncertainties of DIR in regions with no image features cannot be measured with these techniques. Figure 2 illustrates the shortfall of landmark-based approaches. The left graphic is an initial planning CT image, and the right graphic is a follow-up CT image. The clinical target volume (CTV) contour is shown in red and 2 corresponding points are marked on both images. The points A and A′ have significant image features, so we can confirm their correspondence visually. However, the points B and B′ have no significant image features near the point, and therefore, their correlation may be incorrect. Without a method to evaluate the deformation magnitude of error in regions of similar image features, quantitative analysis of deformation accuracy remains limited.

An illustration demonstrating the shortfall of landmark-based approaches. The points A and A′ have significant image features, so we can visually confirm correspondence. However, the points B and B′ have no significant image features and lack methods to evaluate the robustness of the deformation.
Unbalanced energy approach
Zhong et al. 36 utilized unbalanced energy analysis that compares the DVF between DIRs using FEM and B-spline registrations and demon registrations. The group found deformation vectors calculated by the FEM and the B-spline methods showed a 2-mm average difference near organ edges. This result is in accordance with previous landmark-based approaches. However, in regions with no significant gradient features, deformation vectors from various DIR methods demonstrated much larger differences up to 10 mm. 36 Although this method provides the DVF comparison between DIRs, 2 numerical phantoms were used, in which one was fabricated using artificial bladder, prostate, rectum, and femoral head structures and another one was created from a patient with lung cancer using a known DVF. This indicates that the utilized numerical phantoms do not reflect a realistic environment in a clinic.
Other approaches
Physical deformable phantoms were proposed to validate the accuracy of DIR. 46–48 These efforts have a strong advantage in exact matching of voxels after performing DIR. However, it is very difficult to mimic all anatomical structures in a clinical environment and not realistic. Varadhan et al 34 proposed a framework for DIR validation using ImSimQA (Oncology Systems Limited, Shrewsbury, Shropshire, United Kingdom) and 3DSlicer (Open Source Software Package, http://www.slicer.org) tools. Two image sets as a validation data of DIR were created with a deformation using ImSimQA. After performing DIR between the created 2 image sets, 2 deformation fields, anatomical correspondence, and image quality were analyzed using 3DSlicer. Although the validation scheme of this research is reasonable, this technique also used artificial image sets, not clinical.
New proposed approach
As an alternative solution to DIR QA described in the previous sections, we propose a new DIR QA procedure for practical clinical use. This work was partially introduced in our previous research. 49 This approach was also proved as an indicator that can show DIR accuracy by using patients with liver and lung. 50 Pukala et al used the similar concept of the digital image phantom for kVCT volumetric image sets of head and neck. 51 Nie et al utilized the same histogram to quantify deformation errors of DIR systems, but they did not consider the error histogram for each anatomical structure. 44 Digital image phantoms generated from deidentified clinical cases (which consists of a reference image set (R′), a test image set (T), and a reference DVF for various anatomical sites) are made available to clinics via the Web as downloadable content. Further, a set of QA tools composed of local and global error analysis systems analyze clinically registered images. Local error analyses display deformation errors via color maps on each image slice and the global error analysis tool can review error per voxel and/or structure of interest (SOI) using a DEH. Tools and digital image phantoms are utilized locally to evaluate individual clinical systems.
Materials and Methods
Theoretical Process of Generating a Truth Image Set
Our proposed QA process requires 2 image sets and a true DVFref. We start with 2 image sets (image set R and T) for the same patient taken at different times; the initial image set R and the later image set T are set as a reference image set and a test image set, respectively. Figure 3 shows the processes to generate a digital image phantom set. At completion of the DIR, the algorithm finds a DVF, which is a map of deformation vectors from pixels or grids in the test image to those in the reference image, assigning the DVF as a DVFref and convolving the test image T with DVFref to generate the image R′. Therefore, the DVFref between the image set R′ and the image set T becomes the “true” deformation. In summary, we applied a realistic DVF to an image set to generate a deformed image set for creating QA image data instead of using an artificial DVF.
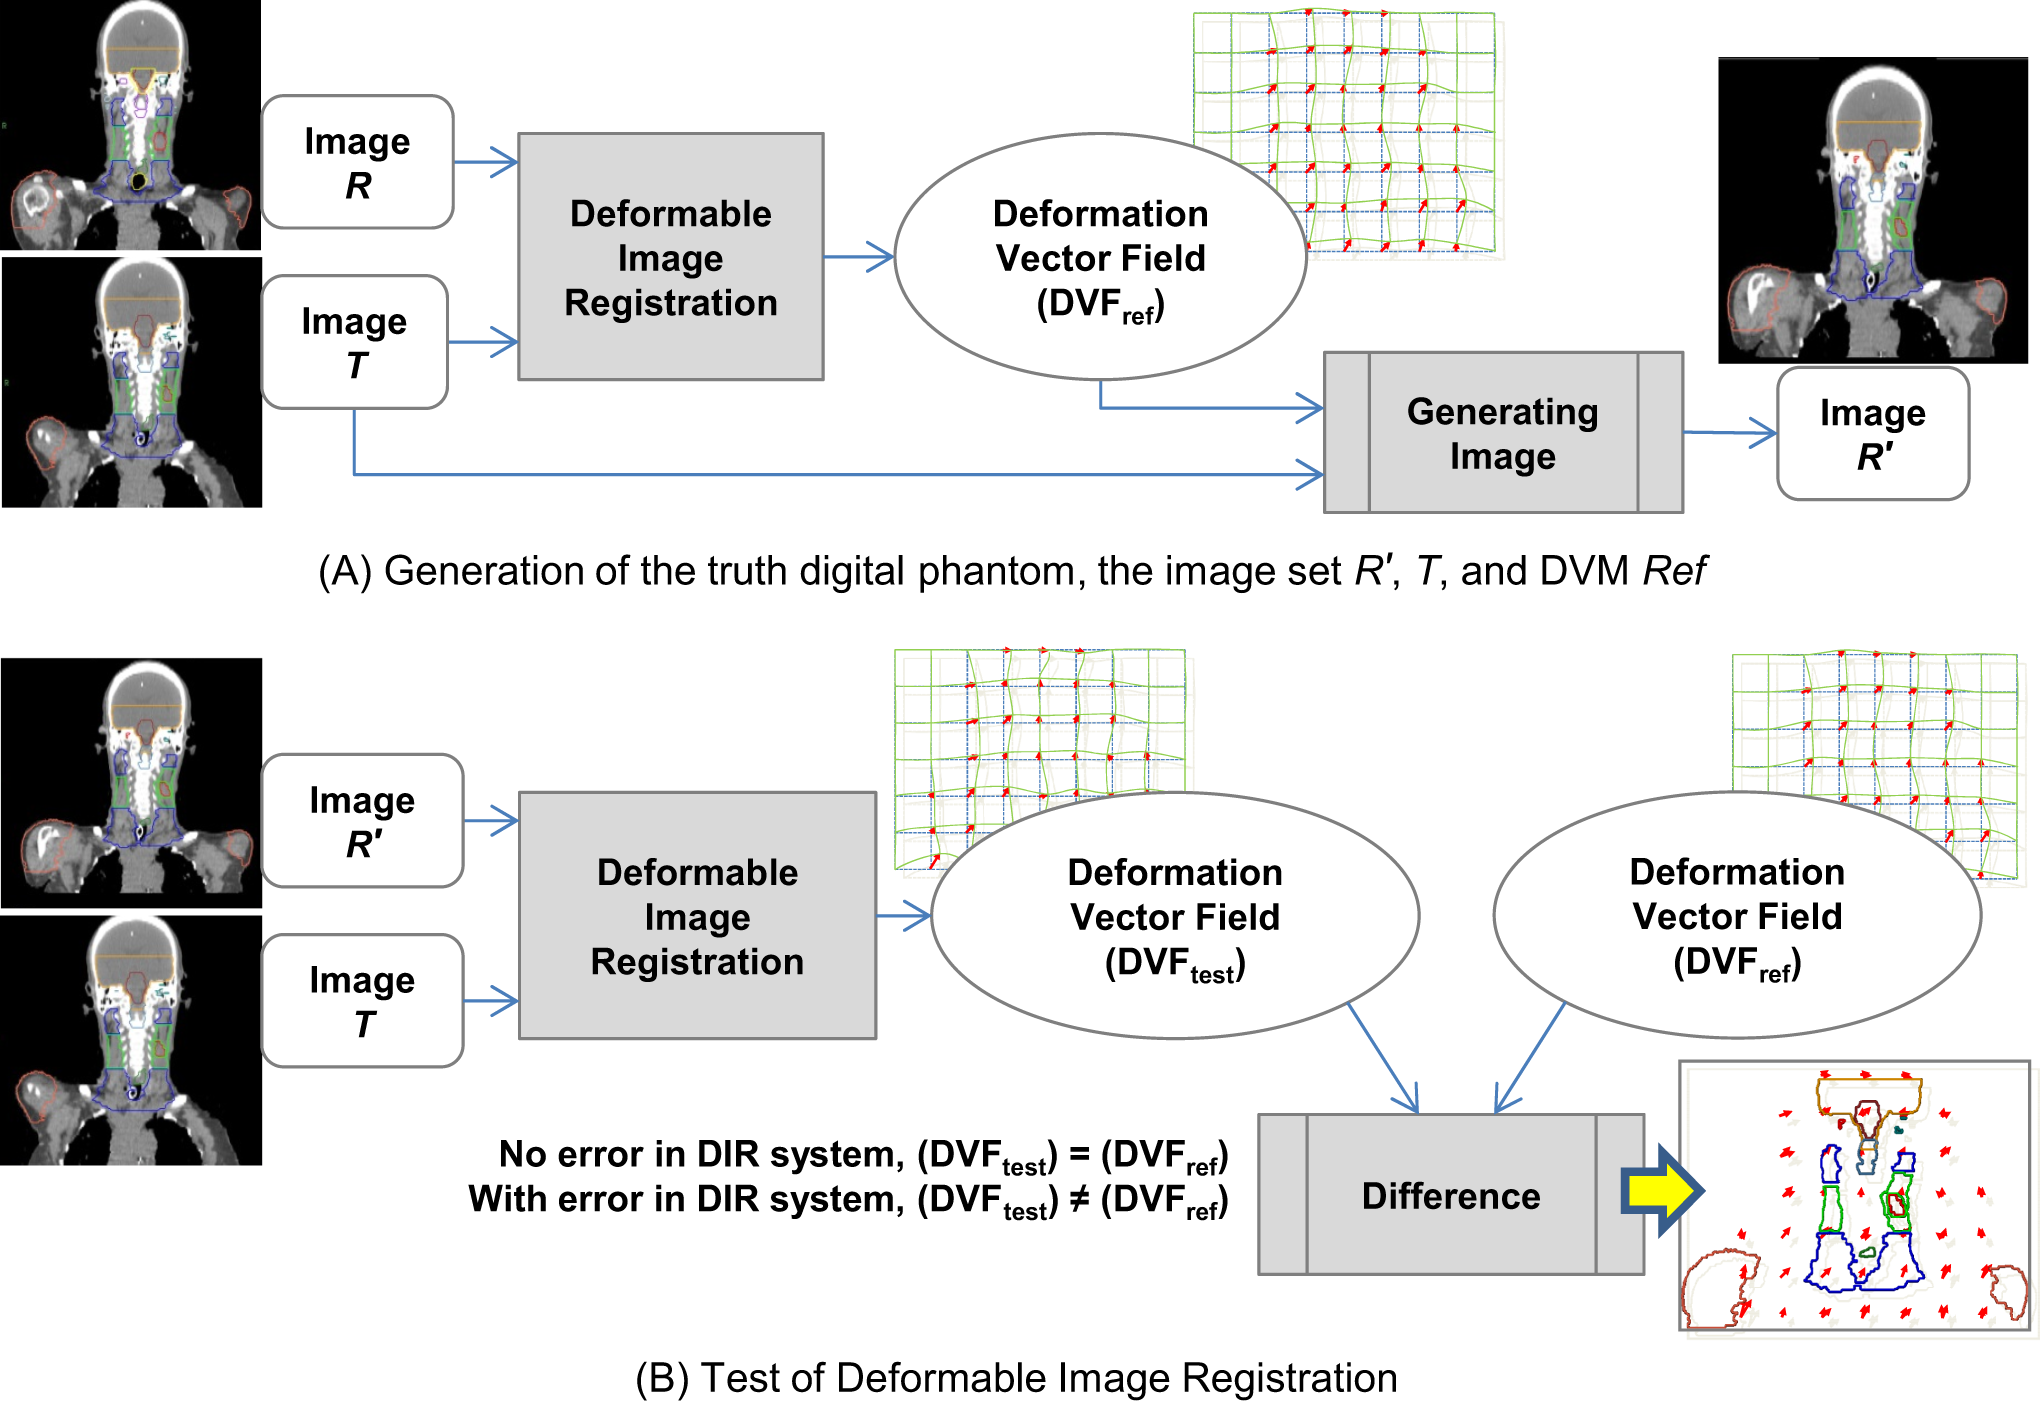
A, Process to generate a truth data with R′, T, and DVFref. B, Process to evaluate deformation errors using the truth data. The deformation vectors field (DVFtest) should be equal to the DVFref when there is no error in the deformable image registration (DIR) system. Intrinsic errors are measured by calculating vector differences between DVFref and DVFtest
When performing DIR between the image sets of R′ and T, the DIR should generate a DVF identical with the truth deformation DVFref if the DIR system has no intrinsic errors as shown in Figure 3B. The deformation errors are composed of random errors and systematic errors. The random errors are from noise in the image sets and sampling processes in the DIR systems. The systematic errors are from limitations of optimizers or the characteristics of the similarity metrics. By comparing DVFref and DVFtest using the local and global error analysis tools, we can characterize the error in DIR system.
Theory for Quantitative Error Analysis Tools
Local error analysis tool: Visualization of errors on each image slice with color mapping
In order to compare DVFref and DVFtest, the vector difference was taken at each voxel with the same coordinate. There is a vector


Global error analysis tool: DEH
For a quantitative analysis of global deformation errors, a DEH was developed from vector differences between the test DVFtest and the reference DVFref. The DEH produces a quantification of the deformation errors per anatomical structure that can be graphically displayed. The DEH graph indicates a cumulative distribution of errors per organ or SOI. The DEH concept utilizes an approach similar to the dose–volume histogram.
52
A frequency analysis was applied to vector differences d
1, d
2, …, dN
measured at voxels with the same coordinate between the DVFref and the DVFtest. When a reference value Dr
is a target histogram bin, the cumulative frequency

where N is the number of vectors, and I is the characteristic function that indicates the value 1 if

Case Study: Head and Neck DIR
The proposed QA approach was applied to our in-house DIR system using a case with head and neck. To provide the image sets R′ and T for the test registration, we exported the image sets in DICOM format. The in-house DIR system utilizes a B-spline image registration algorithm. In Figure 4, the testing process is summarized in a schematic diagram. After 2 image sets (a reference and a test) are imported, the particular DIR software performs the registration process as explained earlier. As a result of the registration, a DVFtest is produced. This DVFtest is compared to the DVFref, which is the truth DVF between the R′ and T image sets. The vector difference between the test DVFtest and the ref DVFref will be utilized to quantify deformation errors in the DIR. In cases where the test DVF has grid resolution different from the DVFref, it should be interpolated to match to the DVFref grid resolution.

Quality assurance (QA) evaluation of a DIR system. The user can select among various anatomical image sets to simulate the clinical situation. After running the deformable image registration using selected image sets, a deformation vector field (DVF) is exported and compared to the truth DVF.
Generating a head and neck QA image data set
This section describes the generation of a head and neck digital QA phantom using the in-house DIR software. 53 A patient with head and neck cancer with 2 radiation therapy planning CT data sets in a single month is used to create the truth set. After the initial CT simulation, the patient had a tracheotomy and required a new CT scan and immobilization mask. In addition to the 2 data sets, manual contours were also delineated by board-certified radiation oncologists. The first treatment planning image set was selected as reference image set R. The second treatment planning image set was selected as test image set T. The reference image set was 133 image slices of 512 × 512 pixels. The pixel resolution was 1.17 × 1.17 mm and the slice thickness was 3 mm. The test image set was 131 image slices of 512 × 512 pixels and the slice thickness and pixel resolution are identical to the reference image set.
In order to generate the initial DVFref (see Figure 4), a DIR was performed using our in-house DIR software. B-spline DIR using MI metric was applied instead of using the mean square error (MSE) metric. The MSE would produce a large error due to the endotracheal tube only being present in the test image set T. L-BFGS was utilized to optimize the number of random sampling points comparing pixels between the 2 image sets. The sinc interpolator was utilized to generate the final R′ image set from the test image set T using the DVFref. The sinc interpolator 54 is slow but provides the least image distortion compared to other methods.
Test of deformable registration systems using the head and neck digital phantom
We applied our test procedure to evaluate DIR system errors from the head and neck image registrations using our in-house DIR software. The configuration of our in-house DIR system is as follows: B-spline transform, linear interpolator, SGD optimizer, and MI similarity metric. A thousand pixels were randomly sampled per iteration for similarity calculation, and the maximum iteration was set to 700. We utilized a multi-resolution approach 55 where the 512 × 512 × 133 and 512 × 512 × 131 image resolutions were initially downsampled to 128 × 128 × 34 and 128 × 128 × 33. The second pass resolutions were raised to 256 × 256 × 67 and 256 × 256 × 66, respectively. The B-spline grid size was set to 21 mm. The number of histogram bins for the MI calculation was 50.
Results
Creation of a Head and Neck Digital Image Phantom
The DIR between an original reference image and a test image was performed randomly utilizing 50% of the pixels from the reference image. The DIR’s execution using L-BFGS optimizer took 3 hours using an AMD Opteron 6136 (2.4 GHz) processor (Advanced Micro Devices, Semiconductor Company, Sunnyvale, CA, United States). Visual checks such as the “checkerboard visualization” were performed to verify the DIR was accurate and acceptable. Once it was approved, a DVFref was generated from the DIR result. After that, we created a new reference image set R′ transformed from the test image T using the DVFref. Figure 5 illustrates that DVFref generates a clinically realistic deformation by comparing R′ to R without erroneous image distortion. Figure 5A visualizes the alignment using the checkerboard test. Figure 5B shows the intensity difference following image subtraction. R′ is similar to R, showing small differences near the high-gradient edges of bone, skin, and anatomical structures.

A, The rigid registration and the intensity difference between R′ and R image sets to show realistic DVFref. The R′ transformed from the image set T does not have erroneous distortion compared to the original R. Sagittal image highlights an endotracheal tube only present in image T. B, In the intensity difference, the gray scale means the difference value. The intensity difference along edge lines of bone, skin, and anatomical structures is higher than others.
The DIR between the image set R′ and the image set T produced DVFtest. This registration was assessed by comparing DVFref and DVFtest. By repeating the steps mentioned earlier, we created 3 truth digital image phantoms, head and neck, liver, and lung. Since the DIR QA of all the test cases follows the same process, we only present the experimental results of the case with head and neck.
Deformable Image Registration System Test Results
Local deformation error analyses
Figure 6 shows the results of DIR using the in-house system as applied to the digital phantom. Figure 6A illustrates visual registration checks showing reasonable matching between the reference image R′ (gray image) and the transformed test image (green image). Figure 6B illustrates the 2˜3 mm deformation errors around the skull surface, jaw, and posterior neck using the in-house DIR software. Vector differences are calculated over a 2-mm grid resolution. The largest deformation error was found at shoulders.

The visualization of the magnitude of deformation errors for the head-and-neck case using the in-house deformable image registration (DIR) system. A, Gray and green images are reference images of the reference image set R′ and a transformed test image, respectively. B, Local error analysis performed by DVF comparison showing significant errors at various locations although the visual check was satisfactory. The magnitude of vector differences between the DVFref and the DVFtest was calculated with a 2-mm grid resolution and displayed as a color map on the image set R′.
Global deformation error analyses
In Figure 7, to analyze the global deformation errors, we generated DEH for the primary CTV, brain stem, shoulders, and normal tissues. It is important to note that this histogram is generated from the registered DVFs and not the image differences. The DEH demonstrates the confidence range of deformation errors per the selected SOI. The DEH for the primary CTV shows that 95% of deformation errors were less than 0.72 mm. Those for the rest of SOIs (shoulders, spinal cord, and brain stem) were less than 3.32, 1.25, and 1.87 mm, respectively.
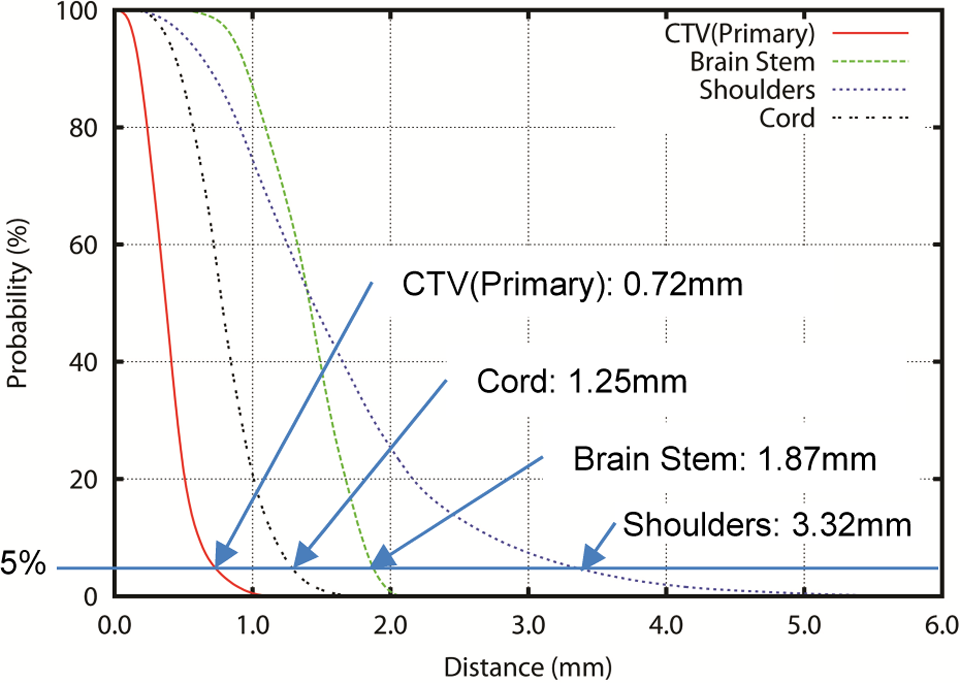
Deformation error histogram (DEH) for the head and neck example. The cumulative histogram of deformation errors visually shows the confidence range of errors.
Deformation errors are also analyzed using conventional statistical methods, taking the average and standard deviation of the errors. We summarized the statistical as well as the DEH analyses for the selected SOIs in Table 1. The average error for the partial brain in Table 1 is 1.23 mm and the standard deviation is 0.46 mm. Therefore, the 2σ range is up to 2.15 mm. However, the measured 95% confidence range from DEH is 1.97 mm. The analysis using the average and the standard deviation may not accurately convey the magnitude of deformation errors as shown in Table 1. In addition, the DEH graph shows the confidence range of the error in DVF for each organ.
After Performing DIR Using the In-House DIR system, the Confidence Ranges of Deformation Errors Were Calculated Using Traditional Statistical and DEH Analyses for the Case With Head and Neck.a

Abbreviations: CTV, clinical target volume; DEH, deformation error histogram; DIR, deformable image registration.
a All ranges are in millimeter (mm) scale.
Discussions
These digital image phantoms and quantitative tools can be used to measure local and global magnitudes of errors during commissioning of a DIR system for clinical applications. An analogy can be found in the use of gamma analysis evaluating performances of clinical dose delivery systems in place of simple dose differences. In the same manner, the use of digital phantoms and DEH for evaluating DIR systems can be used to QA systems for clinical procedures. Furthermore, if a specific DIR system allows a user to select a set of parameters, then our process can be used to identify the most optimized parameter set for a specific anatomical site which would produce minimal errors. Composite doses constructed from DIRs are routinely used in making medical treatment decisions. For accessing the radiation toxicity in particular organs at risk, we need to generate an accurate composite dose that requires DIR. Furthermore, the success and failures of these registrations can be delineated by locality. Park et al. 56 investigated a fuzzy composite dose representation to deal with the uncertainty in DIR. It can generate composite dose plans displaying locality-based uncertainties. By utilizing our proposed test procedure along with the fuzzy composite dose representation, we will be able to collect the data for modeling the deformation vector errors for a specific SOI, which reflects the DIR uncertainty in the composite dose at specific anatomical locations.
To utilize our proposed QA procedure, the user should retrieve the deformation vector data from their image registration systems. Most in-house systems are able to export their deformation vector data since the users have the program source codes. However, many commercial systems utilize their proprietary data formats to store the deformation vectors, although DICOM RT format is recommended for DVF. For example, only the newer version of MIM Maestro (MIMsoftware, Clevaland, Ohio) supports the DICOM format to store the deformation vectors. Otherwise, the commercial system users can retrieve the deformation vector data if the vendor provides adequate technical support. In addition, most DIR systems have adjustable parameters to optimize the DIR algorithm, which may affect quality and performance. The optimization process for finding a set of parameters from a specific anatomical site may be required. In this research, we presented multiple digital image phantoms using only CT image sets. Further works are needed for DIR between different diagnostic modalities such as magnetic resonance and CT or ultrasound and CT. Many clinics are utilizing positron emission tomography (PET)/CT or diagnostic PET or Single-photon emission computed tomography images to delineate gross tumor volume (GTV) and/or CTV. Based on the preliminary results of the QA test proposed in this research, adding a margin for DIR uncertainty may be necessary when a GTV and/or CTV is targeted on deformed data sets.
Conclusions
In this research, we implemented multiple digital image phantoms, based on real patients, and a local and a global error analysis tool for QA of DIR systems. We successfully built a DVF comparison software tool and downloadable digital image phantoms for the DIR QA procedures. The digital image phantom consists of a reference image set, a test image set, and a truth DVF created through the DIR between 2 image sets of real patients (for clinical relevance). The local error analysis tool displays the magnitude of deformation errors on each 2D image slice and the global error analysis tool generates a deformation confidence range per anatomical site in a histogram. The DEH proved to be a useful analysis tool and should be included for future QA commissioning of DIR systems.
Three digital image phantoms (head and neck, lung, and liver) consisting of a reference image set, a test image set, and a deformation vector map field are made available for public access through the Web link at http://rophys.case.edu/dip/. The DEH analysis software is also available. By utilizing the proposed QA procedure, an in-house plan review system was proved to have acceptable error range of deformation vectors.
Footnotes
Abbreviations
Declaration of Conflicting Interests
The author(s) declared no potential conflicts of interest with respect to the research, authorship, and/or publication of this article.
Funding
The author(s) received no financial support for the research, authorship, and/or publication of this article.