
Abstract
Objective
This study aimed to investigate the clinical diagnostic performance of a combined classification model incorporating magnetic resonance imaging (T1WI-CE) habitat and human epididymis protein 4 (HE4) for differentiating borderline ovarian tumors (BOTs) from malignant epithelial ovarian tumors (MEOTs).
Methods
A retrospective analysis was conducted on 127 patients with pathologically confirmed ovarian tumors, including 62 with BOTs and 65 with MEOTs, all of whom underwent preoperative magnetic resonance imaging examination. Twenty habitat features, including the original images, were extracted. T1WI-CE was used to extract 2395 radiomics features from two habitat subregions. Feature selection was performed using correlation analysis and least absolute shrinkage and selection operator regression.
Results
The combined classification model had the highest area under the curve, 0.941 in the training group and 0.880 in the test group, thus outperforming the habitat area and clinical data classification model. The DeLong test demonstrated statistically significant differences between the combined classification model and the clinical classification model, with P values of 0.041 in the training group and 0.023 in the test group. Additionally, a statistically significant difference was observed in the DeLong test results between the cystic habitat subregion (H2) and the overall habitat region.
Conclusions
The combined classification model of habitat analysis and clinical data effectively improved the diagnostic efficacy of differentiating borderline from malignant ovarian tumors. The diagnostic efficacy of the habitat subregion (H1) dominated by solid components and the habitat overall region was superior to that of the habitat subregion dominated by cystic components.
Keywords
1. Introduction
Ovarian tumors are common gynecological tumors occurring in women of all ages. 1 Among these, borderline ovarian tumors (BOTs) are epithelial tumors with shared pathological features of borderline and malignant tumors. They grow slowly and have a low risk of metastasis; most have a good prognosis. 2 Malignant epithelial ovarian tumors (MEOTs), which originate from the germinal epithelium on the surface of the ovary, account for 50%–70% of ovarian tumors and have higher metastasis and mortality rates. 3 BOTs have a malignant tendency but have a much better prognosis than MEOTs. Excessive surgery may compromise fertility or ovarian function in patients, whereas the misdiagnosis of MEOTs as BOTs can result in insufficient treatment for patients, seriously endangering their lives.
Magnetic resonance imaging (MRI) can improve the accuracy of differentiating borderline from malignant ovarian tumors through morphological and semi-quantitative analyses; however, it is significantly insufficient in mining information about intratumoral heterogeneity.4,5 In recent years, radiomics has emerged as a new approach for quantifying tumor heterogeneity and differentiating borderline from malignant tumors by extracting a large amount of feature information from medical images to construct machine learning models. Habitat analysis, an important branch of radiomics, can extract features from tumor subregions with varying biological characteristics and show superior preoperative differentiation and prognostic prediction capabilities in tumor diagnosis and treatment. Li Liu et al. 6 developed a multiparameter MRI-based radiomics approach that could accurately predict the tumor cell proliferation status of serous ovarian carcinoma. Tianming Du et al. 7 conducted their research based on enhanced MRI images of breast tumors and subregions delineated in accordance with the habitat imaging theory.. Michele Bailo et al. 8 evaluated an innovative PET and MRI approach for assessing hypoxia, perfusion, and tissue diffusion in HGGs and derived a combined map for the clustering of intra-tumor heterogeneity. Related studies have confirmed the potential of conventional MRI habitat analysis in the diagnosis, classification, and prognostic assessment of gynecological tumors.9,10 However, necessary practical research experience in the application of a habitat analysis system in contrast-enhanced MRI images, especially in T1WI-CE images, for differentiating BOTs from MEOTs, is lacking.
As an important branch of artificial intelligence, machine learning (ML) can efficiently process high-dimensional feature data generated by radiomics analysis in the field of tumor diagnosis. It employs feature selection, pattern recognition, and hyperparameter optimization to mine complex data correlations that are difficult to capture by traditional statistical methods. Focusing on the clinical problem of differentiating borderline from malignant ovarian tumors, this study aimed to adopt ML algorithms to achieve deep fusion of multi-dimensional data, construct accurate classification models, and explore a borderline–malignant tumor differentiation model based on enhanced magnetic resonance (T1WI-CE) habitat analysis. It provided a new and more effective multi-dimensional joint analysis strategy for preoperative noninvasive and precise differentiation of borderline and malignant ovarian tumors.
2. Materials and Methods
This retrospective study was conducted from January 2019 to December 2022. All included cases were retrieved from the hospital’s electronic medical record and pathological database, with complete preoperative MRI data, serum HE4 test results, and postoperative pathological reports. Case screening strictly followed the predefined inclusion and exclusion criteria, and data integrity was verified by two independent researchers. MRI image quality was assessed by senior radiologists, with cases of motion/metal artifacts excluded to ensure the reliability of habitat feature extraction. This study was conducted in accordance with the Declaration of Helsinki and was approved by the hospital ethics committee to exempt patients from informed consent. The approval document number was 2025FXHEC-KSP049.
2.1. General Information
This study retrospectively analyzed the data of 127 patients at Fuxing Hospital, Capital Medical University, including those with BOTs and MEOTs confirmed by surgical pathology from January 2019 to December 2022. Among these, 62 patients with BOTs were aged 29–69 years with an average age of 48.54 ± 12.55 years and 65 patients with MEOTs were aged 28–70 years with an average age of 48.75 ± 12.37 years. These 127 patients were randomly assigned to training and test sets in a 7:3 ratio. Of these, 88 patients were included in the training group and 39 patients in the test group.
2.2. Inclusion and Exclusion Criteria
The inclusion criteria were as follows: (1) patients who underwent MRI examination within 14 days before surgery; (2) patients who had not received radiotherapy or chemotherapy before the surgery; (3) patients with no history of ovarian surgery before the surgery; and (4) patients with BOTs or MEOTs confirmed by postoperative pathological examination.
The exclusion criteria were as follows: (1) patients with poor-quality MRI images; (2) patients with incomplete clinical examination or surgical data; (3) patients with a history of malignant tumors; and (4) patients with other ovarian disorders.
2.3. Data Collection
2.3.1. Imaging Data
The imaging data were collected using a GE Discovery 750W 3.0T superconducting magnetic resonance device (General Electric, USA), an eight-channel body phased-array coil, and a GE AW4.7 workstation (General Electric). The parameters for Axial LAVA-Flex-T1WI dynamic contrast-enhanced scan (CET1) were as follows: TR, 5.1 ms; TE, 1.8 ms; flip angle, 15°; NEX, 1; bandwidth, 142.86 MHz; Freq.Dir, R/L;layer thickness, 4.0 mm; interlayer spacing, 0 mm; and field of view, 360 × 380 mm2. The patient was intravenously infused with gadodiamide (Omniscan, GE Healthcare) at a rate of 2.4 mL/s and a dose of 0. 1 mmol/kg. Delayed images were obtained 6–7 min after injection.
2.3.2. Clinical Data
For this, 3 mL of fasting venous blood (anticoagulated with heparin) was collected from the patient on the day of admission. The serum was separated after centrifugation at 3200 rpm for 10 min, and the serum HE4 level was detected using an enzyme-linked immunosorbent assay.
2.4. Workflow of Habitat Analysis
2.4.1. Image Processing and Annotation
All MRI images included in the study were in DICOM format. First, N4-field correction was performed on the T1WI-CE sequence images, followed by resampling using linear interpolation technology to standardize the voxel spacing to 1 ×1 × 1 mm3. Subsequently, two senior attending physicians manually delineated the entire ovarian tumor layer by layer as the region of interest (ROI) using ITK-SNAP (version 3.8.0) software under the blinded condition, without knowing the pathological results, to obtain the three-dimensional volume of interest (VOI) of the tumor. For patients with bilateral lesions, the larger side was selected as the research subject. After all images were delineated, the ROI was reconfirmed and modified; in case of discrepancies, consensus was reached through negotiation and a 3D tumor image composed of voxels was finally generated. Fifty cases were randomly selected from all processed cases for consistency testing, and features with an intraclass correlation coefficient (ICC) ≥0.75 were considered stable and reproducible. The original images and the labeled images of the enhanced magnetic resonance scan were imported into the analysis system: the original images were T1WI-CE sequence images (Figure 1A), and the labeled images were ROI region images obtained by senior radiologists after delineating borderline and malignant tumors (Figure 1B). Processing and annotation of T1WI-CE sequence images of ovaries
2.4.2. Habitat Division and Feature Extraction
Habitat division and feature extraction were performed on the input original images and labeled images to accurately identify heterogeneous habitat subregions within tumors and extract the radiomics features of the subregions (Figure 2). The specific steps were as follows: (i) Determining clustering input and algorithm: The voxel intensity values of the T1WI-CE sequence within the tumor VOI were used as the core input data (Figure 2A), and the k-means clustering algorithm was used for unsupervised clustering analysis of the tumor region. The preset range for the number of clusters was 2–20, generating potential habitat subregion segmentation schemes corresponding to each clustering number. (ii) Clustering quality evaluation and optimal segmentation determination: The Calinski–Harabasz (CH) clustering validity index was adopted, and the quality of each clustering scheme was quantified using the CH value. The scheme with the highest CH value was selected as the final habitat subregion segmentation result, which was ultimately divided into 20 subregions with distinct features and visually marked with different colors (Figure 2B). (iii) Extraction of radiomics features: For the 20 finally determined habitat subregions, 2395 radiomics features were extracted, mainly including three categories: first-order statistical features (mean, standard deviation, skewness, kurtosis, etc.), which reflect the distribution characteristics of voxel intensity; shape features (volume, surface area, sphericity, irregularity, etc.), which describe the three-dimensional morphological characteristics of tumors; and texture features (gray-level co-occurrence matrix, gray-level run-length matrix, gray-level size zone matrix, gray-level dependence matrix, etc.), which characterize the spatial distribution pattern of voxel intensity. (iv) Definition of habitat subregions: Based on their radiomics features, the subregions were divided into two core types of subregions: H1 representing the area dominated by solid components, marked in green in the figure; and H2 representing the area dominated by cystic components, marked in red in the figure (Figure 2C). (v) Feature visualization and correlation analysis: Principal component analysis was used for dimensionality reduction of the extracted high-dimensional features. The features were projected into a low-dimensional space through a cluster coordinate map for visual display to observe the distribution rules and potential biological correlations of different habitat subregions (Figure 2D). Habitat region division and feature extraction of ovarian tumors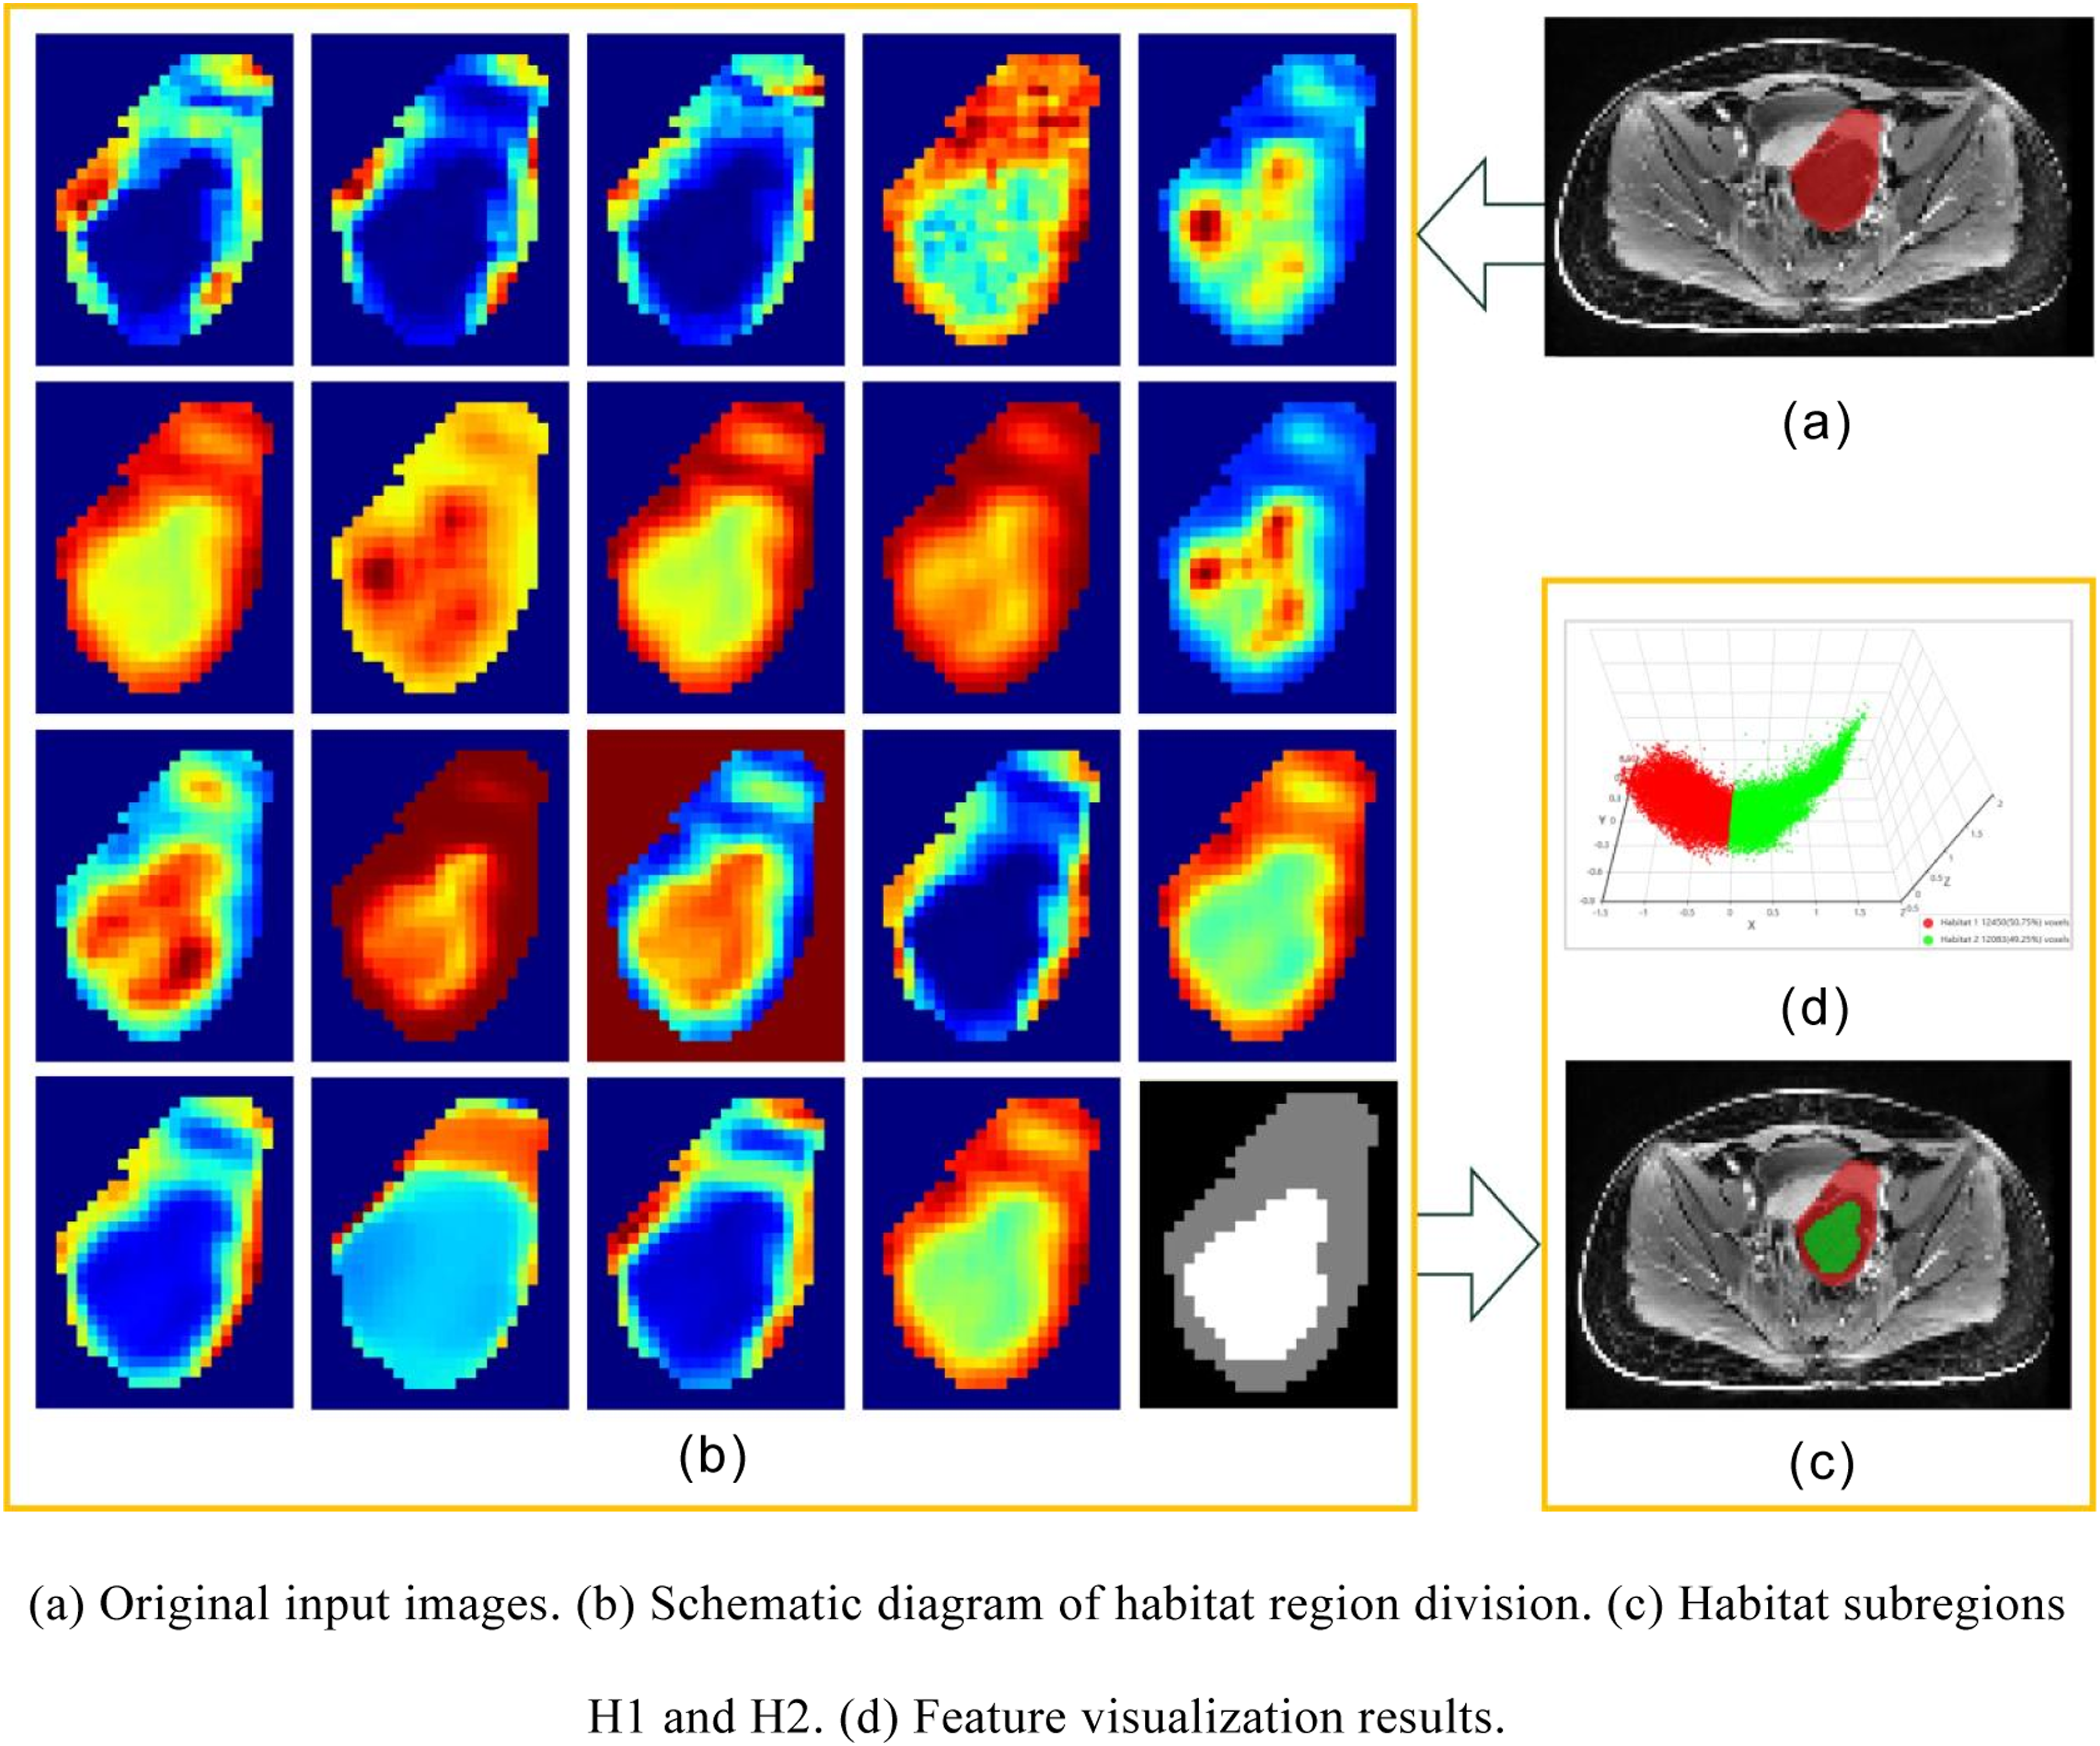
2.4.3. Feature Screening and Evaluation
A regression model was constructed using least absolute shrinkage and selection operator (LASSO) regression, with the abscissa representing the regularization parameter λ and the ordinate representing the feature coefficients. Features most relevant to the prediction target were retained, and 14 key features along with their weight distribution were obtained after LASSO screening (Figure 3B). The weight values reflected the contribution of each feature to model prediction. Ovarian tumor feature screening
2.5. Construction of a Classifier Model
Combining the radiomics features of the habitat area and clinical HE4 data, eight mainstream ML algorithms were selected to construct classifiers: logistic regression (LR), naive Bayes (NB), support vector machine (SVM), random forest, extra trees, XGBoost, LightGBM, and multilayer perceptron. The model performance and generalization ability were improved by performing hyperparameter optimization for each classifier based on the training set: Grid search combined with fivefold cross-validation was adopted to traverse the preset hyperparameter space, screen out the optimal hyperparameter combination for the classification performance of each algorithm on the training set, and then construct the final classifier based on the optimal hyperparameters.
2.6. Diagnostic Performance Analysis
The calibration curve was used to assess the accuracy of the model’s predicted probabilities, whereas the area under the receiver operating characteristic (ROC) curve (AUC) was used to assess the model’s performance in differentiating between borderline and malignant tumors. The decision curve analysis (DCA) was used to assess the net benefit of the model for clinical decisions at various decision thresholds, the nomogram was used to assess the contribution of different data to the diagnosis results, and the comprehensive score was used to provide a decision-making basis for clinical diagnosis.
3. Results
3.1. Clinical Features
Clinical Characteristics of 127 Patients With Ovarian Tumors

3.2. Diagnostic Efficacy of the Overall Habitat Area
Radiomics analysis of the overall habitat region of ovarian tumors revealed the diagnostic efficacy of the classifier model, as shown in Figure 4. Figure 4A shows the ROC curves and AUC values of eight ML algorithms (LR, NB, SVM, etc.) in the training set. Figure 4B shows the ROC curves and AUC values of the eight ML algorithms in the test set, demonstrating the differentiation ability of various models for borderline and malignant ovarian tumors. The ROC curve analysis of the training-group data showed that the AUC value of the NB model was 0.888, whereas the AUC values of the other seven classifier models were all higher than 0.90, indicating high diagnostic accuracy. The ROC curve analysis of the test-group data showed that the AUC value of the NB model was 0.670, whereas the AUC values of the other seven classifier models were all higher than 0.71. The diagnostic accuracy of LR was better than that of the other models, with an AUC value of 0.874. Therefore, the LR classifier algorithm was used in the study of the habitat subregion and the joint classification model. Diagnostic efficacy of the radiomics classification model of the overall habitat region of ovarian tumors
3.3. Diagnostic Efficacy of Subhabitat Regions
When comparing the diagnostic efficacy of the overall habitat region, differences were observed in diagnostic efficacy among different ovarian tumor habitat subregions. Figure 5A shows the ROC curves and AUC values of the overall habitat region, the habitat subregion dominated by solid components (H1), and the habitat subregion dominated by cystic components (H2) in the training set. Figure 5B shows the ROC curves and AUC values of the aforementioned three regions in the test set, which were used to compare the diagnostic performance differences among different habitat regions. The AUC value of the overall habitat area in the training group was 0.916, whereas the AUC values of the H1 (solid) and H2 (cystic) subareas were 0.885 and 0.825, respectively. The AUC value of the overall habitat area in the test group was 0.874, and the AUC values of the H1 and H2 subareas were 0.848 and 0.693, respectively. Diagnostic efficacy of the radiomics classification model of the ovarian tumor habitat subregion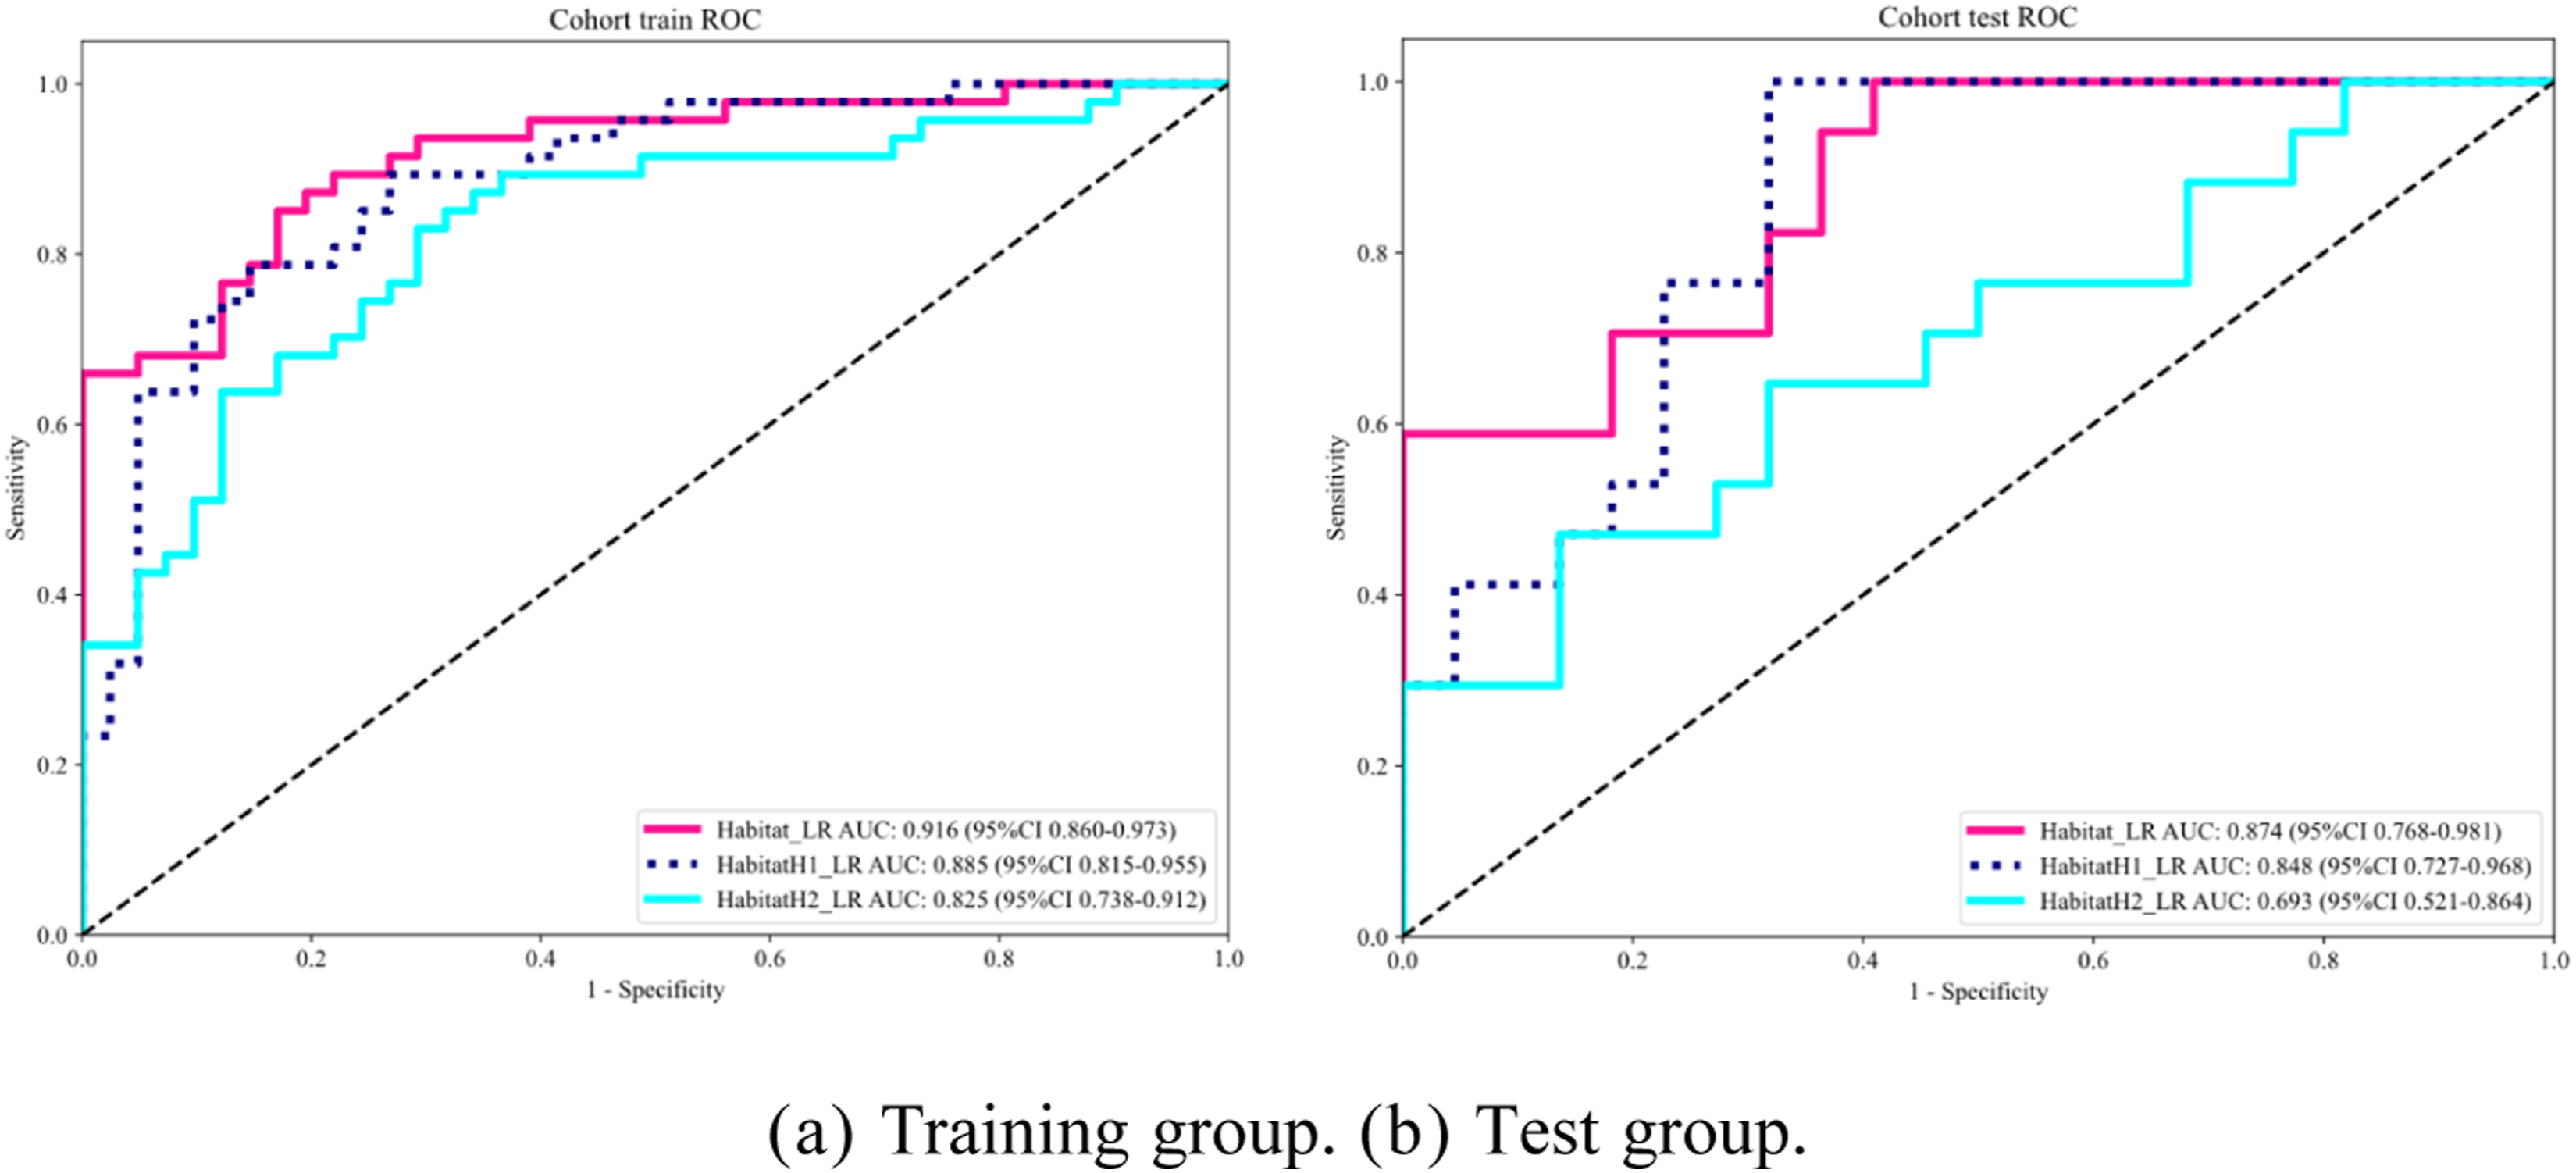
3.4. Diagnostic Efficacy of the Combined Classification Model
As shown in Figure 6A and B, the ROC curve analysis indicated that the AUC values of the combined classification model in the training and test groups were 0.941 and 0.880, respectively, which were higher than those of the habitat area classification model (0.916 and 0.874) and the clinical data classification model (0.858 and 0.711). DCA curve analysis showed that the values for the combined classification model of the training and test groups were higher than those of the habitat area model and the clinical data classification model (Figure 6C and D). HL test results showed that the clinical data classification model, habitat area classification model, and combined classification model of the training and test groups were more versatile (P > 0.05) (Figure 6E and F). The line chart model showed that HE4 (0–800 pmol/L) and habitat (0–1) corresponded to different scores, and the risk index of borderline and malignant tumors (0.05–0.95) was obtained after calculating the total score (Figure 6G). In addition, the differences in DeLong test results between the combined classification model and the clinical classification model were statistically significant, with P values of 0.041 in the training group and 0.023 in the test group. A statistically significant difference was also observed in the DeLong test results between the cystic subregion of the habitat (H2) and the overall habitat region, with P values of 0.009 and 0.011 in the training and test groups, respectively (Figure 6H and I). Diagnostic efficacy of the combined classification model of ovarian tumors
4. Discussion
Habitat analysis technique is an effective method for predicting treatment response and disease progression by quantifying heterogeneity within tumors, especially when applied to enhanced MRI (T1WI-CE) images. It can effectively identify and quantify heterogeneous regions such as vascular distribution, cell density, necrosis, and cystic changes within tumors, forming different enhanced habitat subregions.8,11 The elevated levels of serum HE4, a widely recognized biomarker related to ovarian cancer, are closely associated with malignant disease status and can provide important molecular biological supplementary information for habitat analysis models.12,13 Therefore, this study aimed to address the limitations of traditional MRI morphology and semi-quantitative analysis in mining information on microscopic heterogeneity within tumors. A combined classification model was constructed based on enhanced MRI (T1WI-CE) image habitat analysis and serum HE4 levels to significantly improve the differential diagnostic efficacy of BOTs and MEOTs. The combined classification model demonstrated high diagnostic efficacy in both the training and test groups, and therefore was significantly superior to the single-habitat area model and the HE4 diagnostic method. It provided a preoperative, noninvasive, and more accurate differential tool for clinical practice, effectively controlling the proportion of over-treatment in patients with BOTs and undertreatment in patients with MEOTs. The combined model still exhibited certain diagnostic errors. Hence, an in-depth error analysis was conducted for further optimization. A total of 11 misdiagnosed cases were found in the training and test sets. Among these, BOTs with high HE4 levels and obvious solid components were more likely to be misdiagnosed as MEOTs, whereas early low-aggressive MEOTs (small volume, normal HE4) were easily misdiagnosed as BOTs. This was mainly due to two aspects: On the one hand, the overlap of clinical (HE4) and radiological (solid/cystic ratio) features between partial BOTs and MEOTs was an inherent clinical difficulty, and the current feature set lacked subtype-specific markers. On the other hand, the small sample size limited the model’s learning of rare subtype features, and mild image artifacts further impacted the stability of habitat feature extraction.
Recent years have witnessed an increasing use of radiomics and habitat analysis in tumor diagnosis and assessment. Compared with previous studies on the clinical diagnosis of ovarian tumors both domestically and internationally, the diagnostic efficacy of the combined classification model in this study remained at a relatively good level. Fuxia Xiao et al. 14 investigated the value of quantitative MRI indicators in the differential diagnoses of benign, borderline, and malignant EOTs. The multivariate LR analysis showed that the volume of the solid portion, the maximum diameter of the solid portion, the enhancement degrees, and peritoneal carcinomatosis were important indicators for distinguishing among the three groups. The AUCs of the aforementioned indicators and the combination of the four image features, except peritoneal carcinomatosis, ranged from 0.74 to 0.85 for differentiating BeEOTs from BOTs, and from 0.58 to 0.79 for differentiating BOTs from MEOTs. X Han et al. 15 investigated the value of contrast-enhanced dual-energy spectral computed tomography (CT) in differentiating BOTs from MEOTs. Combining parameters in two contrast-enhanced phases provided 80.8% sensitivity and 82.4% specificity in differentiating MEOTs from BOTs with an AUC of 0.844. Rongping Ye et al. 16 explored the value of MRI-based whole-tumor texture analysis in differentiating BOTs from FIGO stage I/II MEOTs. In the test group, the AUCs were 0.840 when the nontexture model was used and 0.896 when the combined model was used. The results of the related studies were slightly lower than or close to the results of this study, further confirming the application value of the combined classification model in differentiating borderline from malignant ovarian tumors.
The rational application of ML algorithms provided key support for the innovation and efficacy improvement in tumor diagnosis in this study. A total of 2395 high-dimensional radiomics features were extracted from 20 habitat subregions. Using LASSO regression–based feature selection, hyperparameter optimization via grid search combined with fivefold cross-validation, and comparative modeling of eight mainstream algorithms, ML not only accurately retained 14 key features most relevant to the differentiation of borderline from malignant ovarian tumors but also achieved deep integration of habitat imaging features and serum HE4 biomarkers. It provided a more accurate decision-making basis for the differentiation of borderline from malignant ovarian tumors, and also offered a feasible technical paradigm for precision diagnosis research involving multi-dimensional data integration in this field.
Compared with previous studies, the innovations of this study were as follows: (1) It systematically applied habitat analysis technology to T1WI-CE images of ovarian tumors, thus providing a new technical approach for the in-depth exploration of microscopic heterogeneity information of ovarian tumors and achieving methodological application innovation. (2) It integrated T1WI-CE habitat imaging omics features with key serum tumor marker HE4 data to construct a multi-dimensional joint classification model to achieve model construction innovation. (3) It analyzed the diagnostic efficacy of different habitat subareas, revealing that the habitat subarea with solid component (H1) had more diagnostic value than the habitat subarea with cystic component (H2), that is, the value comparison of subareas was achieved. The combined model brings practical changes to clinical management: Preoperatively, it enables noninvasive and accurate differentiation of BOTs and MEOTs, guiding personalized treatment—young patients with suspected BOTs can undergo fertility-sparing minimally invasive surgery, while MEOTs cases allow early staging and adjuvant therapy planning. It also reduces overtreatment/undertreatment risks caused by misdiagnosis, and dynamic monitoring of habitat features and HE4 postoperatively aids in early recurrence detection. This model is extendable to other heterogeneous malignancies: In hepatocellular carcinoma, it can combine habitat features with AFP to optimize TACE efficacy prediction; in breast cancer, solid/cystic habitat subregions and CA15-3 assist in differentiating invasive and in situ carcinoma; in pancreatic cancer, it may improve early diagnosis accuracy when combined with CA19-9. The core logic of integrating intratumoral heterogeneity and serum biomarkers provides a scalable framework for precision oncology.17-20
This study had several limitations. First, given the limited volume of patient data, the robustness of the diagnostic model needed further improvement. Additionally, the single data source failed to consider the impact of magnetic resonance equipment and scanning parameters on diagnostic efficacy. Second, the relatively small sample size led to wide confidence intervals for clinical indicators, hindering the detection of subtle differences between BOTs and MEOTs. This sample size limitation did not compromise the validity of the current diagnostic model, as the model’s efficacy relied on the integration of radiomics features and HE4 rather than the differences in clinical features. Furthermore, the post-hoc power analysis revealed that increasing the sample size could enhance the statistical power for detecting small-effect-size differences, which was crucial for further exploring the clinical significance of baseline indicator variability between the two groups.
5. Conclusions
In this study, the Calinski–Harabasz clustering algorithm was used to segment the subregions of the tumor habitat. Also, radiomics features were extracted, key variables were screened by LASSO regression, and HE4 data were integrated to construct a line graph model to achieve a deep fusion of microscopic heterogeneity information within tumors and molecular biological markers. The combined classification model was used for the differential diagnosis of BOTs and MEOTs, significantly improving the diagnostic efficacy of BOTs and MEOTs. This approach provides a reliable tool for clinical decision-making, and strongly supports the development of individualized precision diagnosis and treatment of ovarian tumors.
Footnotes
Acknowledgements
I would like to acknowledge the contributions of those who supported me in my research, and appreciate the help from my research team members, for their invaluable guidance and patience throughout my study.
Ethical Considerations
This study was conducted in accordance with the Declaration of Helsinki and was approved by the hospital ethics committee to exempt patients from informed consent. The approval document number was 2025FXHEC-KSP049.
Author Contributions
(I) Conception and design: J Wang, D Yang; (II) Administrative support: Y Sui; (III) Provision of study materials or patients: K Liu; (IV) Collection and assembly of data: Y Ma; (V) Data analysis and interpretation: D Yang; (VI) Manuscript writing: J Wang; (VII) Final approval of manuscript: All authors.
Funding
The authors received no financial support for the research, authorship, and/or publication of this article. The authors state that this work has not received any funding.
Declaration of Conflicting Interests
The authors declared no potential conflicts of interest with respect to the research, authorship, and/or publication of this article. The authors of this manuscript declare no relationships with any companies, whose products or services may be related to the subject matter of the article.