
Abstract
Introduction
To explore the value of enhanced computed tomography (CT) -derived extracellular volume (ECV) combined with systemic immune-inflammation index (SII) in predicting tumor budding (TB) grading of rectal cancer.
Materials and Methods
The clinical and imaging data of 177 rectal cancer patients were retrospectively analyzed, and we divided them into a low-grade and medium-high group according to pathological TB count. ECV and SII values between the two groups were compared. Intra-class correlation coefficient (ICC) was used to detect the consistency of measurements among observers. Binary logistic regression was used to analyze the correlations between variables and TB grading of rectal cancer. Receiver operating characteristic (ROC) curve analysis was performed to evaluate the diagnostic efficiency of statistically significant parameters and their combination. Area under the curve (AUC), its 95% confidence interval, and the corresponding Youden index, sensitivity, and specificity were calculated.
Results
Among the 177 rectal cancer patients, 108 were low-grade and 69 were medium-high grade. ECV values measured by two physicians showed good consistency (ICC = 0.98). ECV value of low-grade (21.76% ± 4.89%) was lower than that of medium-high grade TB group (27.91% ± 4.77%) (P < .001). SII value was lower in low-grade group (492.14 ± 239.56) than in medium-high grade TB group (825.02 ± 529.38). In the multivariate analysis, ECV value [odds ratio (OR): 1.339 (95% CI: 1.194-1.502)] and SII value [OR: 1.004 (95% CI: 1.002-1.005)] were independent risk factors for predicting TB grading. In the training set, AUCs of ECV, SII, and their combination in evaluating TB grading of rectal cancer were 0.838 (95% CI: 0.760-0.905), 0.755 (95% CI: 0.663-0.829), and 0.889 (95% CI: 0.832-0.943), respectively. In the test set, the corresponding AUCs were 0.741 (95% CI: 0.626-0.870), 0.716 (95% CI: 0.554-0.849), and 0.815 (95% CI: 0.711-0.913). Decision curve analysis (DCA) showed that the combination had higher clinical value than using ECV or SII alone.
Conclusion
The combination of ECV and SII can non-invasively evaluate TB grading of rectal cancer before surgery, potentially providing a reference for preoperative risk stratification as a decision-support tool.
Keywords
Introduction
Rectal cancer is the third most lethal gastrointestinal malignancy worldwide, and its prognosis is closely related to the invasive biological behavior of the tumor. 1 In recent years, tumor budding (TB), a new pathological marker, has been defined as single cancer cell or small clusters composed of ≤ 5 cells at the tumor invasion front. It has been proven to be an independent predictor of local recurrence, distant metastasis, and poor prognosis in colorectal cancer.2–5 The Union for International Cancer Control (UICC) guidelines have incorporated TB into the pathological staging system. 6 However, the assessment of TB grading highly depends on postoperative pathological specimens and cannot be preoperatively predicted by non-invasive means. In addition, traditional biopsies are prone to overlooking tumor heterogeneity due to sampling limitations and it is difficult to dynamically track the evolution of the microenvironment. Therefore, developing non-invasive prediction models based on imaging or serum biomarkers is of great value for optimizing preoperative risk stratification of rectal cancer.
In recent years, research has shown that the immune-inflammatory state and stromal remodeling of the tumor microenvironment (TME) are the core mechanisms driving tumor progression. Systemic Immune-Inflammation Index (SII), by integrating platelet, neutrophil, and lymphocyte counts, can quantify the imbalance between pro-inflammatory and anti-tumor immunity in the body.7,8 Multiple studies have confirmed that an elevated SII is significantly associated with immune escape, chemotherapy resistance, and poor prognosis of colorectal cancer.7,9–13 On the other hand, extracellular volume fraction (ECV) derived from enhanced CT, by quantitatively evaluating tissue fibrosis and micro-vessel density, can reflect the physical properties of the tumor stromal microenvironment. 14 Previous studies have suggested that an elevated ECV is closely associated with invasive phenotype and poor prognosis of tumors.15–17 However, no study has explored the synergistic effect of ECV and SII in the tumor budding state of rectal cancer and its underlying mechanism. Speculated from the biological mechanism, an elevated ECV may accelerate tumor budding by promoting epithelial-mesenchymal transition (EMT) and a hypoxic microenvironment; while the pro-inflammatory - anti-inflammatory imbalance caused by an elevated SII may weaken immune surveillance, jointly driving the invasive phenotype of tumor cells. If there is a synergistic effect between the two, the combined model may break through the limitations of a single indicator and significantly improve the predictive efficacy.
This study aims to explore the complementary value of ECV and SII in TB grading through multimodal data fusion, provide a potential non-invasive tool for preoperative assessment of rectal cancer as well as a hypothesis-generating basis for treatment strategies targeting interstitial fibrosis or regulating the immune microenvironment.
Materials and Methods
Study Population
This single-center study was approved by the Ethics Committee of the Affiliated Huaian No.1 People's Hospital of Nanjing Medical University (Number: KY-2022-045-01). As a retrospective study, the patients were exempted from written informed consent. 203 cases of rectal cancer patients who underwent radical surgery between January 2023 and December 2024 were included. The reporting of this study conforms to TRIPOD guidelines. 18 Inclusion criteria: (1) Pathologically diagnosed as rectal adenocarcinoma; (2) Completed enhanced CT scan and serological tests within 1 week before surgery; (3) Underwent radical rectal resection (Dixon or Miles procedure); (4) Complete pathological assessment of TB grading. Exclusion criteria: (1) Complicated with other primary malignancies(n = 5); (2) Received neoadjuvant chemoradiotherapy or immunotherapy before surgery (n = 13); (3) Missing imaging or pathological data(n = 8). 177 patients were finally included in this study (Figure 1). The following clinical and biochemical parameters were collected: age, gender, hematocrit (HCT) level, and carcinoembryonic antigen (CEA). Two radiologists conducted a retrospective review of the CT scans to assess the tumor's location, size, T stage and N stage, according to the eighth edition of the Union for International Cancer Control (UICC) TNM staging system.

Patient inclusion flowchart. Bd1 = low-grade tumor budding of rectal cancer, Bd2 = medium-grade tumor budding of rectal cancer, Bd3 = high-grade tumor budding of rectal cancer.
CT Scanning Protocol
Multi - phase enhanced CT examinations were performed using a German Siemens dual - source CT scanner (SOMATOM Definition Flash). The specific scanner settings are as follows: collimation is 64 × 0.6 mm, rotation time is 0.28 s, pitch is 0.55, and reconstruction thickness is 1.5 mm. During enhanced scanning, an iodinated non - ionic contrast agent (Ioversol, 320 mg/mL iodine, HENGRUI Medicine) was selected. The administration was carried out via an elbow vein with the use of a dual-head syringe. The dose was 1.5 mL/kg, and the flow rate was 2.5 mL/s. After injection, 30 mL of normal saline was injected at the same flow rate. For arterial - phase scanning after injection, it was initiated with the bolus - tracking technique. When the threshold in the descending aorta reached 100 Hu, an additional 10 - second delay was applied before starting the scan. Venous - phase scanning was carried out 25 s after the end of arterial - phase scanning. The equilibrium phase started 90 s after the portal - phase scanning. Images were reconstructed into axial slices of 3-mm thickness utilizing the standard soft-tissue kernel. The scanning coverage extended from the upper part of the diaphragm down to the lower margin of the pelvis.
Image Analysis
All images were analyzed and data were measured using the workstation (syngo.via VB20A, Dual Energy, Siemens Healthineers). The CT values of the tumor and external iliac artery were independently obtained by two radiologists who were unaware of all clinical and pathological information. The thickness of the tumor was measured on the axial CT images. ROIs were manually drawn on the maximum cross-section of the tumor using plain and equilibrium phase images, avoiding the intestinal lumen, necrosis, hemorrhage, cystic and calcified areas. A circular or oval ROI was placed on the external iliac artery at the tumor level. Referring to the arterial and venous phase images, the ROI on the equilibrium phase image was copied to the plain CT image, and efforts were made to ensure that the tumor ROI was on the same layer in both the plain and equilibrium phases. The average value measured by the two observers represented each ROI. ECV value of the tumor was calculated using the following formula: ECV (%) = (1 - HCT) × (ΔHutumor / ΔHublood pool) × 100, where ΔHUtumor and ΔHUblood pool were the CT values of the tumor and external iliac artery in the equilibrium phase minus the CT values of the plain CT, respectively.
Serum SII Detection and Calculation
The detection of serum SII was based on the results of peripheral blood routine examination and was calculated through the absolute counts of neutrophils (NEUT), platelets (PLT), and lymphocytes (LYMPH). The subjects had 2 mL of elbow venous blood collected on an empty stomach in the morning and placed in an EDTA anticoagulant tube. After gentle mixing, the sample was sent for examination within 2 h. A fully automated hematology analyzer (such as Sysmex XN - 1000) was used to complete the blood cell count, and the absolute values of NEUT (×109/L), PLT (×109/L), and LYMPH (×109/L) were recorded. The SII value was calculated according to the formula: SII = NEUT × PLT / LYMPH. In the formula, NEUT, PLT, and LYMPH were all the measured values of the same specimen.
Pathological Assessment
The International Tumor Budding Consensus Conference (ITBCC) defines TB as clusters of tumor cells dispersed at the leading edge of the tumor. 19 A microscope featuring a 20 mm eyepiece field diameter and an observation area of 0.785 mm2was utilized. Patient tumor tissue samples were obtained. First, the hotspot area with the highest prevalence of TB was determined at low magnification. Afterward, the highest number of budding occurrences in the TB hotspot region was tallied at 200×magnification, with a minimum of two pathological sections examined per case. Based on ITBCC grading standards, it was categorized as follows: 0-4 buds (low budding, Bd 1), 5-9 buds (moderate budding, Bd 2), and ≥10 buds (high budding, Bd 3). In our research, we divided the grade of TB into low-grade (Bd 1) and medium-high grade (Bd2 + Bd 3) according to the above criteria. Throughout the study, two experienced pathologists collaboratively assessed the TB grading using a multi-head microscope. To quantify interobserver agreement, Cohen's Kappa coefficient was calculated for the two pathologists ‘grading results. The analysis showed excellent consistency, with a Cohen's Kappa of 0.904, indicating that the TB grading system used in this study was reliable and reproducible.
Statistical Analysis
IBM SPSS Statistics 26.0, MedCalc 20.0, and GraphPad Prism 10.1.2 software was used for statistical analysis. Normality tests were performed on measurement data. Data conforming to a normal distribution were expressed as (x ± s), and independent-sample t-tests were used for inter-group comparisons. Data not conforming to a normal distribution were expressed as M (Q1, Q3), and Mann-Whitney U-tests were used for inter-group comparisons. The 177 patients were randomly divided into a training set and a test set at a ratio of 7:3. The baseline characteristics of the two sets were balanced (all P > .05), ensuring the comparability of the two cohorts. Chi-square tests were used for inter-group comparisons of count data. Binary logistic regression was used to analyze the correlation between variables and TB grading of rectal cancer. Variable selection was performed via backward stepwise regression (elimination criterion: P > .10). All variables with P < .05 in univariate logistic regression were included in the initial model, and non-significant variables were sequentially excluded to obtain the final parsimonious model. For internal validation of the predictive model, 10-fold cross-validation was performed to evaluate robustness. The model's performance was assessed by the C-index (discrimination) and calibration slope (calibration). Intra-class correlation coefficient (ICC) was used to detect the consistency of measurements among observers. A good consistency was indicated when the ICC value was > 0.75. Additionally, Cohen's Kappa coefficient was used to quantify interobserver agreement for TB grading between two pathologists, with Kappa > 0.80 defined as excellent consistency. ROC curve was used to analyze the parameters with statistically significant differences and their combined evaluation efficiency. AUC, its 95% confidence interval, and the corresponding Youden index, sensitivity, and specificity were calculated. DCA was carried out to determine the clinical practicality of the prediction model. P < .05 was considered to indicate a statistically significant difference.
Results
Patient Characteristics
177 patients (median age, 65 years; 104 males and 73 females), including 108 in the low-grade TB group and 69 in the medium-high grade TB group, were included in this study. In the cohort, significant differences are observed in several parameters such as T stage (P = .003), N stage (P < .001), differentiation degree (P < .001), wall thickening pattern (P = .007), SII (P < .001) and ECV (Table 1).
Demographic and Pathological Characteristics.
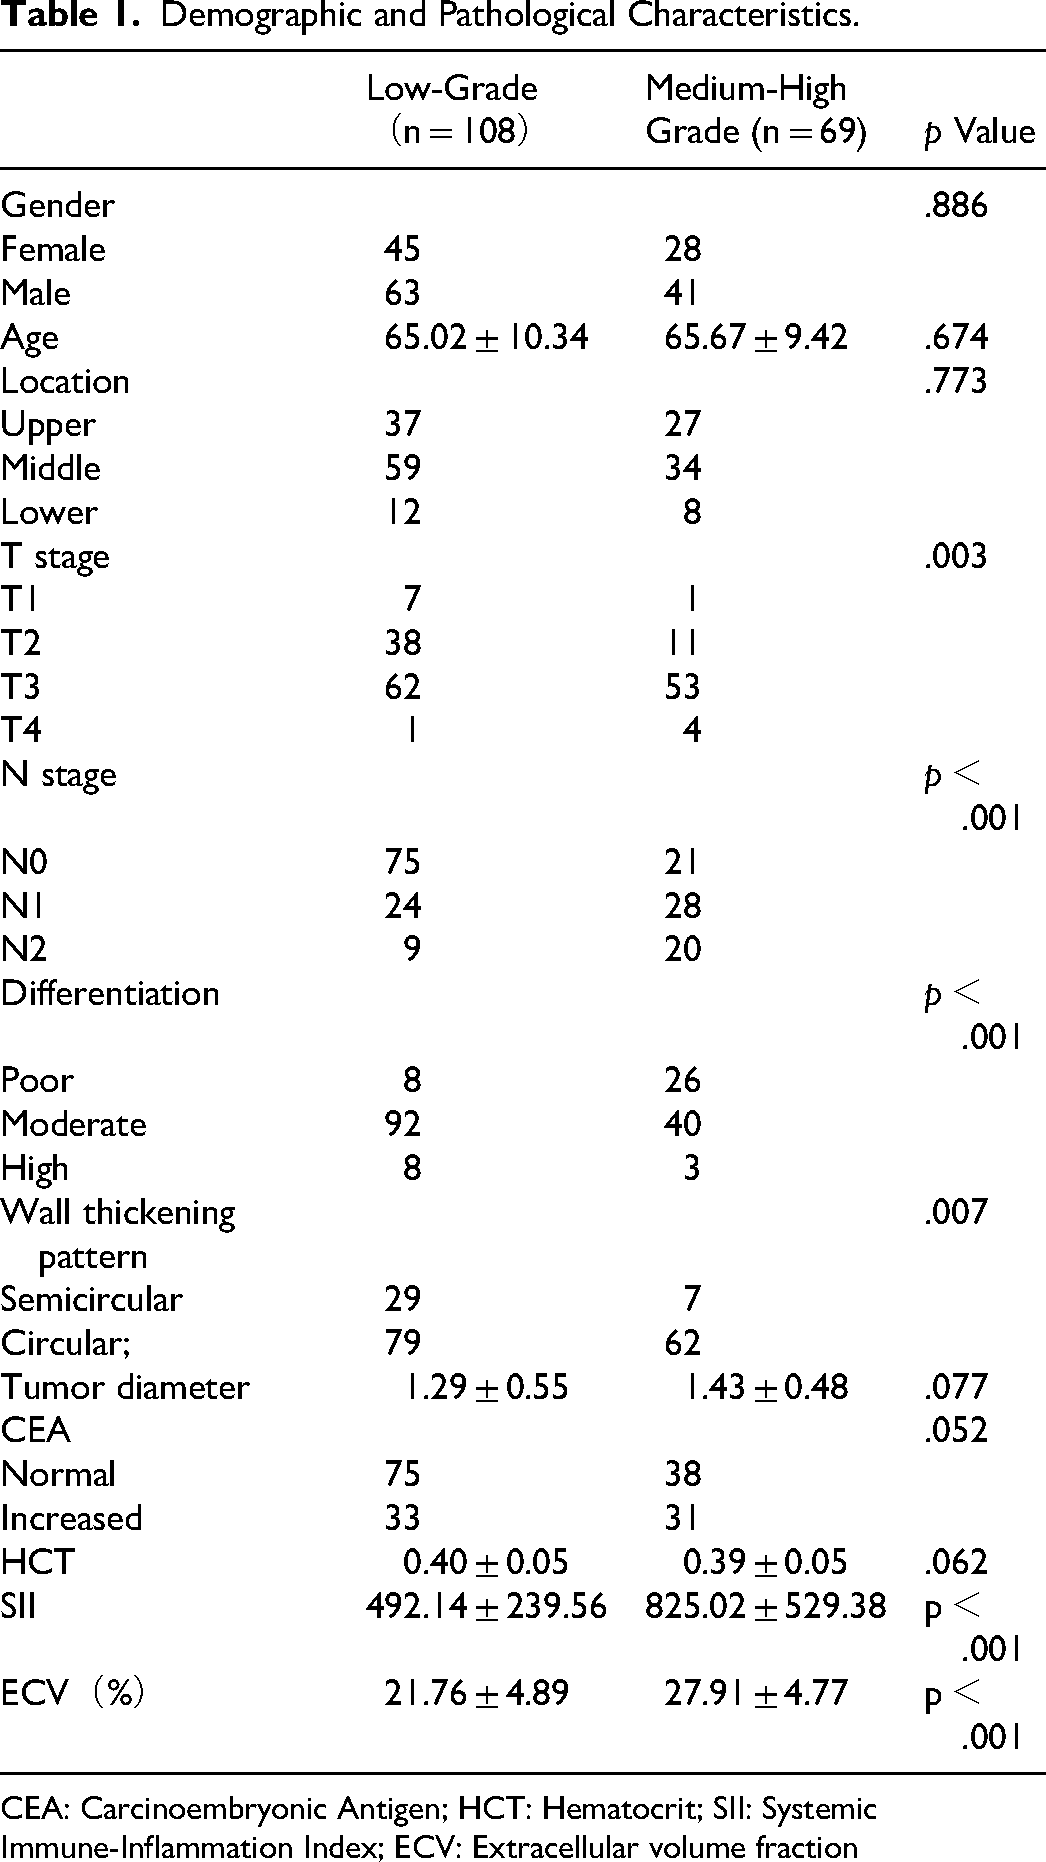
CEA: Carcinoembryonic Antigen; HCT: Hematocrit; SII: Systemic Immune-Inflammation Index; ECV: Extracellular volume fraction
Inter-Observer Agreement Evaluation
Analysis of 30 randomly selected patients’ CT images revealed excellent agreement in ECV between the two observers, with an ICC value of 0.98 (95% CI = 0.96-0.99). The Bland - Altman plot of ECV showed that the mean bias of ECV between reader 1 and reader 2 was - 0.20 (95% CI = -1.04-0.68, P = .05). The Bland - Altman plot is shown in Figure 2

Bland - Altman analysis of ECV measurement consistency in rectal cancer. ECV = extracellular volume fraction.
Comparison of ECV and SII in Different TB Grading of Rectal Cancer
The average ECV value of low-grade group was lower than that of medium-high grade group of rectal cancer (21.76 ± 4.89% vs 27.91 ± 4.77%), and the difference was statistically significant (t = − 8.231, P < .001). The average SII value of low-grade group was lower than that of medium-high grade group of rectal cancer (2.14 ± 239.56 vs 825.02 ± 529.38), and the difference was statistically significant (t = -4.912, P < .001). See Figure 3 for details.

Violin plot of ECV and SII distribution in rectal cancer by TB grading (LG vs HG). Violin plots show ECV (A) and SII (B) values were higher in the medium-high grade group (HG) than the low-grade group (LG). This implies that medium-high grade group may be accompanied by a higher ECV. It suggests that an increased ECV may be related to a more aggressive phenotype of the tumor and can assist in speculating the malignancy of the tumor. An increased SII may be associated with the poor prognosis of the tumor and can serve as a potential indicator for evaluating the prognosis of the tumor. ECV = extracellular volume fraction, SII = systemic Immune Inflammation Index, TB = tumor budding, LG = low- grade group, HG = high - grade group.
Analysis of Risk Factors for TB Grading in Rectal Cancer
The results of univariate logistic regression analysis based on clinical and imaging features showed that T stage, N stage, differentiation degree, wall thickening pattern, ECV, and SII were related factors affecting the TB grading in patients with rectal cancer (P < .05). The results of multivariate logistic regression analysis showed that ECV value [OR value: 1.339 (95% CI: 1.194-1.502)] and SII value [OR value: 1.00 (95% CI: 1.002-1.005)] were independent risk factors for predicting TB grading (P < .05) (Table 2). In addition, we also conducted a collinearity diagnostic analysis. The VIF(Variance inflation factor) values indicated that the VIF values of all variables were less than 5, suggesting that there was no collinearity problem in the model.
Univariate and Multivariate Logistic Regression Analyses of Factors Influencing TB Grading in Rectal Cancer.

OR: Odds ratio; ECV: Extracellular volume fraction; SII: Systemic Immune-Inflammation Index; VIF: Variance inflation factor
Diagnostic Efficiency of ECV and SII for TB Grading
In the training set, the AUCs of ECV and SII in evaluating TB grading of rectal cancer were 0.838 (95% CI: 0.760-0.905),0.755 (95% CI: 0.663-0.829), and the combination was 0.889 (95% CI: 0.832-0.943). In the test set, the AUCs of ECV and SII in evaluating TB grading of rectal cancer were 0.741(95% CI: 0.626-0.870),0.716 (95% CI: 0.554-0.849), and the combination was 0.815 (95% CI: 0.711-0.913). See Table 3 and Figure 4 for details. The DeLong test results show that in both the training set and the test set, there are significant differences between the AUC of the combined model and those of ECV and SII(p < .05).DCA confirmed the combined model ‘s superior clinical benefit (Figure 5).
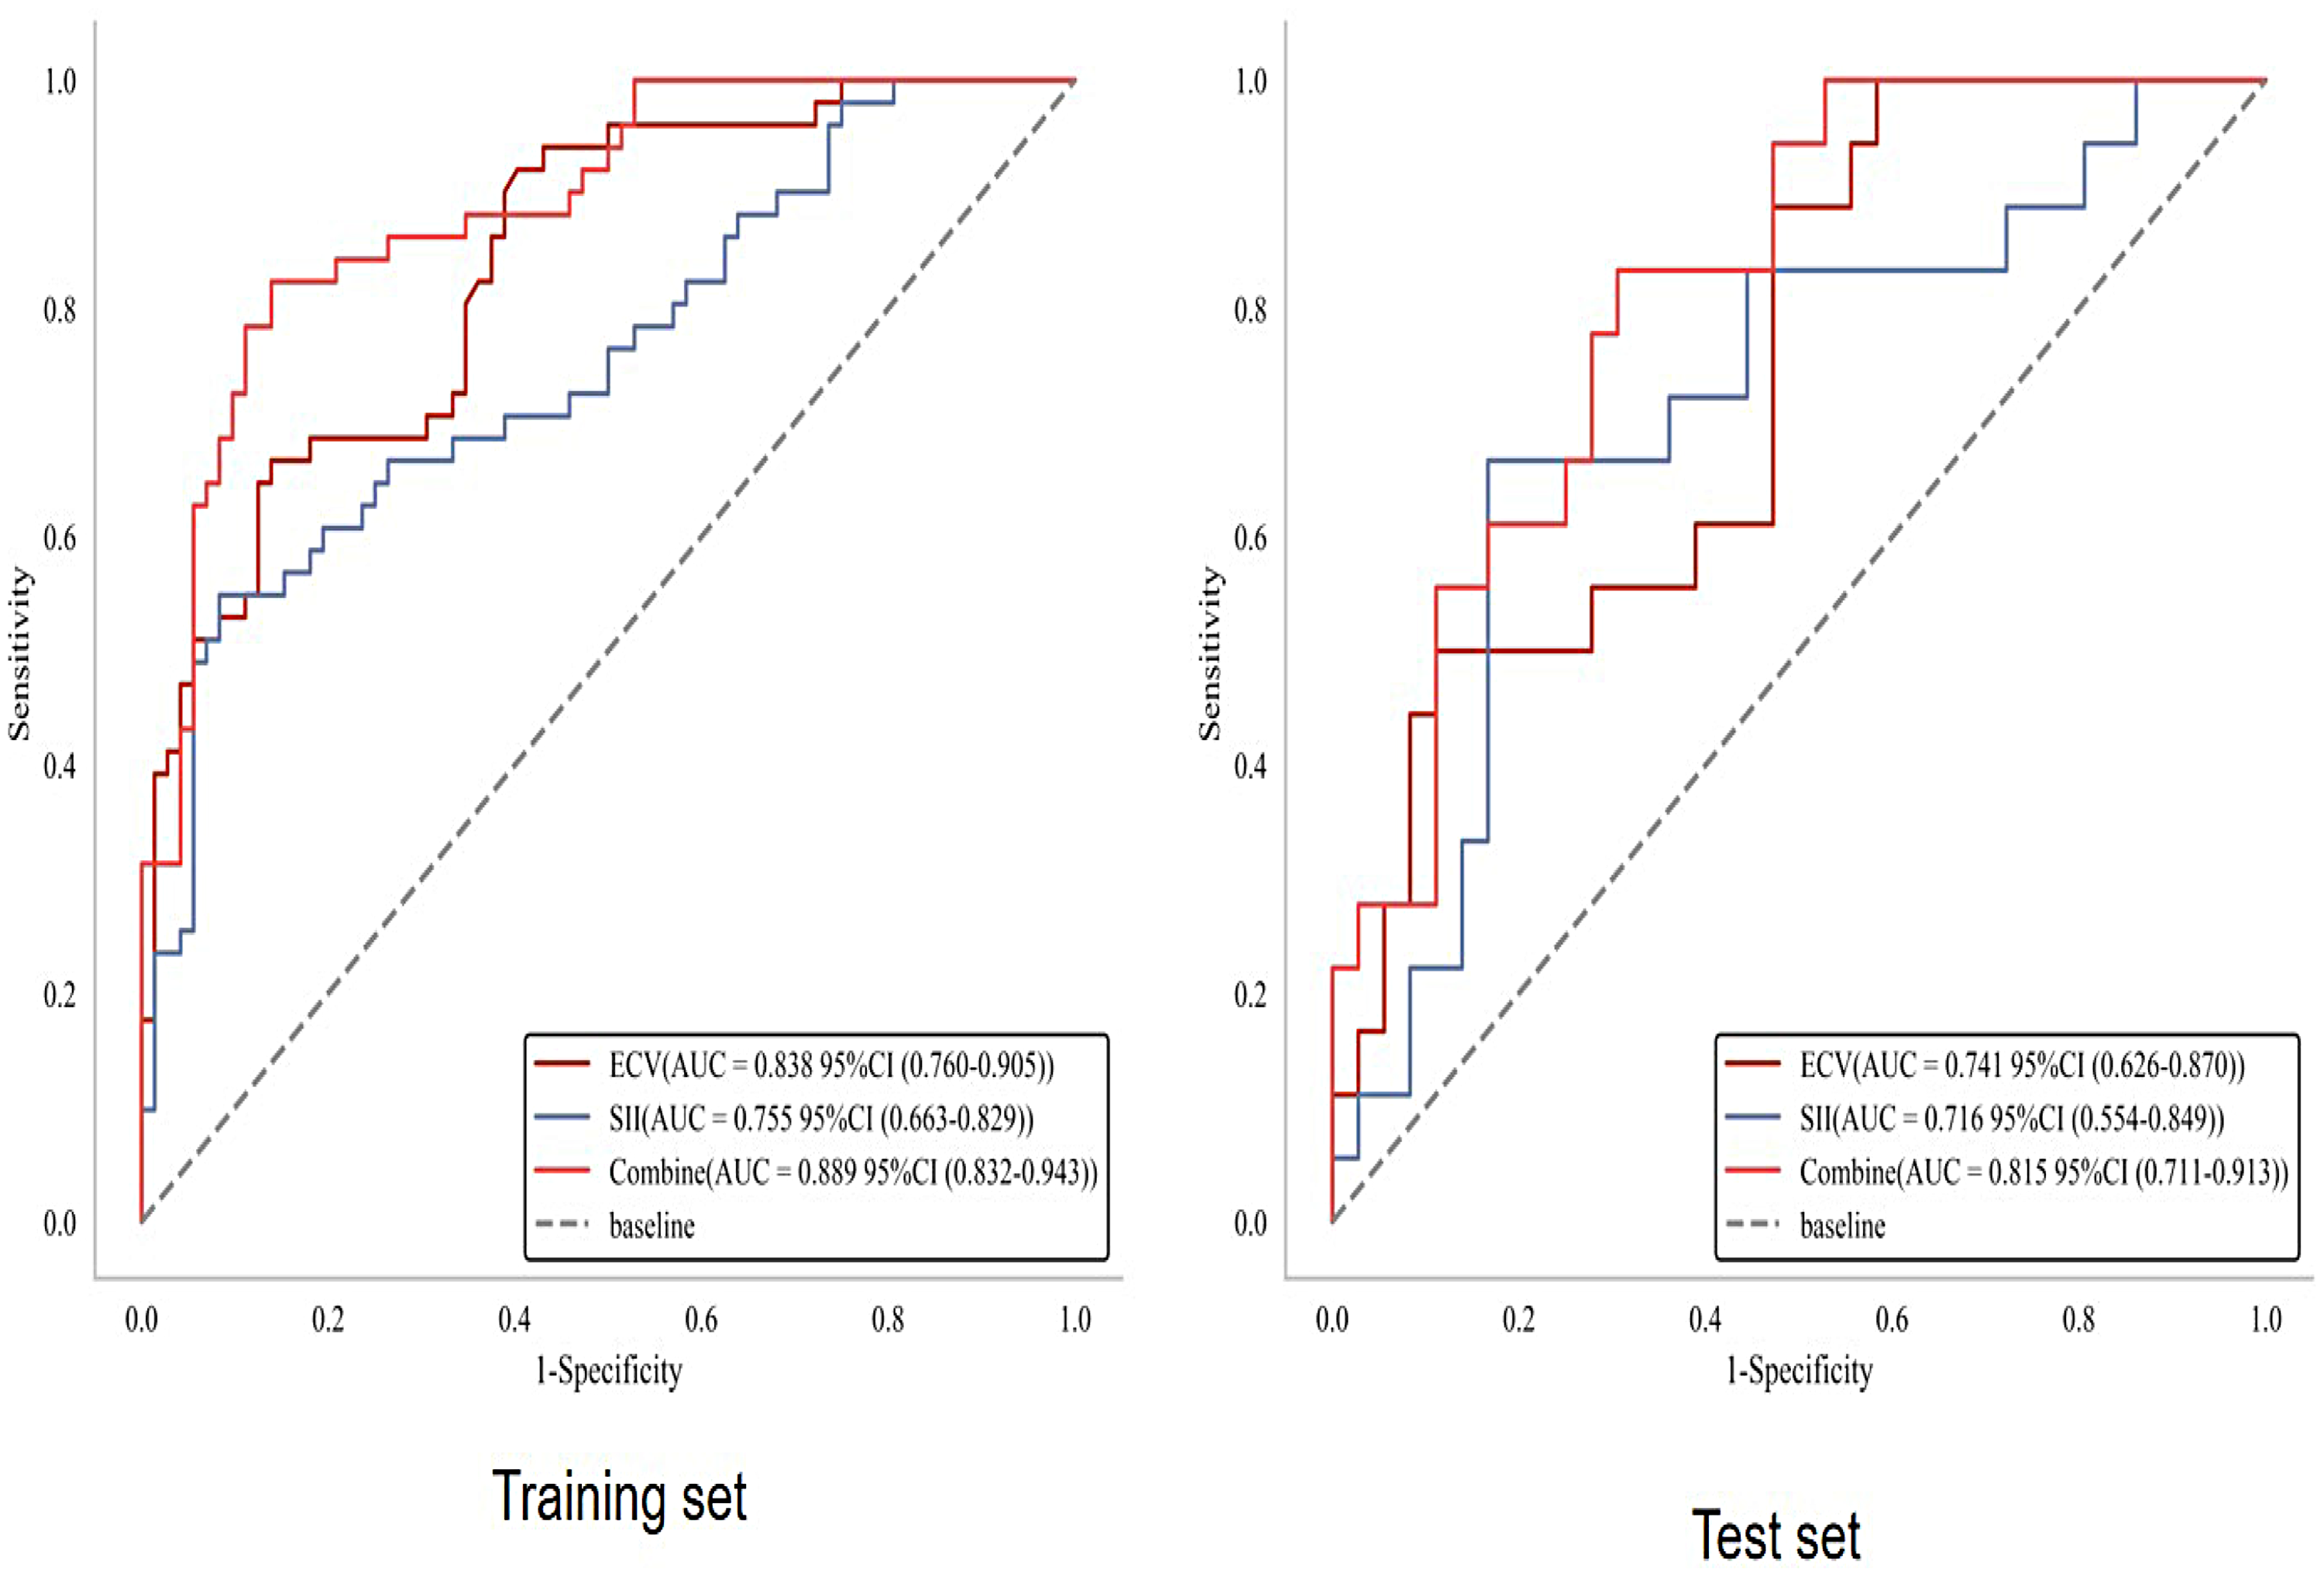
ROC analysis of ECV, SII, and the combination for predicting TB grading of rectal cancer. In the training set, the AUCs of ECV, SII, and their combination for evaluating rectal cancer TB grading were 0.838 (95% CI: 0.760-0.905), 0.755 (95% CI: 0.663-0.829), and 0.889 (95% CI: 0.832-0.943), respectively. In the test set, the corresponding AUCs were 0.741 (95% CI: 0.626-0.870), 0.716 (95% CI: 0.554-0.849), and 0.815 (95% CI: 0.711-0.913). This means the combined index has superior diagnostic performance compared to either marker alone. Integrating these two biomarkers may be helpful to identify aggressive tumor phenotypes, predict poor prognosis and guide personalized treatment decisions. ROC = receive operating curve, ECV = extracellular volume fraction, SII = systemic Immune-Inflammation Index, TB = tumor budding, AUC = aera under curve.

DCA of ECV, SII, and the combination for predicting TB grading of rectal cancer. ECV (dark blue) & SII (yellow): Single-biomarker models, which outperform the “None” baseline but have limited utility. ECV + SII (gray): Combined model, showing superior net benefit across most risk thresholds (0.1-0.7) and supporting precise clinical decision-making. All (red): Multi-indicator model, prone to overfitting at thresholds >0.5 and thus lacking practical utility. None (light blue): Baseline model representing one-size-fits-all clinical decisions. DCA = decision curve analysis, ECV = extracellular volume fraction, SII = systemic Immune-Inflammation Index, TB = tumor budding.
Diagnostic Efficacy Comparison of ECV, SII, and the Combination for Predicting TB Grading of Rectal Cancer in Training and Test set.

AUC: Area under curve; Extracellular volume fraction; SII: Systemic Immune-Inflammation Index
Discussion
This study for the first time explored the value of enhanced CT - derived ECV combined with SII in predicting TB grading of rectal cancer. The results showed that ECV and SII both were independent risk factors for TB grading, and the predictive efficacy of the combined model was significantly better than that of a single indicator (AUC = 0.872).
TB, as a core marker of the invasive biological behavior of rectal cancer, is closely related to the stromal remodeling of the tumor microenvironment (TME). The results of this study showed that ECV value in medium-high TB group was significantly higher than that in low - grade group (27.91 ± 4.77% vs 21.76 ± 4.89%, P < .001). Moreover, multivariate analysis confirmed that ECV is an independent risk factor for predicting TB grading (OR = 1.339, P < .001), suggesting that an increase in ECV is closely related to the invasive phenotype of tumor budding. Mechanistically, ECV directly reflects the physical properties of the tumor stroma by quantitatively evaluating the degree of tissue fibrosis and microvascular density. Tumor stromal fibrosis can lead to local hypoxia by increasing tissue stiffness and compressing blood vessels. The hypoxic microenvironment is a key inducer that may promote epithelial-mesenchymal transition (EMT), which is hypothesized to contribute to tumor cells losing polarity, acquiring migratory ability, and subsequently forming single or small clustered ‘budding’ structures.20,21 In addition, an increase in ECV indicates an increase in microvascular density, which may provide nutritional support for the invasion and metastasis of budding cells. 22 The results of this study are consistent with previous studies on the relationship between ECV and the invasive phenotype of tumors. For example, Liu et al 23 found that ECV can predict the pathological grade of clear cell renal cell carcinoma, and Zhang et al 16 confirmed that ECV is associated with vascular invasion in colorectal cancer, further supporting the clinical significance of ECV as a quantitative indicator of the “physical characteristics” of the tumor stromal microenvironment.
SII quantifies the imbalance between pro-inflammatory and anti-tumor immunity in the body by integrating platelet, neutrophil, and lymphocyte counts. In this study, the SII values in medium-high TB grading groups were significantly increased (825.02 ± 529.38 vs 492.14 ± 239.56, P < .001), and multivariate analysis showed that SII was an independent predictor of TB grading (OR = 1.004, P < .001), suggesting a close association between the systemic immune-inflammatory state and the occurrence and development of TB grading. Specifically, the core mechanism of the increase in SII lies in the imbalance between pro-inflammatory cells (neutrophils, platelets) and anti-tumor immune cells (lymphocytes): Neutrophils can degrading the extracellular matrix by releasing matrix metalloproteinases (MMPs), creating a path for the invasion of tumor budding cells 9 ; Platelets can release cytokines such as platelet-derived growth factor (PDGF), promoting the survival and migration of tumor cells 10 ; The decrease in lymphocytes (especially cytotoxic T cells) weakens anti-tumor immune surveillance, allowing budding cells to escape immune attacks. 11 Previous studies have confirmed that an elevated SII is associated with chemoresistance and distant metastasis in colorectal cancer.24–26 This study further correlates SII with TB, an invasive biological marker, providing new evidence for understanding the linkage mechanism of “systemic immune inflammation - local tumor invasion”.
In this study, the predictive efficacy of ECV combined with SII was significantly better than that of single indicators. Clinical decision curve analysis also showed that it had a higher benefit, reflecting the complementarity between the “physical characteristics of the local microenvironment” and the “systemic immune-inflammatory state”. From a biological perspective, tumor budding is jointly driven by local stromal remodeling and systemic immune imbalance: ECV reflects tumor stromal fibrosis and microvascular density, embodying the “physical barrier disruption” of the local microenvironment and providing “soil” for budding cells; SII quantifies the systemic immune-inflammatory state and reflects the “failure of immune control” of the body over budding cells. The two explain the mechanism from the two dimensions of “local support” and “systemic escape”, and their combined application can more comprehensively capture the biological characteristics of TB grading. From the perspective of clinical practice, this model, as a decision-support and hypothesis-generating tool rather than a practice-changing algorithm at this stage, breaks through the limitations of traditional TB grading assessment: based on preoperative enhanced CT and routine blood tests, it is a non-invasive and dynamically predictive examination. For patients with low predicted TB grading (based on low ECV and SII values): routine radical resection (Dixon/Miles procedure) could be considered as a preferred option, with reduced reliance on neoadjuvant therapy to avoid unnecessary treatment-related toxicity. Postoperative follow-up can follow standard protocols, as the risk of local recurrence and distant metastasis is relatively low. For patients with medium-high predicted TB grading (high ECV and/or SII values): Preoperative neoadjuvant chemoradiotherapy might be recommended to downstage the tumor, reduce the invasive potential of TB, and improve surgical curability. Postoperatively, close surveillance and adjuvant therapy can be tailored to reduce recurrence risk. Notably, this model also provides a valuable non-invasive tool for TB grading assessment in rectal cancer patients ineligible for neoadjuvant chemoradiotherapy (nCRT), which can offer a reference for guiding the formulation of individualized surgical plans and adjuvant therapy strategies for this specific population. This study has the following limitations: First, this study is a single - center retrospective cohort with a relatively limited sample size (177 cases), and there may be selection bias. The results need to be verified by multi - center prospective studies. Second, the standardization of ECV measurement: although the consistency of ECV measurement by two observers in this study is good (ICC = 0.98), the current ECV calculation relies on single-slice CT measurement. However, tumors are three-dimensional structures with heterogeneous stromal distribution, and single-slice sampling may fail to capture the overall ECV characteristics of the entire tumor, potentially leading to measurement bias. Additionally, different CT devices and scanning parameters (such as contrast agent dose, equilibrium phase delay time) may affect the stability of ECV, and a standardized measurement protocol needs to be further developed. Third, the lack of external validation is a critical limitation. The predictive model established in this study was developed and tested based on a single-center dataset. External validation is essential to assess the model's robustness, generalizability, and potential for clinical translation. Fourth, the sensitivity of SII to inflammatory confounders cannot be ignored. SII is calculated based on peripheral blood neutrophil, platelet, and lymphocyte counts, which are highly sensitive to systemic inflammatory states unrelated to the tumor itself, and future studies need to exclude such factors to improve accuracy. Fifth, other markers were not included: The occurrence of tumor budding may also be related to circulating tumor cells (CTCs), microRNAs (miRNAs), etc Combining more markers may further improve the predictive efficiency.
Conclusion
Enhanced computed tomography (CT)-derived ECV combined with SII can non-invasively and efficiently predict TB grading of rectal cancer. The underlying mechanism involves the synergistic effect of local stromal remodeling (reflected by ECV) and systemic immune inflammation (quantified by SII), which jointly drives the invasive phenotype of tumor budding. This combined model, with a high predictive efficacy, serves as a decision-support and hypothesis-generating tool that overcomes the limitations of traditional postoperative TB grading assessment and preoperative invasive biopsies, and provides a practical and accessible reference for preoperative risk stratification of rectal cancer at this stage.
Supplemental Material
sj-docx-1-tct-10.1177_15330338261426699 - Supplemental material for The Predictive Value of Extracellular Volume Fraction Derived from Enhanced CT Combined with Systemic Immune-Inflammation Index for Tumor Budding in Rectal Cancer
Supplemental material, sj-docx-1-tct-10.1177_15330338261426699 for The Predictive Value of Extracellular Volume Fraction Derived from Enhanced CT Combined with Systemic Immune-Inflammation Index for Tumor Budding in Rectal Cancer by Wei Chen, Yating Wang, Genji Bai, Wei Huang and Min Huang in Technology in Cancer Research & Treatment
Footnotes
Abbreviations
Acknowledgments
Not applicable.
Ethical Statement
This study was approved by the Ethics Committee of the Affiliated Huaian No.1 People's Hospital of Nanjing Medical University (Number: KY-2022-045-01). As a retrospective study, the patients were exempted from written informed consent.
Funding
The authors received no financial support for the research, authorship, and/or publication of this article.
Declaration of Conflicting Interests
The author(s) declared no potential conflicts of interest with respect to the research, authorship, and/or publication of this article.
Supplemental Material
Supplemental material for this article is available online.
References
Supplementary Material
Please find the following supplemental material available below.
For Open Access articles published under a Creative Commons License, all supplemental material carries the same license as the article it is associated with.
For non-Open Access articles published, all supplemental material carries a non-exclusive license, and permission requests for re-use of supplemental material or any part of supplemental material shall be sent directly to the copyright owner as specified in the copyright notice associated with the article.