
Abstract
Background
Tumor necrosis factor receptor superfamily member (10B TNFRSF10B), as a key apoptosis regulator of Oral Squamous Cell Carcinoma (OSCC), exerts a critical effect on its development.
Methods
Differentially expressed genes in OSCC (GSE25099) were screened first. Weighted gene co-expression network analysis identified gene modules, followed by Lasso regression and Cox modeling to pinpoint pivotal genes. Expression was validated in the Cancer Genome Atlas databases and in clinical samples. The Search Tool for the Retrieval of Interacting Genes/Proteins database was used to generate a protein–protein interaction (PPI) network, and Gene Ontology and Kyoto Encyclopedia of Genes and Genomes analyses explored biological functions. Then, for in vitro assays, core gene-targeted siRNAs were introduced into SCC-4 and SCC-9 cell lines to mediate gene knockdown. Cell proliferation was quantified by the CCK-8 method, and apoptotic activity was assessed via flow cytometry, TUNEL staining, and Western blotting for apoptosis-associated proteins.
Results
Among the 10 core genes that were further screened, TNFRSF10B was most notably linked to unfavorable OSCC prognosis and showed strong diagnostic power. Additionally, its overexpression was associated with clinical stage, nodal metastasis, and chemoresistance. PPI and enrichment analyses revealed its role in extrinsic and necroptotic apoptosis. Moreover, the knockdown of TNFRSF10B suppressed viability and induced apoptosis by upregulating Bax, downregulating Bcl-2, and activating Caspase-3/PARP.
Conclusions
TNFRSF10B drives OSCC progression by impairing apoptosis. Its overexpression correlates with poor prognosis and represents a potential diagnostic and therapeutic target. Furthermore, targeting TNFRSF10B may restore apoptosis, thus making precision therapy achievable.
Introduction
Oral squamous cell carcinoma (OSCC) represents the most prevalent malignant tumor in the oral cavity, constituting over 90% of all oral cancers and serving as a leading cause of morbidity and mortality in head and neck malignancies worldwide. Epidemiological studies indicate approximately 350,000 new cases and 177,000 OSCC-related deaths annually, highlighting a substantial global public health burden. 1
Despite continuous improvements in diagnosis and treatment, the 5-year overall survival rate for OSCC patients remains suboptimal, at approximately 50%, and declines to below 30% in advanced stages.2,3 This limited progress can be largely attributed to two interrelated factors: the complexity and incomplete understanding of OSCC pathogenesis, and the absence of fundamentally effective treatment strategies.4,5 Therefore, elucidating the key molecular mechanisms underlying OSCC development is crucial for identifying novel therapeutic targets and improving patient prognosis.
Biomarkers are essential not only for early detection, treatment response prediction, and prognosis assessment of OSCC, but also for overcoming current therapeutic limitations and advancing personalized treatment strategies. Given that most OSCC patients are diagnosed at intermediate to advanced stages with poor long-term survival, establishing reliable biomarkers is particularly important. Recent advances in molecular biology techniques, including single-cell sequencing and spatial transcriptomics, combined with sophisticated bioinformatics analysis, have significantly deepened our understanding of OSCC molecular heterogeneity. These developments are further driving biomarker research from single-protein detection toward integrated multi-omics approaches that incorporate genomic, transcriptomic, and proteomic data.6–9 For example, astrocyte elevated gene-1 exhibits significant overexpression in diverse cancer types. It also has close associations with immune infiltration, tumor grade and patient prognosis, so it represents a potential prognostic immunological biomarker for OSCC. 10 Similarly, annexin A5 and procollagen-lysine,2-oxoglutarate 5-dioxygenase 2 (PLOD2) are considered critical indicators of poor prognosis in OSCC and may contribute to tumor metastasis via epithelial-mesenchymal transition, transforming growth factor-β (TGF-β) signaling, and hypoxia-associated pathways.11,12 Additionally, aurora kinase A (AURKA) and ninein-interacting protein (AUNIP) have recently become a promising diagnostic and prognostic tool for OSCC. Studies have shown that downregulating AUNIP not only inhibits OSCC cell proliferation but also leads to cell cycle blockade at the G0/G1 stage. These findings thus underscore that AUNIP has potential as a therapeutic target for OSCC, with implications for prevention strategies.13,14
TNFRSF10B, also known as tumor necrosis factor receptor superfamily member 10B (TNFRSF10B) and death receptor 5 (DR5), is a critical component of the TNF receptor superfamily that centrally regulates the balance between cellular growth and demise. This regulatory function is exerted through its binding to the Tumor necrosis factor-related apoptosis-inducing ligand (TRAIL). Such binding activates the caspase cascade apoptotic signaling pathway.15–17 Evidence indicates that TNFRSF10B exhibits aberrant expression across multiple solid malignancies, including breast and colorectal cancer. In these cancers, the expression of TNFRSF10B shows a significant correlation with apoptosis sensitivity, chemotherapeutic response, and patient prognosis.18–20 However, OSCC is a highly heterogeneous malignancy, and within this context, the expression patterns of TNFRSF10B, its regulatory mechanisms in apoptosis, and its clinical implications remain largely unexplored.
To clarify the role of TNFRSF10B in OSCC, this study screened for differentially expressed genes (DEGs) from transcriptomic datasets in the public Gene Expression Omnibus (GEO) database first. Then weighted gene co-expression network analysis (WGCNA) was used to construct a co-expression network. Lasso regression was subsequently applied to identify hub genes. Data from The Cancer Genome Atlas (TCGA) database were utilized to validate the prognostic and diagnostic values of TNFRSF10B. Additionally, the Search Tool for the Retrieval of Interacting Genes/Proteins (STRING) database together with Gene Ontology (GO) and Kyoto Encyclopedia of Genes and Genomes (KEGG) analyses was used to unravel TNFRSF10B's function in apoptosis-related pathways. At the experimental level, high TNFRSF10B expression in clinical OSCC tissues was verified. Subsequently, small interfering RNA (siRNA)-mediated TNFRSF10B knockdown was carried out in SCC-4 and SCC-9 cells and then the impacts on OSCC cell viability and apoptosis were examined using Cell Counting Kit-8 (CCK-8), flow cytometry, terminal deoxynucleotidyl transferase dUTP nick end labeling (TUNEL) staining, and Western blot. Our findings indicate that TNFRSF10B was most notably linked to unfavorable OSCC prognosis and showed strong diagnostic power, providing a novel target and theoretical basis for precise OSCC diagnosis and treatment.
Methods
Acquisition of Data and Analysis of Differential Expression Patterns
Transcriptomic datasets associated with OSCC were obtained from the Gene Expression Omnibus (GEO, https://www.ncbi.nlm.nih.gov/geo, GSE25099), which include expression data from 57 OSCC patients and 22 normal oral tissue samples. Raw microarray data were downloaded and preprocessed using the R package GEOquery, with preprocessing steps including background correction, normalization, and probe annotation. Multiple datasets were integrated and batch effects were removed prior to differential expression analysis. DEGs between OSCC and adjacent non-tumorous tissues were determined using the limma package, applying thresholds of |log 2 fold change (log2FC)| ≥ 1 and adjusted P value (adj. P) < .05. The distribution of DEGs was illustrated through a volcano plot.
WGCNA-Based Identification of Key Co-Expression Modules
WGCNA was conducted with the R WGCNA package to explore gene expression patterns in OSCC and normal oral tissues. Following data quality control, normalization, and correction for batch effects, the soft-thresholding power (β) was determined according to scale-free topology criteria. Subsequently, an adjacency matrix and a topological overlap matrix were constructed. Gene modules were detected using dynamic tree cutting (minClusterSize = 30, deepSplit = 2) in combination with hierarchical clustering, and modules with high similarity were merged at a cut height of 0.25. The module eigengene, defined as the first principal component of a module's expression matrix, was calculated to represent the overall expression pattern of each module. The correlation between module eigengenes and OSCC phenotype was assessed using Pearson correlation (|r| > 0.5, P < .05), and the results were visualized with a module–trait heatmap.
Lasso Regression for Core Gene Selection in OSCC Modules
The core genes from the key OSCC-associated modules identified by WGCNA were extracted for further selection using Lasso regression. The Lasso model was constructed using the glmnet package in R, with the optimal λ (λ.min) identified to minimize the mean squared error. Genes with non-zero coefficients were selected as candidate core genes. Genes with absolute coefficients > 0.1 and relevant clinical significance were retained and further categorized as oncogenes or tumor suppressors based on the sign of the coefficient. Standardized expression profiles of core genes were retrieved from the GEO dataset. Expression levels were transformed using log2(TPM + 1) to correct for data skewness. Differences in core gene expression between tumor and normal oral tissues were evaluated using the Wilcoxon rank-sum test. To visualize these expression differences, the R package ggplot2 was used to generate box plots.
Survival Analysis and Diagnostic Performance Evaluation of Core Genes
Expression matrices and survival datasets for OSCC core genes were retrieved from the TCGA and GEO cohorts. Patients, stratified into high- and low-expression groups by median expression levels, were compared using the Wilcoxon test. Using the R survival package, we generated Kaplan–Meier survival curves; the log-rank test was used to calculate hazard ratios (HRs) with 95% confidence intervals (CIs). Subgroup analyses were performed by clinical stage and lymph node metastasis status. Diagnostic efficacy was evaluated by constructing receiver operating characteristic (ROC) curves with the pROC package. The Youden index was applied to determine the optimal cutoff value, and the area under the curve (AUC), sensitivity, and specificity were subsequently calculated. A multigene diagnostic model was constructed, and the DeLong test was used to compare AUC differences. Stability was assessed via 1000 bootstrap resamplings and external validation with independent datasets. ggplot2 was used for data visualization.
Nomogram for Survival Probability Prediction
We developed a visual survival prediction tool by building a nomogram from the TCGA-OSCC training set, with validation conducted using GEO cohorts. Expression data of core genes and clinical features were standardized, encoded into dummy variables, and missing values were imputed. Univariate Cox regression (P < .1) followed by stepwise regression was used to construct a multivariate Cox model incorporating both core genes and clinical parameters. We used the rms package to develop the nomogram and score system for 1-, 3-, and 5-year survival probability prediction. Calibration was assessed via Hosmer–Lemeshow test, and model discrimination validation relied on concordance index (C-index; C > 0.75 considered acceptable) calculation. Ten-fold cross-validation and external validation with the GEO cohort confirmed model stability. Stratified subgroup analyses were performed based on age and pathological grade to assess universality.
Correlation Between Core Gene Expression and Clinical Features in OSCC
Transcriptomic data from TCGA and GEO databases were integrated, covering both OSCC tumor tissues and normal controls. After standardization and batch effect correction, gene expression differences were assessed via the Wilcoxon test, while boxplots and paired sample t tests were used to visualize these differences between the two groups. Stratified analyses based on clinical stage and pathological grade were conducted, and the Kruskal–Wallis test was used to explore dynamic associations between core gene expression and tumor invasion depth or lymph node metastasis. Spearman correlation analyses, treatment response grouping, and pan-cancer expression verification were also conducted to determine the specificity of core gene clinical relevance in OSCC.
PPI Network Construction and GO/KEGG Enrichment of Core Genes
A total of 56 key genes were selected for downstream analysis based on their identification by both Lasso regression and WGCNA. Using this gene set, a protein-protein interaction (PPI) network was constructed with the STRING database (version 12.0, confidence score > 0.7). The network visualization was carried out in Cytoscape, and key modules were extracted using the MCODE plugin (score > 2.0). Hub genes were further screened using the CytoHubba algorithm. GO enrichment analysis (covering biological process [BP], cellular component [CC], and molecular function [MF]) and KEGG pathway analysis were performed using the clusterProfiler package (FDR < 0.05). Gene-pathway associations were visualized via bubble plots, bar plots, and cnetplots. The results were cross-validated using the DAVID database, and PPI modules were compared with enriched functional pathways to clarify the biological roles and regulatory mechanisms of core genes in OSCC.
Clinical Sample Collection
Six OSCC patients confirmed by histopathology were recruited. Primary tumor tissues and adjacent non-tumorous oral mucosa (≥2 cm from tumor margin) were collected and stored at −80 °C. Prior to enrollment, each participant provided written informed consent. The research procedures were reviewed and approved by the Ethics Committee of the Fourth Hospital of Hebei Medical University (Approval No.: 2021KY197). Additionally, the study was conducted in accordance with the Helsinki Declaration of 1975, as revised in 2024.
Reverse Transcription Quantitative PCR (RT-qPCR)
Total RNA was isolated from OSCC and adjacent normal tissues using TriQuick Reagent (Beijing Solarbio Science & Technology Co., Ltd, Beijing, R1100). Phase separation was achieved using a chloroform substitute (ECOTOP, Guangzhou, ES-8522-100 mL), followed by RNA precipitation with isopropanol (Baishi Chemical Industry Co., Ltd, Tianjin). RNA was dissolved in diethyl pyrocarbonate -treated water for subsequent use. Complementary DNA (cDNA) was synthesized using the SureScript™ First-Strand cDNA Synthesis Kit (GeneCopeia, USA, QP056 T) and stored at −20 °C. RT-qPCR was performed using 2×SYBR Green qPCR Master Mix (None ROX, Servicebio, Wuhan, G3320-05) and gene-specific primers. Amplification was conducted on a SLAN-96S automated PCR system (Shanghai Hongshi Medical Technology Co., Ltd, Shanghai). Relative mRNA expression levels were normalized to β-actin using the 2−ΔΔCt method. Gene-specific primers, including those for target gene TNFRSF10B and internal reference gene β-actin, were all custom-designed and synthesized by GeneCreate Biological Engineering Co., Ltd (Wuhan, China). Their sequences are shown in Table 1.
Primer Sequences for Target Genes in RT-qPCR.

Protein Extraction and Western Blot Analysis
Total proteins from OSCC tissues and paired adjacent normal tissues, as well as from SCC-4 and SCC-9 cells following transfection with si-TNFRSF10B or siRNA-Negative Control (si-NC), were extracted using RIPA lysis buffer (Beijing Solarbio Science & Technology Co., Ltd, Beijing, R002). After collecting the supernatant, protein concentrations were measured with the Bradford Protein Assay Kit (BOSTER Biological Technology Co., Ltd, Wuhan, AR0145). Denatured protein samples in equal amounts were separated by SDS-PAGE (BOSTER Biological Technology Co., Ltd, Wuhan, AR0198) and transferred onto PVDF membranes (Millipore, USA, IPVH00010). After blocking with BSA (BOSTER Biological Technology Co., Ltd, Wuhan, AR0187), membranes were incubated overnight at 4 °C with primary antibodies, including anti-DR5 (TNFRSF10B, #DF6368) and anti-β-actin (#AF7018), anti-Caspase-3 (#AF6311), anti-Bcl-2 (B-cell lymphoma-2, #AF6139), and anti-Bax (Bcl-2-associated X protein, #AF0120) (all from Affinity Biosciences Co., Ltd, Jiangsu, China), as well as anti-PARP1 (poly(ADP-ribose) polymerase 1, Wuhan Sanying Biology Technology Co., Ltd, China, 22999-1-AP). The membranes were then incubated with Horseradish Peroxidase (HRP)-conjugated goat anti-rabbit IgG secondary antibody (Abcam, UK, ab7090) for 2 h at room temperature. Protein bands were visualized using Western LightningTM Chemiluminescence Reagent (PerkinElmer, USA, NEL10300EA) and imaged with the FluorChem FC2 Imaging System (Alpha, Shanghai, China). Band intensities were quantified using ImageJ software (version 1.8.0) and normalized to β-actin.
Cell Culture
SCC-4 (ATCC® CRL-1624TM, RRID: CVCL_1684) and SCC-9 (ATCC® CRL-1629 TM, RRID: CVCL_1685) human OSCC cell lines were purchased from the American Type Culture Collection (ATCC, Manassas, VA, USA). Cells were cultured in DMEM supplemented with 10% fetal bovine serum (Thermo Fisher Scientific, GIBCOTM, USA, TB-534237681231) and 1% penicillin–streptomycin (Xiaopeng Biotechnology Co., China, C3421). All cultures were maintained at 37 °C in a humidified atmosphere with 5% CO2. Cultures were observed routinely, and subculturing or experimental procedures were initiated once cell density reached ∼90% confluence to preserve cellular health.
Design, Synthesis, and Transfection of siRNA
Two siRNAs specifically targeting TNFRSF10B (si-TNFRSF10B-1 and si-TNFRSF10B-2) and a scrambled negative control (si-NC) were synthesized by GenePharma (China). Transfections were carried out with Lipofectamine 3000 (Invitrogen, Cat# L3000008) following the supplier's protocol. SCC-4 and SCC-9 cells were seeded into 6-well plates at 3 × 10⁵ cells per well one day prior to transfection. At ∼50% confluence, siRNAs (final concentration 100 nM) were diluted in serum-free medium, complexed with Lipofectamine 3000, and allowed to stand at room temperature for 10-15 min. Cells were rinsed with PBS (Xiaopeng Biotechnology Co., China, C3580-0500) before the addition of the transfection complexes. After 24 h, culture medium was refreshed, and cells were maintained for an additional 48 h. Transfection efficiency was assessed by RT-qPCR and Western blotting.
CCK-8 Assay
SCC-4 and SCC-9 cells transfected with si-TNFRSF10B or si-NC were plated into 96-well plates at uniform density. After incubation for 24 h at 37 °C in a humidified atmosphere containing 5% CO2, 10 μL of CCK-8 solution (BOSTER Biological Technology Co., Ltd, Wuhan, AR1160-100) was added to each well. Cells were further incubated for 2 h, followed by equilibration at room temperature for 15 min. Absorbance was recorded at 450 nm using a microplate reader (Beijing Perlong New Technology Co., Ltd, Beijing, DNM-9602), and relative cell viability was determined based on the optical density values.
Flow Cytometry for Apoptosis Detection
SCC-4 and SCC-9 cells transfected with siRNAs were collected at 70%–80% confluence. After detachment with 0.25% trypsin–EDTA (Beijing Solarbio Science & Technology Co., Ltd, Beijing, T1300), 5 × 10⁴–105 resuspended cells were pelleted by centrifugation at 1000 rpm for 5 min (Medical Centrifuge, Hunan Xiangyi Laboratory Instrument Development Co., Ltd, Hunan, TGL-16 K) and rinsed twice with PBS.
The resulting pellet was suspended in 195 μL of 1× Binding Buffer (Annexin V-FITC/PI apoptosis kit, Multi Sciences (Lianke) Biotech Co., Ltd, Zhejiang, AP101 – 100 - kit) and sequentially incubated with 5 μL Annexin V-FITC (from the same kit) and 10 μL propidium iodide (PI) (from the same kit). The incubation was performed at room temperature (20-25°C) in the dark (aluminum foil can be used for light protection) for 15 min, during which the cells could be resuspended 2–3 times to improve staining efficiency; after incubation, the cells were placed in an ice bath. Subsequently, apoptotic status was assessed using a BD FACSCaliburTM Flow Cytometer (BD Biosciences, USA, E97501093). The proportions of early apoptotic (Annexin V+/PI−) and late apoptotic (Annexin V+/PI+) cells were quantified with BD FACSDiva software (version 9.0).
TUNEL Assay
SCC-4 and SCC-9 cells transfected with si-TNFRSF10B-1, si-TNFRSF10B-2, or si-NC were seeded on coverslips placed in 24-well plates for culture. The assay was performed using the TUNEL Cell Apoptosis Detection Kit-FITC (Wuhan Boster Biological Engineering Co., Ltd, Wuhan, MK1018). Subsequently, cells were fixed with 4% paraformaldehyde fixative solution (Shanghai Biyuntian Biotechnology Co., Ltd, Shanghai, P0099) for 30 min. After fixation, specimens were incubated with Proteinase K from the kit (freshly diluted 1:200 in 0.01 M Tris Buffered Saline, TBS; Wuhan Boster Biological Engineering Co., Ltd, Hubei, AR0031) at 37 °C for 1-15 min for digestion, followed by three 2-min washes with 0.01 M TBS using a DTY-2000 decolorizing shaker (Beijing Deyou Tianke Technology Development Co., Ltd, Beijing, DTY2000). 20 μL of Labeling Buffer was added to each coverslip to keep the sections moist. After aspirating excess liquid, 20 μL of TUNEL reaction mixture (from the kit) was added, and samples were incubated in a humid chamber at 37 °C in the dark for 2 h. Following three 2-min washes with 0.01 M TBS, 50 μL of blocking solution (from the kit) was added to each coverslip and incubated at room temperature for 30 min; the blocking solution was then discarded without washing. Biotinylated anti-digoxin antibody (from the kit), diluted 1:100 in SABC dilution buffer (from the kit), was added at 50 μL per coverslip, and samples were incubated in a humid chamber at 37 °C for 60 min. After three additional 2-min washes with 0.01 M TBS, nuclei were counterstained with DAPI-containing anti-fluorescence quenching mounting medium (DAPI, 4’,6-diamidino-2-phenylindole; Beijing Solarbio Science & Technology Co., Ltd, Beijing, S2110). Using a fluorescence microscope (OLYMPUS, Japan, BH2-RFCA), apoptotic cells were identified as TUNEL-positive (green fluorescence), while DAPI (blue) visualized all nuclei. The apoptosis index was defined as the percentage of TUNEL-positive cells among total nuclei across five randomly selected microscopic fields.
Statistical Analysis
All statistical calculations were carried out using GraphPad Prism (v8.0.2). Results are expressed as mean ± standard deviations (SD). For pairwise comparisons, Student's t-test was applied. When more than two groups were involved, one-way ANOVA was employed, followed by Tukey's post hoc tests to determine group-specific differences. P values of 0.05 or less were considered statistically significant. Significance thresholds were defined as follows: Non-Significant (NS, P ≥ .05), *P < .05, **P < .01, and ***P < .001. All tests were two-tailed, and each experiment was independently replicated at least three times to ensure robustness of the findings.
Results
Gene Expression Patterns and WGCNA Analysis in OSCC
To systematically explore the gene expression landscape and underlying molecular regulatory networks in OSCC, the differential gene expression analysis was conducted using gene expression data from OSCC and adjacent normal tissues first. When OSCC tissues were compared with normal tissues, 768 genes exhibited increased expression, whereas 771 showed reduced expression (Figure 1A).

Transcriptomic landscape and network analysis in OSCC. (A) Volcano diagram illustrating DEGs in OSCC compared with adjacent non-tumor tissues. Red: upregulated; blue: downregulated. |log2FC| ≥ 1, and adj. P < .05. The analysis included 57 OSCC patient samples and 22 normal oral tissue samples. (B) Determination of optimal soft-thresholding power. β = 11. (left: scale-free topology fitting index, right: average degree of connectivity). (C) Cluster dendrogram showing hierarchical clustering of genes. Hierarchical clustering results based on dynamic tree cutting algorithm, with different gene modules represented by different colors. (D) A heatmap illustrating correlations between gene modules and clinical characteristics, where color represents correlation type (red = positive association; blue = negative association). (E) Gene dendrogram and module colors. In different partitioning rules, each module is represented by a distinct color. (F) Module-trait correlation heatmap. Color intensity indicates correlation strength (red = positive, blue = negative). Values represent Pearson correlation coefficients and their p-values.
Subsequently, WGCNA was performed. The soft-thresholding power β was optimized to 11, yielding a scale-free topology fitting index (R2) of 0.8. Meanwhile, the average connectivity decreased exponentially with increasing values of β, confirming the scale-free nature of the WGCNA-constructed co-expression network (Figure 1B). Next, hierarchical clustering based on gene expression profiles was used to construct a dendrogram. With dynamic tree cutting, genes were divided into 11 co-expression modules. Among these modules, the turquoise module appeared as a primary branch in the dendrogram. It exhibited the strongest positive correlation with normal samples (r = 0.84, P = 6 × 10⁻²²), and also showed an inverse correlation with OSCC samples (r = –0.84, P = 6 × 10⁻²²), These correlations suggest that the turquoise module may function as a tumor-suppressive regulatory network (Figures 1C to F). Taken together, these findings identified the turquoise module as the core negatively regulated network in the context of OSCC progression. Therefore, genes within this module were selected for subsequent analyses.
Screening of OSCC Core Markers and Expression Characterization
To delineate key transcripts linked to OSCC, 10-fold cross-validation-integrated Lasso regression was applied to the turquoise module gene set for feature selection and dimensionality reduction. As the log(λ) increased from −5 to −1, the model deviation initially rose gradually, followed by a sharp increase. Meanwhile, the optimal λ (log(λ) = -3.78) minimized the model error and this model selected 10 genes with non-zero coefficients, effectively narrowing down OSCC-relevant candidates (Figure 2A). Coefficient analysis revealed that genes such as OAS3, MMP1, TMSB10 PFN2, WARS, TRIB1, GBP1, TNFRSF10B had strong positive coefficients, indicating positive associations with OSCC progression (Figure 2B). In contrast, MBNL3 and FAM117B showed negative coefficients, suggesting potential tumor-suppressive roles in OSCC progression. Expression profiling of these 10 core genes in tumor versus normal tissues revealed that OAS3, MMP1, TMSB10, PFN2, WARS1, TRIB2, GBP1, TNFRSF10B, and MBNL3 were significantly overexpressed in OSCC tissues. Specifically, OAS3, MMP1, TMSB10, PFN2, WARS1, TRIB2, GBP1, and TNFRSF10B exhibited extremely significant overexpression with adjusted P value (adj.) P < .001, while MBNL3 showed a significant difference in expression (compared with normal tissues) with an adj. P < .05. In contrast, FAM117B displayed no statistically significant difference (ns) in expression between OSCC and normal tissues (Figure 2C).

Core gene selection and differential expression analysis in OSCC. (A) Lasso regression analysis illustrating the relationship between log(λ), model deviance, and gene coefficient shrinkage. log (λ) = – 3.78. (B) Lasso Regression Coefficient Plot of the 10 Core Genes. A larger absolute value of the coefficient indicates a stronger influence of the gene on the progression of OSCC, with blue representing positive coefficients and red representing negative coefficients. (C) Boxplots displaying gene expression differences between normal and tumor tissues (Y-axis: log2(TPM+1)). *P < .05, **P < .01, ***P < .001. Analysis included OSCC samples (n = 57) and normal oral tissue samples (n = 22).
Survival Analysis, Diagnostic Evaluation, and Prognostic Nomogram Construction
The cox proportional hazards regression analysis was used to assess the prognostic and diagnostic value of core genes in OSCC patients. Kaplan–Meier survival curves revealed that elevated levels of PFN2 and TNFRSF10B were associated with worse overall survival (OS) in OSCC patients (Figure 3A). Specifically, elevated PFN2 expression corresponded to a HR of 1.60 (95% CI: 1.15-2.21, P = .005), while those with high TNFRSF10B expression had an HR of 1.45 (95% CI: 1.05-2.00, P = .026). In contrast, genes such as FAM117B and GBP1 showed no statistically meaningful associations (P > .05). Interestingly, although MMP1 was markedly reduced in tumor tissues, no significant correlation with OS was observed (HR = 0.72, 95% CI: 0.43-1.21, P = .405).

Survival and diagnostic evaluation of OSCC core genes and prognostic nomogram. (A) Kaplan–Meier survival curves for 10 core genes. (B) The ROC curves of PFN2 and TNFRSF10B for OSCC diagnosis are shown. Generally, a gene with an AUC greater than 0.7 can be used as a diagnostic biomarker for OSCC. (C) Nomogram estimating overall survival at 1-, 3-, and 5-years, incorporating clinical stage, pathologic stage, age, alongside TNFRSF10B. (D) Calibration curves validating the nomogram's predictive performance, with the y-axis representing observed fraction survival probability, the x-axis representing predicted survival probability, and the survival probabilities at different years approaching the ideal line.
For diagnostic evaluation, ROC analysis demonstrated that both PFN2 and TNFRSF10B exhibited strong discriminatory power. PFN2 achieved an AUC value of 0.786 (95% CI: 0.732-0.841), accompanied by 72.3% sensitivity and 76.5% specificity. TNFRSF10B exhibited even better performance, featuring an AUC of 0.850 (95% CI: 0.780-0.919), 81.2% assay sensitivity, and 79.8% specificity, which supports its potential as an indicator for OSCC early detection (Figure 3B).
To develop a nomogram to forecast 1-year, 3-year, and 5-year patient survival probabilities, multiple predictive factors including clinical stage, pathologic stage, age, and TNFRSF10B expression were incorporated. Each factor was assigned corresponding points, and the total points obtained by summing these individual points could be used to determine the respective survival probabilities from the nomogram scales. The results indicated that clinical stage had the most significant impact on survival prediction, and higher TNFRSF10B expression was associated with higher total scores, as well as lower 1-year, 3-year, and 5-year survival rates (Figure 3C). Additionally, calibration curves were generated to evaluate the accuracy of the nomogram's predictions. For the 1-year, 3-year, and 5-year survival probabilities, the calibration curves showed that the observed survival probabilities were close to the survival probabilities predicted by the nomogram, which suggested that this nomogram had good predictive accuracy for survival outcomes at these time points (Figure 3D).
Expression Characteristics and Clinical Relevance of TNFRSF10B in OSCC
To systematically assess TNFRSF10B expression and its clinical relevance in OSCC, multidimensional analyses were performed. The paired scatter plot showed markedly increased TNFRSF10B expression levels in tumor tissues relative to adjacent normal tissues (Figure 4A). Compared with normal tissues, stratified analysis by pathological stage revealed significantly increased TNFRSF10B levels in T1–T4 stages (P < .05) and across N0–N2 stages (P < .001), suggesting a positive correlation with local tumor invasion depth and potential involvement in early lymph node metastasis (Figure 4B and C). Moreover, TNFRSF10B expression was markedly higher in Stage II–IV samples than in normal tissues under both pathological and clinical staging frameworks, indicating its potential as a biomarker for OSCC progression (Figure 4D and E). In the analysis of therapeutic outcomes, TNFRSF10B expression in the complete remission (CR) group, partial remission (PR) group, stable disease (SD) group, and progressive disease (PD) group was all significantly higher than that in normal tissues (P < .001 for CR, PR and PD; P < .01 for SD). These findings suggest that TNFRSF10B plays a potential role in the treatment response of OSCC patients (Figure 4F).

Boxplots and scatter plots illustrating differential TNFRSF10B expression in OSCC and normal tissues, and across clinical-pathological features. (A) Paired scatter plot of TNFRSF10B expression between tumor and normal tissues. (B–C) Boxplots showing expression across T stages (T1–T4) and N stages (N0–N3). (D–E) Boxplots comparing expression in pathological and clinical stages (I–IV). (F) TNFRSF10B expression in relation to primary therapy outcomes (CR, PR, SD, PD). (G) The boxplots show TNFRSF10B abundance in tumor samples, relative to paired adjacent non-cancerous tissues, across multiple malignancies. *P < .05, **P < .01, ***P < .001.
Pan-cancer analysis confirmed that TNFRSF10B exhibits different expression patterns across multiple cancer types: it is significantly upregulated in some cancers and downregulated in others, with specific statistical significance for each type. For significant upregulation relative to normal tissues, the cancer types include Cholangiocarcinoma (CHOL), Colon Adenocarcinoma (COAD), Esophageal Carcinoma (ESCA), Glioblastoma Multiforme (GBM), Head and Neck Squamous Cell Carcinoma (HNSC), Kidney Renal Clear Cell Carcinoma (KIRC), Kidney Renal Papillary Cell Carcinoma (KIRP), Lung Squamous Cell Carcinoma (LUSC), Rectum Adenocarcinoma (READ), Stomach Adenocarcinoma (STAD), Thyroid Carcinoma (THCA), and Uterine Corpus Endometrial Carcinoma (UCEC) at P < .001, Kidney Chromophobe (KICH) and Lung Adenocarcinoma (LUAD) at P < .01, and Cervical Squamous Cell Carcinoma and Endocervical Adenocarcinoma (CESC) at P < .05. For significant downregulation relative to normal tissues, the cancer types include Breast Invasive Carcinoma (BRCA) and Lung Squamous Cell Carcinoma (LUSC) at P < .001, and Pheochromocytoma and Paraganglioma (PCPG) and Prostate Adenocarcinoma (PRAD) at P < .05 (Figure 4G).
PPI Network and Functional Enrichment Analysis of TNFRSF10B
To clarify TNFRSF10B's molecular mechanisms, the protein interaction mapping was conducted using the STRING platform, and then functional enrichment analysis was carried out via the Cluster Profiler package. The PPI network showed that TNFRSF10B closely interacts with apoptosis-related proteins including TNFSF10, CASP10, and FAS, forming a highly connected apoptotic regulatory module (Figure 5A). GO-BP assessment identified notable involvement in not only the extrinsic apoptotic signaling pathway but also a more specific form of this pathway mediated via death domain receptors, suggesting that TNFRSF10B may function as a member of the death receptor group in apoptosis regulation (Figure 5B). In the Cellular Component (CC) category, enrichment was observed in terms like membrane microdomain and membrane raft, implicating TNFRSF10B's structural anchoring in signal assembly (Figure 5C). Molecular Function (MF) terms encompassed enrichment for cytokine receptor interaction, tumor necrosis factor receptor superfamily interaction, and death receptor binding, which further supports its regulatory functions in inflammatory and apoptotic signaling (Figure 5D). According to KEGG, both the Necroptosis and Apoptosi pathways were markedly enriched, underscoring the diverse functions of TNFRSF10B in programmed cell demise (Figure 5E). Collectively, the results indicate that TNFRSF10B may potentially regulates extrinsic and necroptotic apoptosis through its localization in membrane rafts and interactions within the death receptor complex.
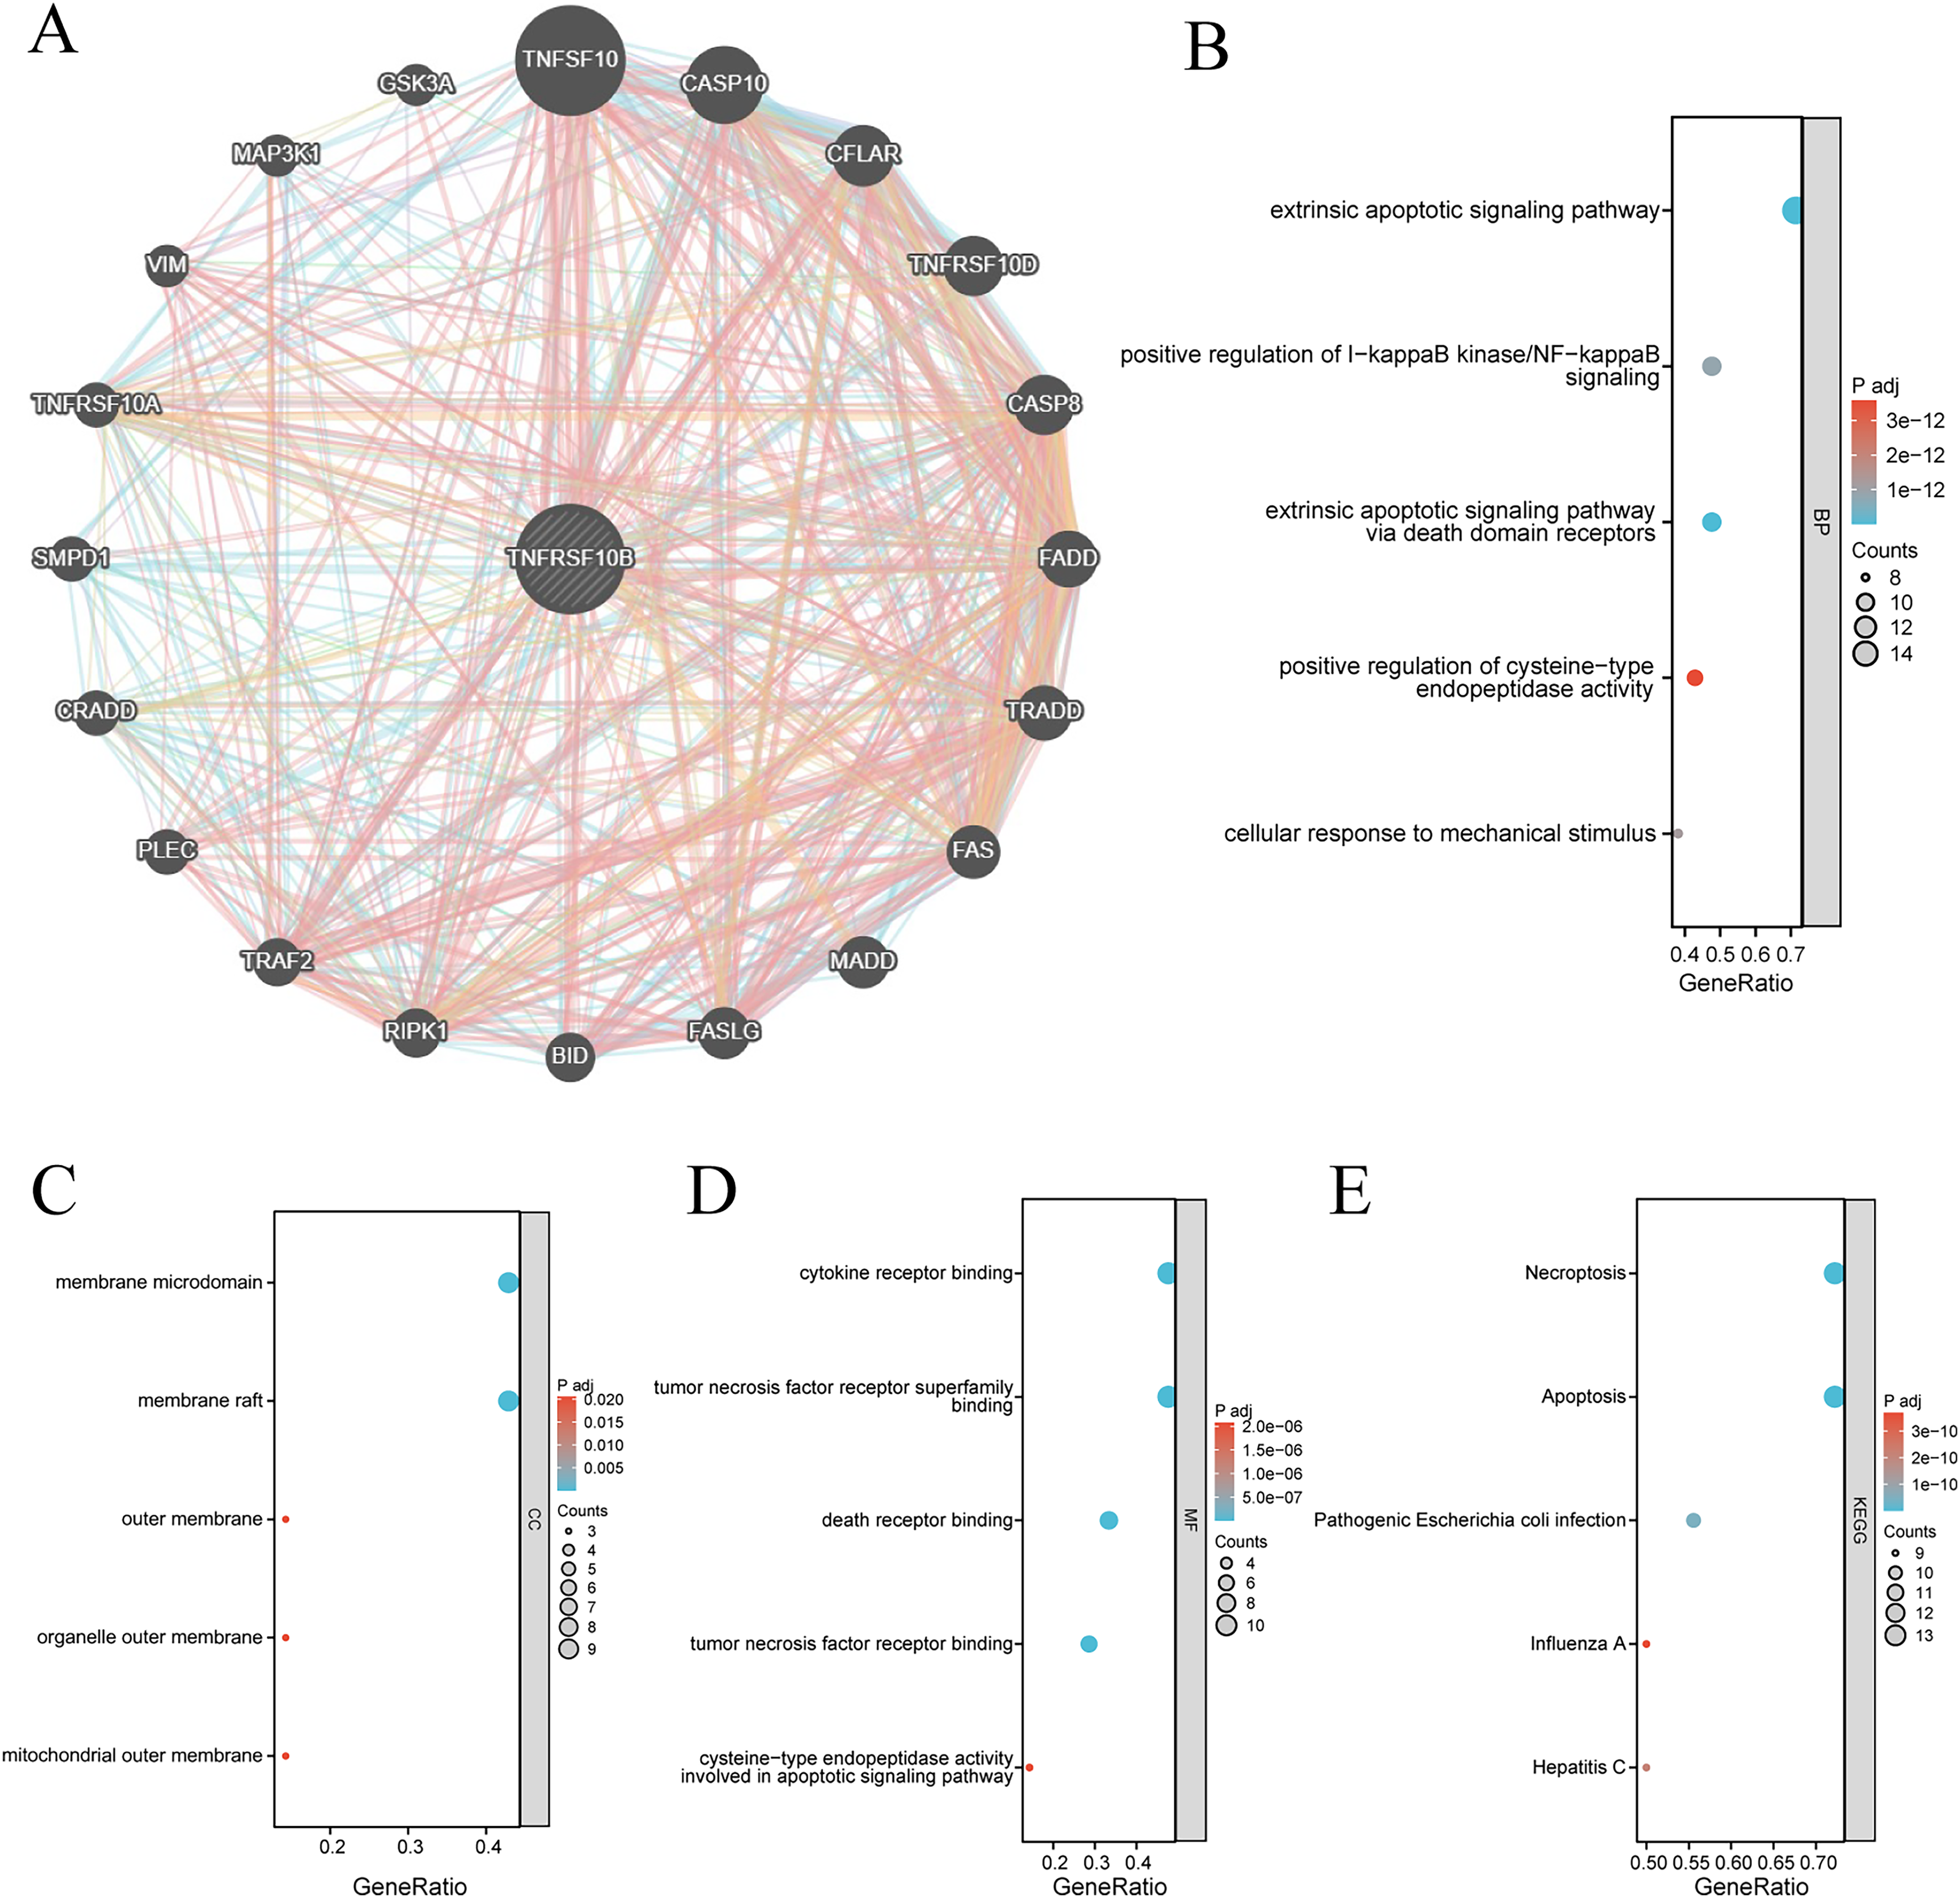
Functional annotation of TNFRSF10B-associated protein interaction network. (A) STRING-based PPI network of TNFRSF10B. (B-D) GO enrichment analysis, including BP, CC, MF. The top 5 most significantly enriched terms are displayed in each figure. (E) KEGG pathway enrichment. In enrichment analysis results, dot size represents the number of enriched genes (larger dots = more genes). Color gradient from blue to red corresponds to decreasing adj. P, with blue indicating smaller P-values and higher significance.
Differential Expression and Functional Validation of TNFRSF10B in OSCC
To validate the bioinformatics findings, the RT-qPCR and Western blot analyses were performed on clinical OSCC tissues and matched normal tissues. Results confirmed that TNFRSF10B mRNA (Figure 6A) and protein levels (Figure 6B) were markedly elevated in OSCC tissues (P < .001), thus corroborating its overexpression at both transcriptional and translational levels.

TNFRSF10B expression validation and functional characterization. (A–B) Detection of TNFRSF10B protein abundance by Western blot and its quantitative assessment. (C) RT-qPCR assessment of TNFRSF10B mRNA levels. (D–E) Protein changes in SCC-4 cells after TNFRSF10B silencing, examined by Western blot and quantified accordingly. (F) RT-qPCR detection of TNFRSF10B mRNA expression in SCC-4 cells. (G) Results of CCK-8 assay for cell viability following TNFRSF10B knockdown in SCC-4 cells, **P < .01, ***P < .001, compared with control groups (n = 3). (H-I) Protein expression patterns in SCC-9 cells following TNFRSF10B knockdown, analyzed and quantified by Western blot. (J) RT-qPCR measurement of TNFRSF10B transcript level in SCC-9 cells. (K) Results of CCK-8 assay for cell viability following TNFRSF10B knockdown in SCC-9 cells, **P < .01, ***P < .001, compared with control groups (n = 3).
To further investigate the biological function of TNFRSF10B, we synthesized two specific siRNAs targeting this gene, namely si-TNFRSF10B-1 and si-TNFRSF10B-2. Using a si-NC as the control, these siRNAs were transfected into two OSCC cell lines, SCC-4 and SCC-9, respectively. Then, the effect of TNFRSF10B on cellular viability was measured using CCK-8 assay. The results showed that in the SCC-4 cell line, knockdown of TNFRSF10B significantly inhibited cellular viability (P < .001, Figure 6C). Meanwhile, the RT-qPCR and Western blot analyses verified that both siRNAs effectively knocked down the expression of TNFRSF10B in SCC-4 cells (P < .01, Figure 6D and E), providing these two siRNAs as reliable tools for subsequent functional experiments. In the SCC-9 cell line, consistent results were obtained from the same experiments: CCK-8 assay showed that its viability was significantly inhibited (P < .001, Figure 6F), and the two validation assays also confirmed the effective knockdown of TNFRSF10B by the siRNAs in this cell line (P < .001, Figures 6G and H).
Influence of TNFRSF10B Silencing on Programmed Cell Death in OSCC
To further verify the pro-apoptotic function of TNFRSF10B suggested by enrichment analysis, we assessed apoptosis in SCC-4 and SCC-9 cell lines after TNFRSF10B suppression through Annexin V-FITC/PI flow cytometry and TUNEL detection.
Figure 7 shows that silencing of TNFRSF10B significantly increased the apoptotic rates in both SCC-4 and SCC-9 cells (P < .001). For SCC-4 cells, the mean apoptotic rate in the si-NC group was 7.13%, while those in the si-TNFRSF10B-1 and si-TNFRSF10B-2 groups, it was 22.52% and 23.31% respectively (Figure 7A). In SCC-9 cells, the mean apoptotic rate was 5.59% in the si-NC group, and 13.17% and 13.93% in the si-TNFRSF10B-1 and si-TNFRSF10B-2 groups respectively (Figure 7B).

Pro-apoptotic effects of TNFRSF10B knockdown in OSCC cells confirmed by flow cytometry and TUNEL staining. (A-B) Flow cytometry analysis and quantification of apoptosis in SCC-4 cells (A) and SCC-9 cells (B) following TNFRSF10B knockdown. (C-D) TUNEL staining-based quantification of apoptosis in SCC-4 cells. Scale bar: 200 μm; ***P < .001, compared with si-NC control (n = 3).
Moreover, in both cell lines, the proportion of early apoptosis cells (Annexin V+/PI−) was elevated. In SCC-4 cells, the Q2 value (representing early apoptosis) was 3.63 in the si-NC group, 16.0 in the si-TNFRSF10B-1 group, and 17.1 in the si-TNFRSF10B-2 group (Figure 7A). In SCC-9 cells, the Q2 value was 4.03 in the si-NC group, 11.1 in the si-TNFRSF10B-1 group, and 12.3 in the si-TNFRSF10B-2 group. These results indicates that TNFRSF10B knockdown promotes apoptosis initiation (Figure 7B).
In SCC-4 cells (Figure 7C), TUNEL staining showed that compared with the si-NC group, the number of blue-fluorescent cells in the si-TNFRSF10B-1 and si-TNFRSF10B-2 groups increased significantly, indicating an increase in the number of apoptotic cells (P < .001). In SCC-9 cells (Figure 7D), results similar to those in SCC-4 cells were observed. The number of apoptotic cells in the si-TNFRSF10B-1 and si-TNFRSF10B-2 groups was significantly higher than that of apoptotic cells in the si-NC group (P < .001).
Mechanistic Investigation of TNFRSF10B-Mediated Apoptosis Regulation
To clarify the apoptotic pathways influenced by TNFRSF10B in OSCC, key apoptosis regulators were quantified using Western blotting in SCC-4 and SCC-9 cell line models. Figure 8 illustrates that siRNA-mediated TNFRSF10B depletion significantly increased Bax levels while suppressing Bcl-2 expression (P < .001). As key regulators of mitochondrial outer membrane permeability, these changes in Bax and Bcl-2 disturbed mitochondrial apoptotic equilibrium. Furthermore, there was a marked increase in the levels of activated Caspase-3 and PARP fragmentation (P < .05), which are central players in the apoptotic pathway following the silencing of TNFRSF10B. Those results suggest significant activation of Caspase-3 and cleavage of PARP in these cells and confirm the initiation of irreversible apoptotic execution following TNFRSF10B knockdown.

TNFRSF10B knockdown reshapes apoptotic signaling by modulating core pathway proteins. (A-B) Caspase-3, PARP, Bcl-2, and Bax expression levels were assessed by western blotting in SCC-4 (A) and SCC-9 (B) cells. **P < .01, ***P < .001.
Discussion
Oral squamous cell carcinoma (OSCC), a prevalent malignancy of the head and neck, poses a significant threat to global health. Its pathogenesis involves complex genetic alterations and dysregulation of multiple signaling pathways. Currently, a lack of effective and precise therapeutic targets and diagnostic markers limits improvements in patient prognosis. Therefore, identifying molecular biomarkers closely associated with OSCC development is crucial for advancing its precision medicine framework. This study integrated multi-omics datasets and employed machine learning-based feature selection algorithms, identifying TNFRSF10B as a core gene regulating OSCC malignant progression.
Clinical analyses revealed significant overexpression of TNFRSF10B in OSCC tissues, which correlated positively with adverse patient survival outcomes. Validation via survival analysis and ROC curves demonstrated its strong predictive power for patient survival probability, with an AUC of 0.85. Its expression was also closely associated with key clinical prognostic parameters, including pathological stage, clinical TNM stage, and treatment response, indicating excellent prognostic and diagnostic potential. A comparative assessment with established biomarkers showed that the discriminatory efficacy of TNFRSF10B was comparable or superior to classic markers such as Circular RNAs, 21 and significantly higher than several traditional serum tumor markers like Cellular prion protein (PrPC). 22 These results confirm TNFRSF10B as a reliable prognostic indicator and a promising candidate for a highly specific and sensitive diagnostic molecular marker in OSCC.
Apoptosis, a fundamental mechanism of programmed cell death, is regulated through mitochondrial-mediated intrinsic and death receptor-mediated extrinsic pathways. 23 Dysregulation of apoptosis is a key driver of tumorigenesis, progression, and therapy resistance, making it a central focus in anticancer drug development. Our PPI network and functional enrichment analyses indicated that TNFRSF10B closely interacts with core apoptosis regulators and is primarily enriched in extrinsic apoptotic signaling pathways. Functional experiments further established TNFRSF10B as a key regulatory node of apoptosis in OSCC cells, where it promotes tumor progression by dynamically modulating the balance between extrinsic and intrinsic apoptotic pathways. Knockdown of TNFRSF10B significantly increased the apoptosis rate in OSCC cells. This was accompanied by activation of the extrinsic pathway, evidenced by elevated levels of Cleaved Caspase-3 and Cleaved PARP, and a shift in the intrinsic apoptotic balance, marked by increased expression of the pro-apoptotic protein Bax and decreased expression of the anti-apoptotic protein Bcl-2. These findings clearly delineate its core role in inhibiting apoptosis in OSCC.
TNFRSF10B, also known as DR5 or TRAIL-R2, is a well-characterized high-affinity receptor for TRAIL (TNF-related apoptosis-inducing ligand), and its prognostic value in various cancers is well-documented.24–26 Classically, ligand-bound TNFRSF10B initiates extrinsic apoptosis by recruiting FADD and Caspase-8. 27 The observed pro-apoptotic effect following its knockdown in our study appears paradoxical. This context-dependent effect may be explained by the unique tumor microenvironment (TME) of OSCC. Prior evidence suggests that TRAIL ligand scarcity or aberrant FADD phosphorylation in the OSCC TME can impair the canonical apoptotic signaling via TNFRSF10B. 28 Conversely, TNFRSF10B can also engage pro-survival pathways. For instance, through its C-terminal domain, it can recruit TRAF2/5 to activate transcription factors such as NF-κB. 29 Therefore, knockdown of TNFRSF10B may attenuate this NF-κB-mediated anti-apoptotic signaling, thereby shifting the cellular equilibrium toward apoptosis.30,31 This functional duality underscores the complexity of targeting TNFRSF10B in OSCC and highlights the necessity for therapeutic strategies that are carefully tailored to the specific tumor microenvironment.
Additionally, it must be considered that the signaling network downstream of TNFRSF10B is multifaceted, potentially engaging other key effectors such as NF-κB or MAPK pathways. These pathways can critically influence cell survival, inflammatory responses, and metastatic processes in a context-dependent manner. The present study was deliberately focused on validating the central role of TNFRSF10B in apoptotic regulation, a premise robustly indicated by our functional enrichment analysis. Consequently, future investigations are warranted to systematically elucidate the potential crosstalk between TNFRSF10B-mediated apoptosis and these alternative signaling cascades in driving OSCC progression and therapeutic resistance.
While this study elucidates a regulatory mechanism involving TNFRSF10B, several limitations warrant consideration. First, the clinical sample size was relatively small, largely due to stringent inclusion criteria and limited availability of matched tissue specimens. Second, the conclusions are primarily derived from in vitro models, which may not fully recapitulate the dynamic interactions and complexity of the in vivo tumor microenvironment. Therefore, further validation in animal models is needed. We also acknowledge that extrinsic apoptosis involves complex crosstalk among multiple pathways and precise spatiotemporal regulation. The function of TNFRSF10B is likely further modulated by heterogeneity within the tumor microenvironment and signaling differences across cellular subpopulations. Future studies should therefore focus on delineating the context-dependent role of TNFRSF10B in specific OSCC subtypes and microenvironmental niches, as well as mapping its complete upstream and downstream regulatory networks. These investigations will be critical for informing the rational development of targeted therapeutic strategies.
Conclusions
This study demonstrates that TNFRSF10B is overexpressed in OSCC and contributes to tumor progression by modulating cell viability and apoptosis. Bioinformatics analyses identified TNFRSF10B as a core gene associated with advanced disease, and its elevated expression correlated with poorer prognosis and treatment resistance in clinical cohorts. Experimental validation confirmed its upregulation in OSCC tissues, and functional studies showed that TNFRSF10B knockdown suppressed proliferation and induced apoptosis in OSCC cell lines, potentially through regulation of the Bax/Bcl-2 ratio and activation of Caspase-3/PARP signaling. These findings implicate TNFRSF10B in OSCC pathogenesis and suggest its potential as a diagnostic marker and therapeutic target. However, limitations such as sample size and the lack of in vivo validation warrant further investigation. Future studies should include larger cohorts, mechanistic dissection of TNFRSF10B signaling, and preclinical in vivo models to assess its translational relevance.
Footnotes
Acknowledgments
Not applicable.
Ethics Approval
This study was conducted in accordance with the Declaration of Helsinki and approved by the Medical Ethics Committee of the Fourth Hospital of Hebei Medical University (Approval No.:2021KY197). Written informed consent was obtained from all participating patients prior to their inclusion in the research project.
Consent to Participate
Informed consent was obtained from all individual participants included in the study.
Author Contribution
All authors contributed to the study conception and design. Material preparation, data collection, and analysis were performed by Yingshun YANG, Zhizheng ZHUANG, and Yan HU. The first draft of the manuscript was written by Yingshun YANG and Zhizheng ZHUANG, and all authors (Yan HU, Jie GUO, Jilun LIU, Linyu JIN, Yongle QIU) commented on previous versions of the manuscript. Zhizheng ZHUANG acquired funding and Yongle QIU supervised the project and acquired funding. All authors read and approved the final manuscript.
Funding
The authors disclosed receipt of the following financial support for the research, authorship, and/or publication of this article: This study was supported by the Hebei Natural Science Foundation (grant number H2024206476) and Medical Science Research Project of Hebei (grant number 20240887).
Declaration of Conflicting Interests
The authors declared no potential conflicts of interest with respect to the research, authorship, and/or publication of this article.
Data Availability Statement
The original contributions presented in the study are included in the article, further inquiries can be directed to the corresponding author.