
Abstract
Introduction
Radiation therapy for head and neck squamous cell carcinoma is constrained by radiotoxicity to normal tissue. We demonstrate 100 nm theranostic nanoparticles for image-guided radiation therapy planning and enhancement in rat head and neck squamous cell carcinoma models.
Methods
PEG conjugated theranostic nanoparticles comprising of Au nanorods coated with Gadolinium oxide layers were tested for radiation therapy enhancement in 2D cultures of OSC-19-GFP-luc cells, and orthotopic tongue xenografts in male immunocompromised Salt sensitive or SS rats via both intratumoral and intravenous delivery. The radiation therapy enhancement mechanism was investigated.
Results
Theranostic nanoparticles demonstrated both X-ray/magnetic resonance contrast in a dose-dependent manner. Magnetic resonance images depicted optimal tumor-to-background uptake at 4 h post injection. Theranostic nanoparticle + Radiation treated rats experienced reduced tumor growth compared to controls, and reduction in lung metastasis.
Conclusions
Theranostic nanoparticles enable preprocedure radiotherapy planning, as well as enhance radiation treatment efficacy for head and neck tumors.
Introduction
Head and neck squamous cell carcinomas (HNSCC) are the sixth most common cancer globally with a high mortality rate of 40% to 50%. 1 Among all HNSCC, oral squamous cell carcinoma (OSCC) is one of the most common cancers in the world.1,2 Oral squamous cell carcinoma develops from the epithelium of the oral cavity, including tongue, lips, and floor of the mouth, cheeks, hard palate, or other unspecified parts of the mouth. Surgical resection and radiotherapy are the 2 most frequently used therapeutic modalities to treat early-stage tumors in head and neck cancer. 3 Radiotherapy is more frequently offered in early-stage OSCC as it helps in the preservation of critical organs such as larynx and tongue, 4 but for advanced tumors, surgery followed by adjuvant chemo and/or radiotherapy provides a significant survival advantage. 5 Despite recent advances in surgery, radiotherapy, and chemotherapy, OSCC continues to have a poor prognosis, with a 5-year disease-free survival of approximately 50%. 6 There is a critical need for improved therapy for locally advanced as well as recurrent and metastatic HNSCC-bearing population.
Radiotherapy (RT) is one of the most important and effective local therapy methods and almost all solid cancer patients are treated with radiotherapy alone or in combination with other therapies. 7 Radiation therapy techniques are also combined with a range of imaging methods with an aim to have precisely focused treatment of tumor which can increase the dose in the tumor and minimize toxicity to the healthy tissues. 8 This precise treatment is even more important in the head and neck region as many functionally important normal organs are involved and any adverse effect on these tissues severely affects the quality of patient's life after treatment. The most reported complications after treatment include mucosal damage (mucositis), effect on bone integrity, and change of the salivary gland function 9 dysgeusia (up to 76%), oral fungal infection (39.1% during the treatment), dental disease (around 28%), and trismus (up to 30.7%).10‐13
Nanotechnology offers an alternative to enhance the dose of radiation in the tumor region by using radiosensitizing nanoparticles. The high Z-element-based nanoparticles (eg, Au, Bi, Hf, Gd) have been explored in various tumors to enhance the therapeutic efficiency of X-ray RT.14‐18,19‐22 Apart from the physical processes such as enhanced photoelectric effect, Compton scattering, Auger electron emission, and pair production, nanoparticles also enhance the biochemical effect of radiation on tumor cells.22‐27 Recently, magnetic resonance (MR) image-guided RT planning systems have been introduced for clinical treatment. Magnetic resonance imaging allows real-time delineation of soft tissue malignancies for specific radiation dose planning. Magnetic resonance imaging integrated with linear accelerator radiation beam therapy (MR-LINAC) is a very effective way to image and treat soft tissue tumors. This method reduces the damage to organs by increasing the accuracy and improving the outcome of RT.28‐31 Magnetic resonance imaging integrated with linear accelerator radiation beam therapy is limited by imaging quality and RT sensitivity, thus theranostic nanoparticles (TNPs) for simultaneous MR imaging and radio sensitization can improve solid tumor RT efficacy.32,33 In this work, we report the RT enhancement potential for MR contrast bearing Gold-based TNPs demonstrated for photothermal ablation and validated for clearance and safety in prior in vivo studies. 34 These nanoparticles have NIR plasmon-resonant core (gold nanorods [GNRs]) and a Gd (III) inorganic layer to provide MR contrast (Figure 1A) as the shell which has been tested for in vivo stability, biocompatibility, and photothermal efficacy in previous studies for liver metastasis. 34 These nontoxic nanoparticles have sufficient circulation half-life to allow for EPR effect-based tumor deposition after intravenous or portal vein delivery. 34 However, photothermal therapy is not suited for local treatment of oral cavity tumors due to morbidity concerns, and this motivates the exploration of nanoparticle-enhanced RT efficacy with these theranostic GNRs. The role of MR and X-ray contrast-bearing theranostic constructs as image-guided RT enhancers for HNSCC has not been sufficiently studied in clinically relevant orthotopic models. While RT-enhancing agents as radiosensitive nanomaterials have been proposed in the past decades to increase the sensitivity of radiotherapy and reduce off-target effects, just a few clinical agents are approved for targeted therapy of HNSCC. Tai et al have reported the cyclin-dependent kinase 4/6 inhibitor LEE011 for enhanced the effect of RT in OML-1 and OML-1-R cells. 35 Nanomaterials reported such as NBTXR3 are under clinical investigation and have demonstrated substantial effect in HNSCC patients.36,37 Despite the advances in design and fabrication of innovative nanomaterial as radiotherapy enhancing agents for HNSCC treatment, multiple challenges must be addressed, including the biosafety and biocompatibility of nanomaterial, shape, and size parameters for biodistribution, and material control challenges for scalable production of nanomaterials, and optimal designed of image-guided therapies. In this study, we demonstrate that proposed TNPs have strong potential as cross-sectional imaging contrast and radiation dose-enhancing agents for HNSCC. Our studies indicate that ROS markers and DNA damage are significantly higher in radiation + TNPs group of cells compared to just radiation group. Our in vivo studies after a single TNP + RT treatment indicate robust tumor growth control with both intratumoral and intravenous delivery of TNPs. In RT with intertumoral injection of TNPs, there was complete tumor remission in 3 out of 6 cases compared to zero cases in Saline + radiation (control) group. The remission occurred in 4 out of 5 cases after RT following intravenous delivery of TNPs compared to zero cases in control groups. Importantly, we observed significant control of tumor metastasis in TNP + RT treated animals in this model of aggressive HNSCC. Both computerized tomography (CT) and MR imaging of nanoparticles was demonstrated following intratumoral and intravenous delivery, respectively, thus indicating the utility of these particles for designing future image-guided therapy protocols.
Materials and Methods
Synthesis and Characterization of NPs
Theranostic nanoparticles were composed of NIR plasmon-resonant GNRs core and a Gd (III) inorganic layer as the shell. Au core was first synthesized using a seed-mediated growth process 34 followed by sodium oleate coating at 80 °C for 1 h. Theranostic nanoparticles were prepared by growing a Gd (III) shell on NIR-resonant GNR−NaOA via the following sequence of steps: 150 mL of GNR-NaOA (1011 NP/mL) was added to 450 mL of distilled water and vortexed. Then, 1.5 mL of 0.1 M Hexamethylenetetramine (>99%, Sigma-Aldrich) and 4.5 mL of Gd (III)-nitrate precursor with Yb/Er = 18:2% ratio (0.01 M, 99.9%, Aldrich) was added, vortexed, and sonicated for 30 min using a sonication probe. The resulting solution was heated at 120 °C for 3 h and then cooled to room temperature. The TNPs were left undisturbed overnight, and the transparent supernatant was carefully removed. Theranostic nanoparticles were surface functionalized with –NH2. To do this 100 μL of 10% APTES was added, and the mixture was vortexed for 3 min, followed by heating the solvent at 80 °C for 12 h. Excess APTES was removed by centrifugation. Amine-functionalized TNPs (TNP-NH2) were then conjugated with mPEG5k-COOH to obtain a near-neutral surface charge.34,38 Theranostic nanoparticles have both X-ray (due to GNR core) and MR contrast (due to Gd (III) coating) and NIR resonance (Figure 1A and B). Theranostic nanoparticles were calibrated for X-ray contrast at 60 kV on a Pxinc's X-RAD SmART scanner using a cone beam CT. 34 Magnetic resonance contrast was determined on a Bruker 9.4 T small animal and GE 7 T human scanners. 34 The r1 relaxivity of The TNP is 1.1×10⁸ mM−1s−1 in terms of TNPs and it was determined by the calibration procedure described in citation. 34 The r1 relaxivity in terms of TNP concentration is approximately equivalent to ∼98.6 mM−1s−1 in terms of equivalent Gd3 + concentration as determined by assessment of Gd3 + shell layer morphology by TEM, and detailed STEM-EDS (electron dispersion X-ray spectroscopy) methods for determining Gd3 + distribution in nanoparticles as reported previously in citation. 34 TEM imaging was performed on a drop of colloidal TNPs using a HITACHI H-600 TEM operating at an acceleration voltage of 70 kV with a Hitachi HD-2300 dual EDS cryo-STEM (Hitachi) at an acceleration voltage of 200 kV. The absorption spectra of TNPs were measured using an Infinite 200 PRO (Tecan) spectrophotometer (Figure 1B). The hydrodynamic size via dynamic light scattering and ζ potential of TNPs were measured using a Malvern Zetasizer Nano ZS (Malvern Instruments) operated at 25 °C. The average TNP physical size was 75 nm (Figure 1A), hydrodynamic diameter was 235 nm (Figure 1C), and zeta potential ∼7.5 mV (Figure 1D) indicating long systemic circulation potential. Hydrodynamic size is larger because of TNP charge and PEGylation.

The theranostic nanoparticle (TNP) synthesis and characterization. (A) The TEM image of Gd (III) oxide-coated Au nanorods, (B) the optical properties of TNPs, (C) the hydrodynamic size, and (D) zeta potential of TNPs.
Cell Culture and Oral Cancer Xenografts
Authenticated GFP
These Luciferase-expressing cells (2 × 10⁶) were orthotopically implanted into the tongue of 4- to 6-week-old male salt-sensitive and immunocompromised (SSIL2Rγ−) rats. Rats were purchased from the Rat Research Models Service Center at the Medical College of Wisconsin. (https://www.mcw.edu/departments/genomic-sciences-and-precision-medicine-center-gspmc/about-us/what-we-do/research/rat-research-model-service-center). To maintain consistency in rat weight and avoid sex-based pharmacokinetic differences, the experiments were restricted to male rats. Tumors were treated after 10 days of implantation at an approximate size of 50 mm3, which was consistent across all rats. Tumor growth was monitored by in vivo bioluminescence imaging. All rats were provided reverse osmosis hyperchlorinated water ad libitum. All animal studies were performed on anesthetized animals. To induce anesthesia, the animal was placed in a transparent induction chamber. Isoflurane was delivered to the chamber via a precision vaporizer and compressed O2. For induction, the percentage of isoflurane was up to 5%. Once the animal was unconscious, it was removed from the chamber. The unconscious animal was then placed on a warm surface and fitted with a nose cone attached to the vaporizer in the presence of a scavenging system and oxygen source. At this point, the isoflurane concentration was reduced to that level which maintained the proper plane of anesthesia; typically, between 0.5% and 3%. Following the termination of experiment, or when other animal protocol criteria justified, rats were euthanized. Rats were placed in an approved euthanasia chamber, exposed to CO2 from a compressed gas cylinder until animal was no longer breathing. To ensure death, in rats weighing more than 200 g, a pneumothorax via thoracotomy was created; for rats weighing less than 200 g, a pneumothorax was created, or a cervical dislocation was performed.
In Vitro RT Sensitivity Experiments
Oral squamous cancer-19 (OSC-19) cells were incubated with/without TNPs (1 × 10¹¹ TNPs/mL) for 12 h, then washed, supplemented with fresh media, and irradiated with 4 and 6 Gy with an X-ray generator at 130 kVp and 5 mA with a 0.5 mm Aluminium filter and dose rate of 1.904 Gy/min at radiation dose of 2, 4, 6, and 8 Gy. After 5 h and 24 h, cells were fixed with 4% vol/vol formaldehyde for 15 min at room temperature and then washed twice with PBS. Cells were permeabilized with 0.3% triton-X-100 for 20 min. Cells were blocked with 1% BSA for 1 h, RT. The cells were incubated overnight at 4 °C with FITC conjugated Anti-phospho-Histone H2A.X (Ser139) staining (Millipore Sigma, Catalogue#16-202A), then washed 3 times with PBS. Slides were mounted with DAPI (Vector Laboratories, Inc.). Fluorescence microscopy images were processed to visualize the foci. The DNA damage induced by the radiation with/without TNPs was determined by counting the number of cells with γ-H2AX foci.
In Vitro Annexin V Apoptosis Assay
Oral squamous cancer-19 cells were seeded in the 6-well plates overnight and treated with/without TNPs (2 × 10¹¹ TNPs/mL) for 12 h. The nontreated cells were treated with an equal volume of vehicle solvent (1×PBS). After 12 h, cells were washed 2 times with 1×PBS and supplemented with fresh media, and irradiated with 24, 6, and 8 Gy 300 kV beams. After 5 h and 24 h, cells were lifted and washed with 1× Annexin V binding buffer (provided in the kit). Cells were stained with Annexin V as per the method provided by the manufacturer (BD Pharmingen™ PE Annexin V Apoptosis Detection Kit I, Cat# 559763). After staining, Annexin V + apoptotic cells were acquired on a MACSQuant 10 Analyzer Flow Cytometer (Miltenyi) and analyzed using FlowJo software version 10.0 (BD Life Sciences). Single-color tubes were used to set up a compensation matrix, and an IgG control for Annexin V fluorophore was included to ensure specific Annexin V staining.
In Vitro ROS Assay
Oral squamous cancer-19 cells were seeded in the 6-well plates overnight and treated with/without TNPs (2 × 10¹¹ TNPs/mL) for 12 h. The nontreated cells were treated with an equal volume of vehicle solvent (1×PBS). After 12 h, cells were washed 2 times with 1XPBS and supplemented with fresh media, and irradiated with 24, 6, and 8 Gy 300 kV beams. After 40 min, cells were lifted and washed with 1X cell staining media (1×PBS + 2%FBS). ROS levels were quantified using the CellROX deep red Reagent (#C10491, Thermo Fisher Scientific) per manufacturer instructions and optimized in the previously published study. 40 FACS files were analyzed using FlowJo software version 10.0 (BD Life Sciences). Required positive and negative controls (provided in the kit) were used to gate the specific populations.
Magnetic Resonance Imaging
Magnetic resonance contrast of TNPs was determined in vivo on a Bruker 9.4 T small animal by 2D FLASH (Fast Low Angle Shot)-spoiled Gradient Echo pulse sequence and with 30-degree flip angle, 3-millisecond Echo Time (TE), and 100-millisecond Repetition Time (TR). After 10 days of tumor implantation, 4 SSIL2Rγ− rats were injected with 1 μL/g (weight of the animal) of 1013 TNPs/mL. Theranostic nanoparticles were injected via tail vein. Four and 24 h after injection, the biodistribution of nanoparticles in tumor was verified via imaging on the Bruker 9.4 T small animal scanner.
Computerized Tomography Scan and RT
Theranostic nanoparticles were tested for X-ray contrast at 60 kV on a Pxinc's X-RAD SmART scanner using a cone beam CT. After 10 days of tumor implantation, animals were anesthetized with 1% to 3% isoflurane for the duration of each procedure (imaging and irradiation). Similar to the clinical workflow, a cone beam computed tomography (CBCT) was performed on each rat to delineate tumor and determine the radiation beam arrangement (60 kV, 1.5 mA). Treatment was performed using a 12-mm circular collimator (220 kVp, 13 mA). The radiation dose was delivered in one fraction of 8 Gy by 2 beams at 36° and 144° angles. The efficacy of TNPs in enhancing RT response was tested via both intratumoral (1 × 10¹⁴ TNPs/mL) and systemic (tail vein) delivery (1 μL/g of 1 × 10¹³ TNPs/mL concentration). Rats bearing tumors were randomized to saline + radiation (n = 4), TNP + radiation (n = 5) groups, and controls with only TNPs (n = 3) and with no treatment (n = 3) groups. These numbers were decided a priori based on previously reported TNP + photothermal therapy response in human xenograft tumors while comparing Saline + Laser versus TNP + Laser treatment in immunocompromised rats. 38 For type I error level not exceeding 0.05, with at least 80% statistical power, using n = 4 (Saline + Radiation) and n = 5 (TNP + Radiation) for treatment arm, we expected to be able to detect 80% or larger tumor growth inhibition (TGI) differences between treatment groups. 8-Gy single dose radiation under CT guidance was provided 10 min post injection for intratumoral delivery, and 4-h post tail vein injection for systemic delivery. Rats were followed via bioluminescence imaging for 4 weeks.
Histopathology
Four weeks after radiation treatment, lungs of the animals were harvested and fixed in formalin followed by paraffin embedding. Thin tumor sections of ∼4 μm were cut, and the tissue sections were counterstained for anti-human mitochondrial antibody (Millipore Sigma) for metastasis. Tumors from animals intravenously injected with TNPs and after MRI were excised, washed in PBS, frozen sectioned, and immunostained with antibody against blood vessel marker, CD31 (BD Biosciences) and blood vessel marker, CD31 (BD Biosciences). NPs are visualized due to enhanced light scattering properties of Au. The illuminated signals from each dark field image were merged with a fluorescence image of blood vessels from the same field of view to determine NPs distribution.
Another set of animals with no treatment, TNPs + radiation and saline + radiation group (n = 3 in each group) were irradiated 4 h after intravenous injection of the TNPs or saline, following the same procedure as in the study to determine radioenhancing effect of nanoparticles. The tumors were harvested 1 h after irradiation and fixed in formalin followed by paraffin embedding. Thin tumor sections of ∼4 μm were cut and the tissue sections were counterstained for H&E staining and Anti-phospho-Histone H2A.X (Ser139) staining (Millipore Sigma). Images were analyzed using Nikon Eclipse E600 fluorescent microscope with a 20× and 40× objective.
Image Processing and Statistical Analysis
Data processing was performed in MATLAB (MATLAB 2021a, Mathworks) software with Image Processing Toolbox and custom scripts. Microscopic Image Analysis was performed with ImageJ software. For all the reported parameters and measurements, linear model regression was performed via customized scripts in the statistical language “R” with appropriate covariates. The linear regression output was analyzed with 2-way ANOVA and P values were generated for significance measurements. Pairwise post hoc comparison with Tukey test was performed to identify which specific group pairs differed significantly. The significance P value was denoted by codes: ****<.0001, ***<.001, **<.01, *<.05. The data are plotted as augmented Box and Whisker plots, with all data points shown. Cohen's d effect sizes were presented to compare irradiated and nonirradiated groups. For all statistical studies, a consistent and rigorous statistical strategy was employed. While the data corresponding to control groups were normally distributed, the results for radiated groups or cases with TNPs included were often non-normally distributed, thus a robust method was chosen to test for significance. We also avoided strategies such as log-normalization. The reporting of this study conforms to ARRIVE 2.0 guidelines. 41
Results
Radiosensitization Potential of TNPs in Vitro
The radiosensitization potential of TNPs on head and neck cancer was determined on OSC-19 cell line. Oral squamous cancer-19 cells were incubated with TNPs (1 × 10¹¹ TNPs/mL) for 2, 4, 8, and 12 h. The internalized TNPs appear illuminated under dark field due to enhanced scattering of light.42,43 Zeiss Axioimager Z1 with aioxam HRC camera with Apo 20X/0.8 lens was used for dark field and DAPI imaging. Data were collected by axiovision software. To ensure the capture of TNPs, a 1 × 10¹¹ NP/mL of TNP solution in PBS was used for calibration and the exposure time was adjusted (50 ms). Then TNP uptake by cells was imaged with cells containing TNPs with dark field and DAPI imaging. We made a computational model to sample the number of TNP clusters and their distribution with respect to cells. The nanoparticles were endocytosed and the number of TNPs inside the cells increased with time (4-12 h). At 12 h TNPs appear as bright clusters inside the cell (Figure 2A). Based on this analysis, 12 h of incubation time with 1 × 10¹¹ TNPs/mL concentration was selected as optimal parameters for all in vitro experiments. The Annexin V+ apoptosis assay confirmed that in the absence of radiation, TNPs had no toxic effect as survival fractions of control and TNPs treated cells. A significant decrease in cell survival is obtained when TNPs and radiation are combined (Figure 3A and B). Annexin V+ apoptotic cells acquisition suggests that there is a significant increase in these cells in TNP-treated cells, compared with nontreated cells for both 5 h and 24 h post-radiation. For 2 Gy and 5 h post-radiation, the apoptotic cell percentage is 8.63 [CL: 7.58-9.67] for nontreated cells and 24.23 [CL: 20.4-28.06] for TNP-treated cells. For 24 h post-radiation, it is 8.19 [CL: 5.73-10.65] for nontreated cells, and 22.33 [CL: 21.21-23.45] for TNP-treated cells. For 4 Gy and 5 h post-radiation, the apoptotic cell percentage is 8.27 [CL: 7.10-9.44] for nontreated cells, and 24.33 [CL: 22.24-26.42] for TNP-treated cells. For 24 h post-radiation, the apoptotic cell percentage is 9.6 [CL: 6.02-13.18] for nontreated, and 28.73 [CL: 27.39-30.07] for TNP-treated cells. For 6 Gy and 5 h post-radiation, the apoptotic cell percentage is 14. 87 [CL: 10.10-19.64] for nontreated cells, and 32.70 [CL: 31.63-33.77] for TNP-treated cells. For 24 h post-radiation, the apoptotic cell percentage is 11.26 [CL: 8.08-14.44] for nontreated, and 43.93 [CL: 43.51-44.35] for TNP-treated cells. For 8 Gy and 5 h post-radiation, the apoptotic cell percentage is 12.93 [CL: 12.41-13.45] for nontreated cells, and 28.82 [CL: 21.82-35.83] for TNP-treated cells. For 24 h post radiation, the apoptotic cell percentage is 14.00 [CL: 10.94-17.05] for nontreated, and 52.20 [CL: 46.83-57.57] for TNP-treated cells. Results represent significant differences in the absence and presence of TNPs at both time points in a dose-dependent manner (Figure 3A and B).
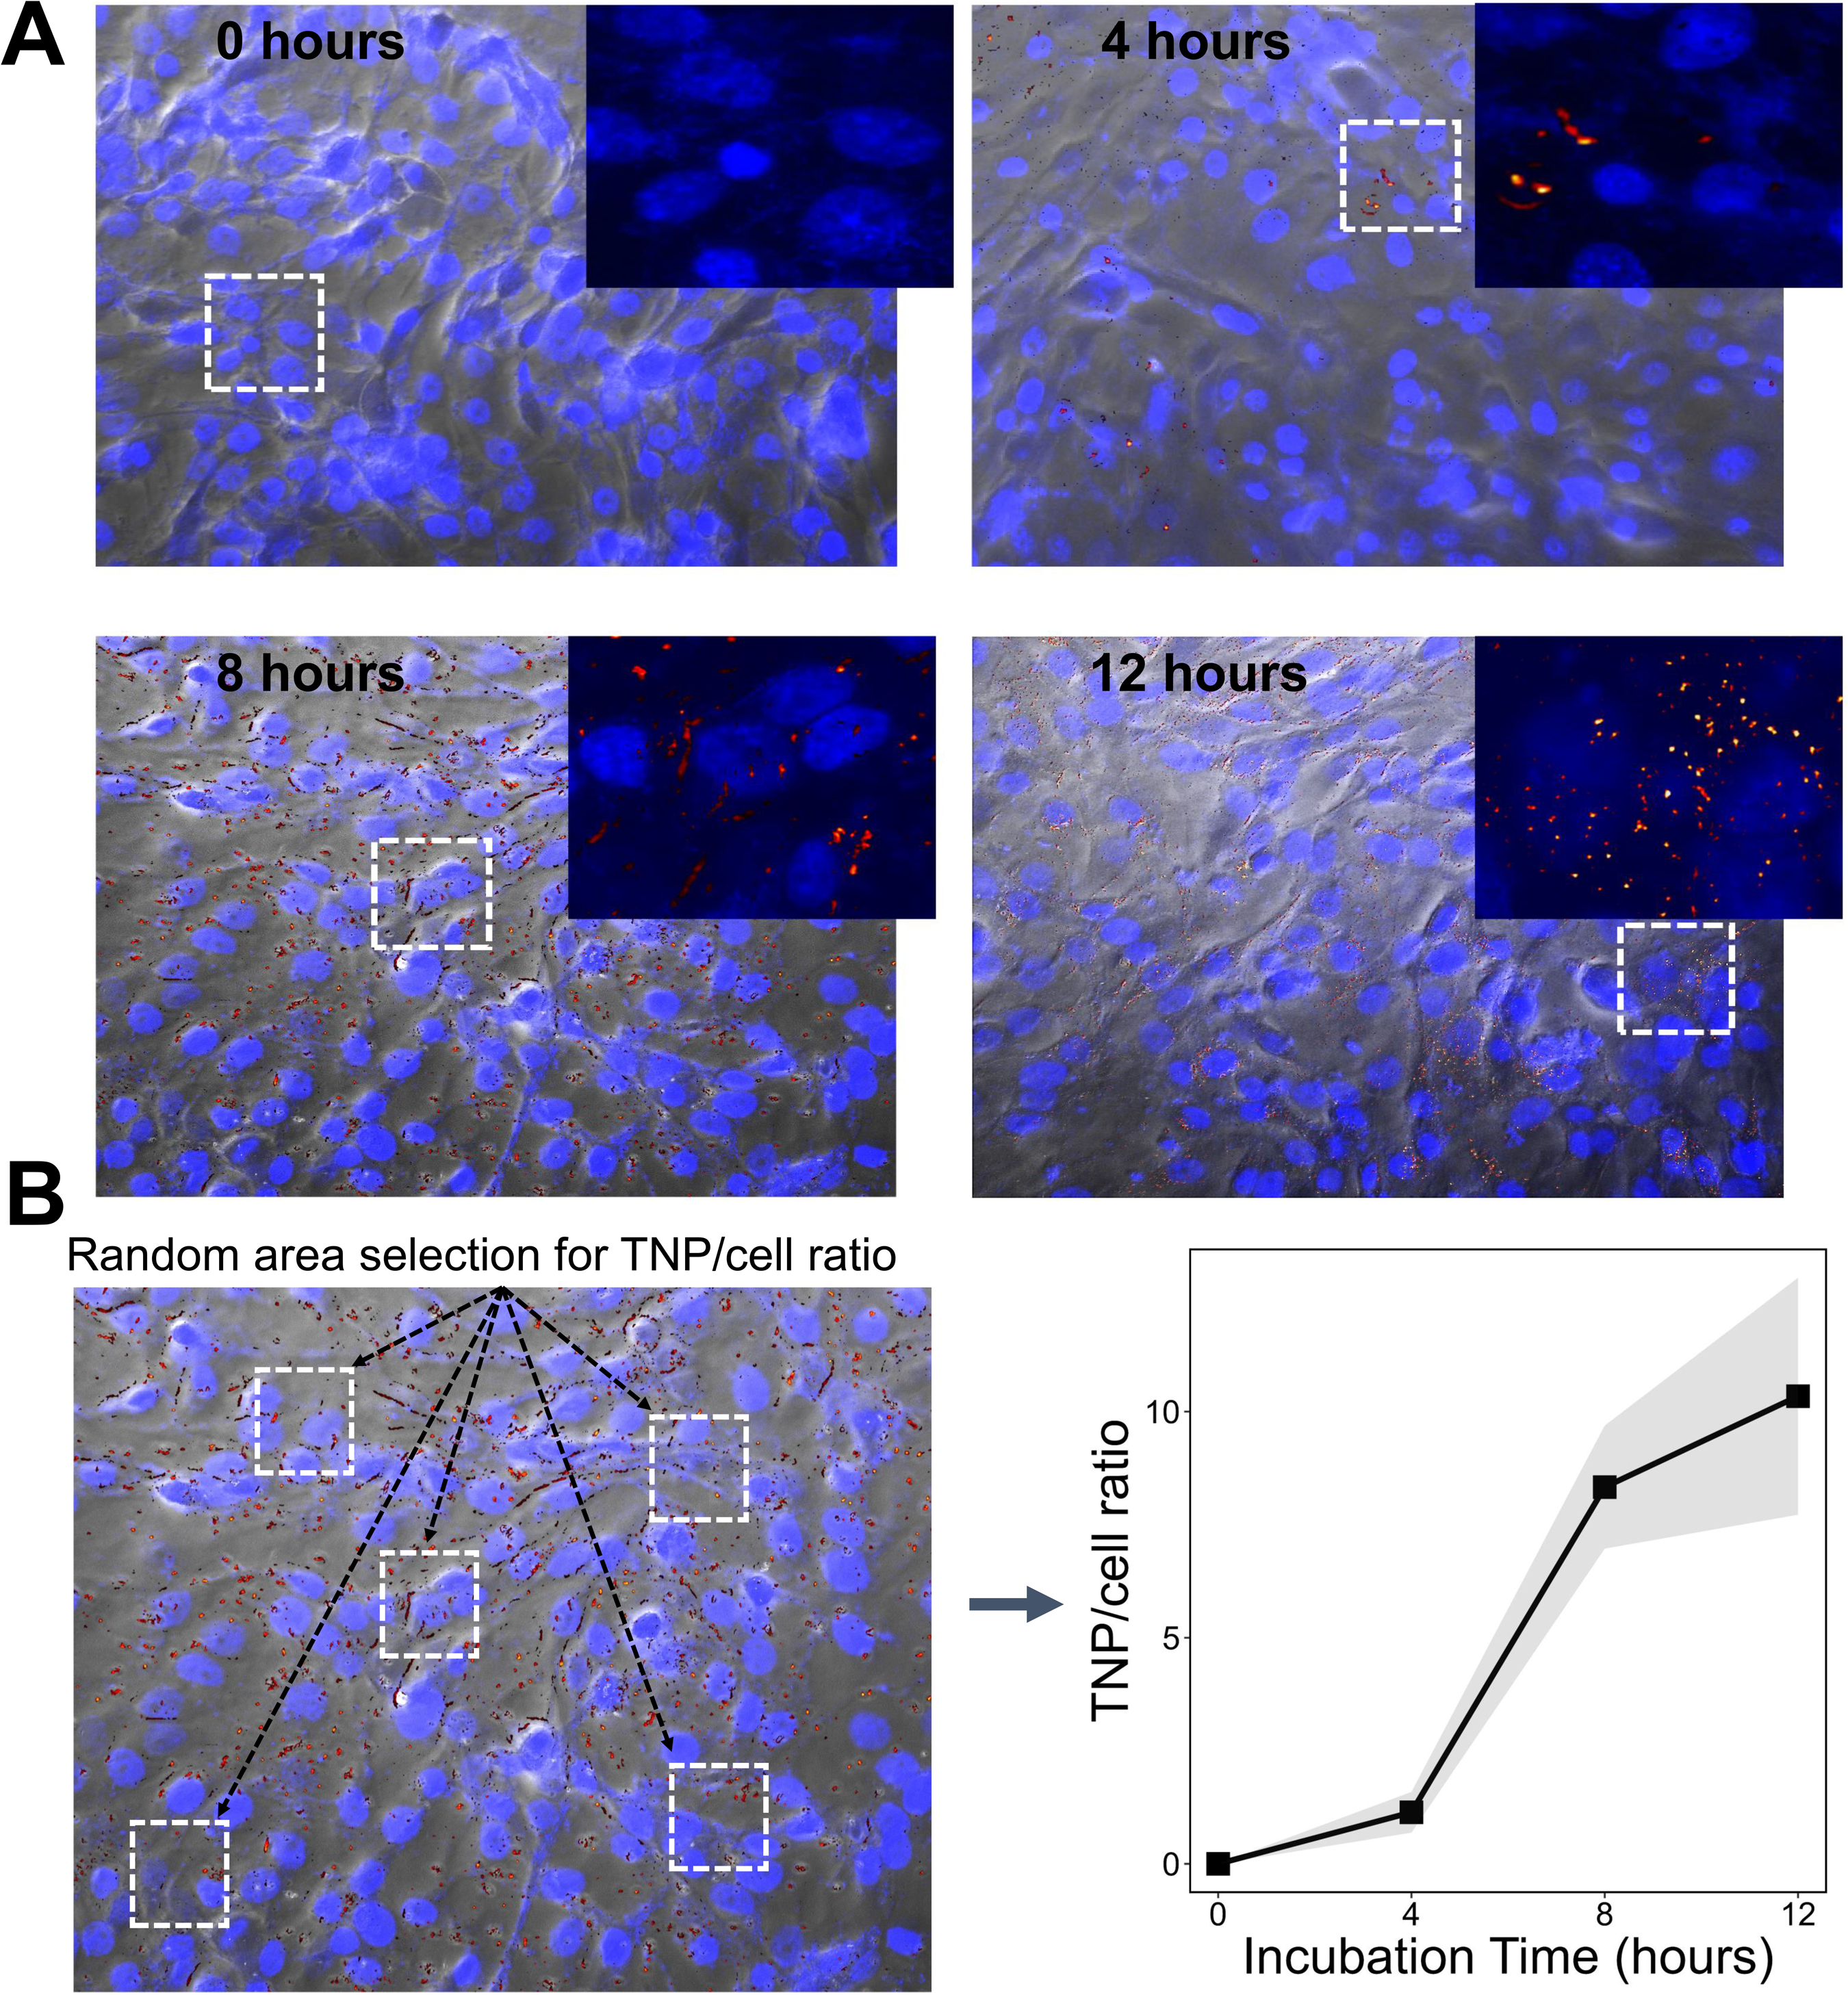
The theranostic nanoparticle (TNP) distribution pattern. (A) Distribution pattern of TNPs in oral squamous cancer-19 (OSC-19) cells. OSC-19 cells were incubated with TNPs (1 × 10¹¹) for 4, 8, and 12 h; 0 h time point indicates the control with no TNPs. The internalized TNPs were detected by dark field. The number of TNPs inside the cells appears as bright spots due to scattering of light, increased with incubation time (4-12 h). At 12 h TNPs appear as bright clusters inside the cell. (B) The quantitative evaluation of TNP uptake by cells. Ten different areas randomly were chosen and the number of cells and TNP clusters were calculated to find TNP cluster to number of cells ratio.

Annexin V apoptosis assay. The Annexin V assay shows the dose-dependent effect of radiation with/without theranostic nanoparticles (TNPs) for 5 h (A) and 24 h (B) after radiation. Oral squamous cancer-19 (OSC-19) cells were incubated with medium (control), medium containing TNPs (1 × 10¹¹) for 12 h and then replaced with fresh media and exposed to different doses 300 kV of X-rays in vitro.
The elevated endogenous ROS is mainly generated through the activation of various cellular oxidoreductases which reside in the mitochondria and excess ROS generation can result in mitochondrial dysfunction, which in turn can further lead to an increase in ROS formation. The increased ROS can result in a change in mitochondrial membrane potential. This change in mitochondrial potential was detected with cationic fluorophore TMRM. The fluorescent decrease of TMRM was effectively detected in radiated cells as compared to nonradiated cells (Figure 4A). A box plot summarizing the integrated intensity of cells expressing TMRM in all conditions is shown in Figure 4C. Although the decrease in mitochondrial membrane potential was more in TNPs + radiated cells as compared to only radiated cells, the difference was significantly different at 6 Gy (Figure 4C) (P < .01). There is a small effect size in nonradiated groups between with and without TNP subgroups (effect size: 0.41, without TNPs [CL: 25.35-36.77], and with TNPs [CL: 25.21-33.12]). However, the effect sizes are larger between these subgroups in irradiated groups (both 4 and 6 Gy), effect size = 2.43, and 2.9, respectively. 4 Gy without TNPs [CL: 22.73-35.4], 4 Gy with TNPs [CL: 22.02-25.60], 6 Gy without TNPs [CL: 13.45-21.20], and 6 Gy with TNPs [CL: 5.31-10.80]). The induction of DNA-double stranded breaks in OSC-19 cells was determined by γ-H2AX staining at 5 h and 24 h. The density of γ-H2AX radiation-induced foci formation is highest in the TNPs + radiated cells at 5 h (Figure 4D). Distinct quantitative variations were found in the TNPs + radiation treated versus only radiation-treated cells at 4 Gy (P < .01, effect size = 5.1, without TNPs [CL: 10.53-13.55], and with TNPs [CL: 20.21-55.91]) and 6 Gy (P < .001, effect size = 2.94, without TNPs [CL: −10.31 to 49.57], and with TNPs [CL: 31.70-65.06]) (Figure 4D). The density of γ-H2AX radiation-induced foci formation is higher in the TNPs + radiated cells at 24 h but the difference is not significant (Supplemental Figure 2).

Effect of theranostic nanoparticles (TNPs) on mitochondrial membrane potential and DNA damage. (A) The oral squamous cancer-19 (OSC-19) cells were incubated with/without TNPs for 12 h and then irradiated with X-rays. After 2 h of incubation, all 4 groups were stained with TMRM and Mitotracker, and images were acquired. (B) Qualitative and quantitative evaluation of DNA double-strand breaks as determined by γ-H2AX assay. OSC-19 cells were incubated with/without TNPs for 12 h and then irradiated with X-rays. γ-H2AX foci expression is TNPs + radiated and radiated cells detected after 5 h. (C) Relative fluorescence intensity of TMRM-stained cells with 4 groups for detecting mitochondrial membrane potential. (D) Measurements of γ-H2AX foci activated cells clearly show significant differences between TNPs + radiated and radiated cells. The last lane of (A) and (B) is the magnified areas marked with yellow squares in lane 3 of both images. (C) and (D) The data are plotted as augmented Box and Whisker plots, with all data points shown. The Group medians (bold horizontal lines), means (dashed horizontal lines), range from smallest to largest outlier (vertical lines), and box plots corresponding to 25th and 75th percentiles are plotted (****P < .0001, ***P < .001, **P < .01, *P < .05, 2-way ANOVA multiple testing correction with pairwise post hoc comparison with Tukey test). (E) Oral squamous cancer-19 (OSC-19) cells were seeded in the 6-well plates overnight and treated with/without TNPs (∼1011 TNPs/mL) for 12 h and irradiated with 24, 6, and 8 Gy 300 kV beams. After 40 min, cells were lifted and washed with 1× cell staining media (1×PBS + 2%FBS). ROS levels were quantified using the CellROX deep red Reagent. Results suggest a significant increase in ROS levels in TNP-treated cells, especially in doses greater than 4 Gy.
Quantification of ROS levels by CellROX deep red Reagent suggests low TNP toxicity (ROS level: 0.12%) in TNP-treated control cells but significant increases in ROS level in TNP-treated cells, compared with nontreated cells after radiation (Figure 4E); For 2 Gy radiation, the ROS level for nontreated group is just 0.04% [CL: 0.027-0.05] and is 0.30% [CL: 0.17-0.43] in TNP-treated cells. For 4 Gy radiation, the ROS level for nontreated group is 0.39% [CL: 0.32-0.46] and is 12.57% [CL: 10.66-14.50] in TNP-treated cells which is significantly higher than nontreated group. For 6 Gy radiation, the ROS level for nontreated group is 1.01% [CL: 0.46-1.56] and is 84.20% [CL: 75.18-93.22] in TNP-treated cells. For 8 Gy radiation, the ROS level for nontreated group is 18.37% [CL: 11.19-25.55] and is 99.30% [CL: 99.18-99.42] in TNP-treated cells (Figure 4E and Supplemental Figure 1).
Tumor Localization
These Au-Gd-based TNPs possess x-ray attenuation which linearly increases with an increase in concentration of TNPs (60 kV) and which has already been demonstrated in a previous publication. 34 Here, we assessed the ability of TNPs to identify tumor localization on the tongue of animals and then direct radiation specifically to tumor. The results as presented in Figure 5A depict the CT intensity of the tumor site after 10 µL intratumoral injection of TNPs and it helped in clear demarcation of tumor for radiation dosing as compared to tumors injected with saline.

Tumor localization and image-guided radiation therapy. (A) Intratumoral theranostic nanoparticles (TNPs) localization in oral squamous cancer-19 (OSC-19)LUC+ tumors at 10 min post-injection were imaged by Pxinc's X-RAD SmART scanner using a cone beam computerized tomography (CT). (B-D) Schematic depiction of the radiation setup in which tumor xenografts were irradiated with preclinical (8 Gy, orthogonal, 220 kV) radiation beams (green shaded area). (E) The dose-volume histograms show that 80% of the radiation dose was received by the tumor and protected the surrounding healthy oral cavity. (F) T1 contrast magnetic resonance (MR) imaging was performed after intravenous injection of TNPs in OSC-19LUC+ tumors for pre-(0 h), post-4 h, post-8 h, and post-24 h systemic injection. The tumor is marked with a black arrow. (G) Tumor-to-background ratio (TBR) enhancement comparison OSC-19LUC+ tumors at different time points. Maximum enhancement is reached at 4 h (n = 3, *P < .01). (H) The distribution of TNPs in tumor sections extracted from rats systemically injected with TNPs and undergone MRI. DAPI stains cell nucleus in blue; Alexa Fluor594 in combination with CD31 stains blood vessels in green; The 3 channels (DAPI, Alexa Fluor594, and dark field) are overlaid. The TNPs (red) and fluorescent images of blood vessels (green) are from the same region of tumor.
A targeted image-guided RT procedure was implemented to model clinical workflow. The tumor was delineated after the injection of TNPs with the reconstructed CT image and the 3D radiation dose calculations were performed (Figure 5B-D). For preclinical irradiation (220 kV), the treatment plan consisted of a pair of orthogonal beams at 36- and 144-degree angles with the isocenter at the center of the tumor (Figure 5B). The calculated isodose levels showed an 80% radiation dose (8 Gy) in the tumor while substantially sparing the surrounding healthy tissues in the oral cavity (Figure 5E). No histological damage was observed in the tongue tissue excised from the proximity of the irradiated tumor.
Theranostic nanoparticles also hold potential as a MR contrast agent. 34 The MR imaging (VTR-T1 sequence, 7 T, Bruker BioSpin) performance of TNPs in oral cancer was then evaluated in vivo by continuously monitoring the MR signal of the tumor site after 1 × 10¹³ TNPs/mL concentration (injected dose of 1 µL/g of weight of rat) were intravenously injected through the tail vein of rat bearing tongue (OSC-19) tumors. T1-weighted images were background corrected, and tumor ROIs were drawn manually. Magnetic resonance contrast was assessed by the ratio of tumor signal to normal tongue tissue which was labeled as TBR or tumor to background. TBR enhancement was averaged over all slices with tumor present, and over all animals imaged and analyzed. While the tumor intensity kept increasing until the 8 h timepoint, on average, the TBR enhancement reached maximum at 4 h, and thereafter decreased but contrast remained observable for 24 h post injection (Figure 5F and G). At 24 h, the tumors were excised for detecting the distribution of TNPs by dark-field imaging. Theranostic nanoparticles appear as bright spots near the blood vessels due to the enhanced light scattering (Figure 5H).
Image-Guided RT
To test the therapeutic radio sensitization efficacy of TNPs in reducing aggressive tumor growth, we injected intratumorally 10 µL of 1 × 10¹⁴ TNPs/mL solution to OSC-19LUC+ tumor xenograft Rats (n = 5) and saline (10 µL) to control groups (n = 4) and performed image-guided RT at 8 Gy using beam set as described above. Analysis of TGI by bioluminescent imaging revealed strong TGI in the oral squamous tumors treated with TNPs + radiation as compared to animals treated with saline + radiation (Figure 6A and B).

Evaluation of tumor response to radiation therapy by bioluminescence imaging (A) Representative images of theranostic nanoparticles (TNPs) + radiation and saline + radiation treated SSIL2Rγ− with oral squamous cancer-19 (OSC-19)LUC+ cells. These animals were radiated after intratumoral injection of TNPs and saline respectively. (B) Representative images of TNPs + radiation and saline + radiation treated SSIL2Rγ− with OSC-19LUC+ cells. These animals were radiated after systemic injection of TNPs and saline, respectively. In both cases, saline + radiated animals (n = 4) experienced an increase in bioluminescence one week after radiation, while TNPs + radiated animals (n = 5) experienced continuous tumor regression. Rats were followed for 4 weeks after treatment. (C and D) The luciferase signal in each was normalized to the signal before treatment. Animals treated with TNPs, and radiation responded better and difference between the 2 groups in both cases was statistically significant (P < .05, ANOVA test with multiple testing correction with pairwise post hoc comparison with Tukey test). The ribbon indicates mean ± SE in both cases.
To further validate the therapeutic radio sensitization efficacy of TNPs in treating tumor growth in combination with preclinical radiation beams, we analyzed the effect in another set of animals implanted with same oral squamous cell tumors. This group was intravenously injected with 1 × 10¹³ TNPs/mL (injected dose 1 µL/g of weight of rat) to OSC-19 tumor xenograft rats (n = 5) and saline to control groups (n = 4) and performed image-guided RT after 4 h of injection at 8 Gy using beam set as described above. These animals were also followed for 4 weeks with bioluminescent imaging and body weight measurements. The bioluminescent imaging revealed TGI in the oral squamous tumors treated with TNPs + radiation as compared to animals treated with saline + radiation (Figure 6C and D). In comparison to irradiated animals, bioluminescent imaging in control animals indicated a continuous increase in the tumor size (Supplemental Figure 3A and B). The measured body weight of the animals which were irradiated demonstrated significant differences in the effect of tumor burden in the TNPs + radiation versus saline + radiation groups for both intratumoral and systemic delivery of TNPs (Supplemental Figure 3C and D).
Oral cancer commonly leads to lung metastasis. Thus, we investigated if TNPs can enhance radiotherapy and prevent lung metastases. After 4 weeks, both groups of animals were investigated for lung metastases. Rats which were treated with radiation only exhibited multifocal metastasis in both the lungs whereas in TNPs + radiation-treated group; animals exhibited only 1 to 2 foci of metastasis (Figure 7A). As shown in Figure 7B, for the rat treated with radiation alone, the foci stained with antihuman mitochondrial antibody are visible in lung tissue section, whereas tissue section of rat treated with TNPs + radiation is clear. The efficacy of the TNPs + radiation treatment was analyzed by counting the number of metastases on the surface of lungs (effect size = 4.46) (Figure 7C).

Effect of radiation therapy on lung metastasis. (A) Representative images of lung lobes and the number of oral squamous cancer-19 (OSC-19) lung metastases in SSIL2Rγ− rats that received saline + radiation or theranostic nanoparticles (TNPs) + radiation after 4 weeks of treatment. (B) Staining of lung lobes with antihuman mitochondrial antibody collected from SSIL2Rγ− rats that received saline + radiation or TNPs + radiation after 4 weeks of treatment. Lung metastasis as determined by anti-human mitochondrial antibody clearly depicts larger metastatic foci in lungs of rats in saline + radiation group. (C) Average number of metastatic foci in each group is reported as the mean ± SE. (****P < .0001, ***P < .001, **P < .01, *P < .05, 2-way ANOVA multiple testing correction with pairwise post hoc comparison with Tukey test). (D) Different sections of OSC-19LUC+ tongue tumors were stained with anti-γ-H2AX antibody (red) and DAPI (blue). γ-H2AX foci in tumor region material after TNPs + radiation (n = 3) treatment is more as compared to untreated (n = 3) and saline + radiation (n = 3) group.
DNA damage in tumor cells is a primary indicator of biological response to radiation. Our initial quantitative analysis (by γ-Η2ΑX staining), on the cell line confirmed massive DNA damage in TNPs + radiated cells. The qualitative analysis of the in vivo treated tumors also confirmed that DNA damage is more in TNPs + radiation treated group as compared to only radiated group (Figure 7D). No significant DNA damage was observed in untreated tissues used as control.
These results clearly validate and confirm that proposed TNPs amplify RT response and image-guided RT with TNPs further helps in targeting the therapy to tumor tissue and minimizes the effect on the surrounding healthy tissue. No other adverse events in rats were noted during the study duration as a result of TNP or radiation treatment. Prior studies based on image-guided photothermal ablation, and acute toxicity studies have not identified adverse impact of these TNP doses. 34
Discussion
The technological advances in the field of imaging and computer software have modernized radiotherapy in terms of planning and delivery of treatment. Image guidance is a critical component of treatment planning and traditionally CBCT has been used for therapy planning. Although this mode is effective but MRI provides better soft tissue contrast and allows imaging organs which are continuously affected by motions such as swallowing and breathing and can affect RT planning. 44 Recent RT systems are moving toward combining imaging and linear accelerator into one system, allowing real-time visualization and treatment. 45 This development is quite beneficial for cancer patients, particularly for HNC, as it delivers the calculated dose at the targeted site and minimizes toxicity. Along with this development, high Z-nanoparticles can help to achieve enhanced contrast and radiosensitization of tumors. Gold nanoparticles (AuNPs) have been widely used for diagnostic and therapeutic applications in cancer therapy46,47 as this element has a high atomic number, stable, biocompatible, less toxicity, and relatively strong photoelectric absorption coefficient.48‐50 AuNPs have been recognized as promising CT contrast agent, 51 and various groups have described radio sensitizing effect of AuNPs in RT using x-rays, γ-rays, electron beams, and high-energy charged protons/carbon ions.52‐56 Nanoparticles which can enable combined MR imaging, radiotherapy enhancement, and provide additional therapeutic modalities such as NIR photothermal ablation have not been reported for HNSCC. Here, we evaluated potential of TNPs to allow an accurate demarcation of the tumor and increase the efficiency of radiation treatment in a clinically relevant orthotopic model.
The sensitizing effect of TNPs to radiation was demonstrated by the Annexin V-based apoptosis and ROS assays. Interestingly, the cell survival curves in response to TNPs + radiation indicate a strong dose-dependent enhancement effect (Figure 3A and B). The dose enhancement effect appears to increase with the proportion of photons in the spectrum as reported previously.57,58 Based on our experimental results, the combination of TNPs with irradiation led to high levels of ROS within irradiated nanoparticle-targeted cells and ROS levels increased with radiation dose as shown in Figure 4E. The main source of cellular ROS is the oxidative phosphorylation in mitochondria and NADPH oxidase on the plasma membrane.59,60 Mitochondria and ROS are involved in many signaling pathways that determine the response of cells to various treatments. ROS can damage mitochondrial function and lead to apoptosis. 61 It has been reported that intracellular mitochondrial membrane potential reduction occurs early in the process of cell apoptosis, 62 and the changes can be detected by TMRM dye.63,64 Our results clearly suggest that ROS causes a decrease in mitochondrial membrane potential after radiation, and the effect is more in TNPs + radiated cells as compared to saline + radiated cells (Figure 4A). Although the difference in decrease of mitochondrial membrane potential of radiated and TNPs + radiated cells is not statistically significant, the presence of TNPs still indicates the sensitizing effect (Figure 4B). Another mechanism involved in nanoparticle-mediated radiosensitization is DNA damage and repair. Radiation induces double-strand breaks in DNA and their repair is essential for cell survival. 65 Distinct quantitative variations in γ-H2AX foci appeared in TNPs + radiated cells as compared to radiated cells (Figure 4C). The induction of γ-H2AX foci analysis has been previously reported in the presence of AuNPs.66,67 Although there have been reports about gold nanoparticles promote DNA damage, mechanisms of action have not been clearly elucidated.66,68,69 This effect is mainly mediated either due to localization of nanoparticles at perinuclear/within nucleus or through indirect process mediated through ROS.70,71 The DNA damage effect of TNPs in OSC-19 cells can be due to combined effect of both mechanisms but further in-depth study could shed more light on the underlying mechanism of nanoparticles influence on DNA damage.
There are several reports in the literature where combination therapies involving nanoparticles and enhanced radiotherapy effect have recently reached clinical trials.72‐74 Here, we also investigated the effect of gold-based TNPs that can be used as radiation dose amplifier as well as an imaging agent. The enhanced CT contrast after an intratumoral injection and application in planning for 3D radiation dose demonstrate the clinical efficacy of TNPs (Figure 5A and D). Besides this, the MRI data demonstrate a strong tumor uptake after intravenous administration of the TNPs with maximum contrast observed at 4 h, along with tumor retention up to 24 h (Figure 5C and D).
We found that the single dose of RT along with TNPs demonstrated significant tumor response and reduced lung metastasis (Figure 5). The data suggest that TNPs can improve the therapeutic efficacy of RT for Head and Neck cancer treatment. Although the present study is limited in the number of in vivo groups studied, it provides a strong rationale for the application of these nanoparticles in emerging MR-guided RT on MR-LINAC devices.
We expect that the response of the therapy is dose-dependent and various studies have considered different gold-based nanoparticles, 75 however, in the scope of this study, we have not studied the effect of different doses of TNP on the outcome of experiments.
Conclusion
The current experimental data demonstrate that gold-based TNPs enhance the radiation effect in head and neck cancer and can be effective in MRI-guided therapy of cancer. Although further studies will be needed to improvise and determine the therapeutic efficacy of these nanoparticles, this preliminary study demonstrates the potential of TNPs to enhance MR contrast and radiotherapy effect in a clinically relevant orthotopic model system.
Supplemental Material
sj-docx-1-tct-10.1177_15330338231189593 - Supplemental material for X-ray and MR Contrast Bearing Nanoparticles Enhance the Therapeutic Response of Image-Guided Radiation Therapy for Oral Cancer
Supplemental material, sj-docx-1-tct-10.1177_15330338231189593 for X-ray and MR Contrast Bearing Nanoparticles Enhance the Therapeutic Response of Image-Guided Radiation Therapy for Oral Cancer by Gayatri Sharma, Mir Hadi Razeghi Kondelaji and Guru P. Sharma, Christopher Hansen, Abdul K. Parchur, Shayan Shafiee, Jaidip M. Jagtap, Brian Fish, Carmen Bergom, Eric Paulson, William A. Hall, Heather A. Himburg, Amit Joshi in Technology in Cancer Research & Treatment
Footnotes
Acknowledgments
Dr Meetha Medhora, PhD Professor, Department of Radiation Oncology, for her advice on Small Animal Image Guided Radiation Therapy system. Tracy Gasperetti, BS, Research Program Coordinator, Department of Radiation Oncology, Medical College of Wisconsin, helped with animal irradiation experiments.
Authors’ Note
All animal studies employed in this study were approved by the Institutional Animal Care and Use Committee (IACUC), Medical College of Wisconsin (MCW) with protocol number AUA4822. MCW has an Animal Welfare Assurance (Assurance number D16-00064(A3102-01)) on file with the Office of Laboratory Animal Welfare, National Institutes of Health (NIH).
Declaration of Conflicting Interests
The author(s) declared no potential conflicts of interest with respect to the research, authorship, and/or publication of this article.
Funding
The author(s) disclosed receipt of the following financial support for the research, authorship, and/or publication of this article: Partial financial support for experiments was provided by NIH-NCI grant R01CA193343.
Supplemental Material
Supplemental material for this article is available online.
Abbreviations
References
Supplementary Material
Please find the following supplemental material available below.
For Open Access articles published under a Creative Commons License, all supplemental material carries the same license as the article it is associated with.
For non-Open Access articles published, all supplemental material carries a non-exclusive license, and permission requests for re-use of supplemental material or any part of supplemental material shall be sent directly to the copyright owner as specified in the copyright notice associated with the article.