
Abstract
Introduction
Despite the advent of anti-PD-1 immunotherapy as a promising treatment for HCC, there remains a significant gap in the comprehensive analysis of peripheral blood immunological markers that could predict treatment response. This study aims to identify peripheral blood immunological markers predictive of anti-PD-1 therapy response in HCC patients to improve clinical outcomes.
Methods
We retrospectively analyzed 69 HCC patients treated with anti–PD-1 therapy, divided into a training cohort (n = 30) and a validation cohort (n = 39). Clinical characteristics, hematological indices, cytokine levels, and serum PD-1 were assessed. Logistic regression and ROC curve analyses were performed to evaluate prognostic value, with bootstrap validation to assess model robustness. In addition, tumor samples from 6 patients underwent WES, and bioinformatic analyses were conducted to explore mutational profiles and their associations with immune infiltration as supportive mechanistic validation.
Results
The IL-2/IL-10 ratio was significantly associated with tumor progression after adjustment for covariates (OR 2.918, 95% CI 1.191-7.150, p = 0.019) and achieved superior predictive performance (AUC 0.884, 95% CI 0.766-1.000) compared with conventional inflammation-based scores. Bootstrap validation confirmed model stability (corrected AUC ≈ 0.88), and external validation supported predictive value. Whole-exome sequencing revealed that mutations in genes such as FLT3, TET2, and IDH2 were commonly present in HCC. Immune infiltration analyses indicated that these mutations were associated with increased Treg and decreased Th1 infiltration, consistent with the clinical trend. Additional analyses of public transcriptomic datasets further supported these observations.
Conclusion
Our study reveals that a low IL-2/IL-10 ratio is significantly associated with adverse prognosis in HCC patients and may serve as a practical and biologically relevant biomarker for predicting the efficacy of anti–PD-1 therapy. Moreover, systematic evaluation of immune status could provide important guidance for predicting immunotherapy efficacy and supporting future clinical decision-making in HCC management.
Introduction
HCC is the sixth most common cancer and the third leading cause of cancer-related mortality worldwide, with 960 000 new cases diagnosed annually, including 410 000 in China, and 830 000 deaths, of which 390 000 occur in China.1,2 The majority of patients are diagnosed at advanced stages, contributing to the high mortality rate associated with HCC. 3 This highlights the substantial burden of HCC and the significant medical costs incurred due to malignant tumors. 4
TIME has emerged as one of the most compelling research areas in oncology. As our understanding of immune cell targets and signaling pathways expands, ICIs have ushered in a new era of comprehensive cancer treatment. 5 Systemic treatments such as atezolizumab plus bevacizumab6,7 and sintilimab plus bevacizumab, 8 have become first-line options for advanced HCC. Concurrently, research is ongoing to explore the potential of anti-PD-1 therapy as a neoadjuvant or adjuvant treatment for HCC. 9 However, the ORRs of PD-1 inhibitors have been reported to be only around 20%, and clinical outcomes in HCC patients receiving anti-PD-1 therapy remain inconsistent. 10 Recent studies have identified neoantigen burden, 11 immune status phenotypic groups 12 and inflammatory response 13 as factors influencing the efficacy of PD-1 immunotherapy in other solid tumors. These findings underscore the need to identify predictive biomarkers for anti-PD-1 therapy efficacy in HCC to guide individualized treatment and improve ORRs, especially in this heterogeneous disease with multiple susceptibility factors.
Several predictors of anti-PD-1 therapy efficacy have been reported, including inflammation-related indicators and cytokines. Cytokines, which are potent secretory regulators of immune cell activity across multiple cell types and immune systems, 14 serve as key mediators of cell communication in the tumor microenvironment and are closely related to tumor development, progression, and metastasis. 15 Peripheral blood cytokines, as circulating protein biomarkers, have been established to guide clinical decision-making. 16 For instance, elevated levels of IL-8 have been associated with poorer anti-PD-1 treatment outcomes in melanoma, non-small cell lung cancer, and small cell lung cancer.17,18 Similarly, baseline levels of IL-2, IL-4, and IL-6 have been shown to correlate with anti-PD-1 therapy efficacy in small cell lung cancer. 19 However, in HCC, these cytokines have not been extensively studied, and their value in predicting survival outcomes after anti-PD-1 therapy remains to be fully elucidated. In our study, we evaluated the serological indicators and cytokines of patients and analyzed the correlation between each parameter and prognosis. Our aim was to establish a predictive model for anti-PD-1 therapy efficacy and provide a new basis for clinical decision-making.
Materials and Methods
Subjects
This retrospective study included a total of 69 patients with HCC who received anti–PD-1 therapy at Sichuan Provincial People's Hospital between January 2021 and January 2023. Among them, 30 patients were assigned to the training cohort and 39 patients to the validation cohort. Medical records were reviewed according to the following inclusion criteria: (1) diagnosis of HCC confirmed by pathology or imaging; (2) age between 18 and 75 years; (3) no prior anti-PD-1 therapy before study initiation; (4) no other diagnosed malignancies; and (5) complete medical and follow-up data, including laboratory blood test results obtained within 3 days before the first administration of PD-1 inhibitors and imaging evaluation data from enhanced CT or MRI performed within one week prior to the first use. Exclusion criteria included: (1) presence of other malignant tumors; (2) hematological diseases; and (3) loss to follow-up within 1 month after initiation of anti-PD-1 treatment. All patient data were fully de-identified prior to analysis to ensure that no individual could be identified directly or indirectly.
Cytokines and PD-1 Levels Assay
Peripheral venous blood samples were collected from all participants within 3 days prior to the initiation of anti-PD-1 therapy. Whole blood samples were collected in EDTA-coated tubes, centrifuged, and the serum was stored at −80 °C until further processing. The levels of IL-1β, IL-2, IL-4, IL-10, IL-12p70, Granzyme B, TNF, and IFN-γ were measured using the BD™ CBA. The serum levels of PD-1 were quantified using the ZC-32640 Human PD-1 ELISA kit. Additionally, inter- and intra-assay reliability assessments were performed to ensure the accuracy of the ELISA kit.
Data Collection and Definition
Complete blood indices were collected from all patients within 3 days prior to anti-PD-1 therapy. Additionally, demographic and imaging data were obtained. Tumor assessments were conducted at baseline, based on imaging data acquired within 1 week before initiating anti-PD-1 therapy, and were evaluated according to the RECIST 1.1. The efficacy of anti-PD-1 therapy was assessed after every four treatment cycles (12 weeks), with assessments continuing up to eight treatment cycles (48 weeks). Tumor responses were categorized as CR, PR, SD, or PD in accordance with RECIST 1.1 criteria. Patients with CR, PR, or SD were classified into the TPF group, while those with PD were assigned to the TP group. It is important to note that prior to initiating anti-PD-1 therapy, individualized treatment plans were formulated based on each patient's specific condition, including options such as surgery, TACE, and TKIs.
Whole-Exome Sequencing
Tumor and matched adjacent non-tumor tissue samples from six HBV-related HCC patients, collected at baseline prior to PD-1 inhibitor therapy, were subjected to WES for comparative analysis. Genomic DNA from tumor tissue was extracted and assessed by agarose gel electrophoresis, NanoDrop spectrophotometry, and Qubit fluorometric quantification. Samples with OD260/280 values between 1.8–2.0 and yields >1.5 µg were used for library construction. Whole-exome libraries were prepared using the Agilent SureSelect Human All Exon kit (Agilent Technologies) and sequenced on the SURFSeq 5000 platform with 150-bp paired-end reads. Sequencing reads were aligned to the human reference genome (hg38) using BWA-MEM, and duplicates were marked with Picard. Somatic variants were called with GATK Mutect2 and Strelka2, filtered against gnomAD, and annotated using ANNOVAR and Ensembl VEP. The mutational landscape was visualized with the R package maftools. TMB was calculated as nonsynonymous mutations per megabase, and associations between recurrently mutated genes and immune infiltration were analyzed using TIMER2.0.
Immune Cells Infiltration Analysis
For cytokine-related analysis, normalized transcriptomic data (log2-transformed TPM) of HCC were downloaded from TCGA. The IL-2/IL-10 ratio was calculated and uploaded to TIMER2.0 (http://timer.cistrome.org) and CIBERSORTx (https://cibersortx.stanford.edu) to estimate immune cell infiltration. Associations between the IL-2/IL-10 ratio and immune cell subsets, including CD4+ T cells, regulatory T cells (Tregs), and M2 macrophages, were assessed using Spearman correlation.
In addition, expression levels of IL-2 and IL-10 individually, as well as recurrently mutated genes identified by WES of our in-house cohort, were explored using the TIMER2.0 platform. Multiple immune deconvolution algorithms were applied to provide a comprehensive profile of the tumor immune microenvironment.
Bioinformatic Data Source and Analysis
To further investigate the role of IL-2 and IL-10 in the tumor immune microenvironment, transcriptomic data were obtained from the GEO database. The GSE137610 dataset was used to compare IL-2 and IL-10 expression between effector and exhausted CD8+ T cells. Correlation analyses between IL-2, IL-10, and other mRNAs were performed, and the most highly correlated genes were selected for functional enrichment analysis. GO and KEGG enrichment were conducted using DAVID (https://david.ncifcrf.gov), and pathway-level exploration was supplemented by GSEA.
Statistical Analysis
Clinical, serological, and immunological indices were compared between the TP and TPF groups. Continuous variables were expressed as mean ± SD or median with IQR, and categorical variables as counts with proportions. Group differences were assessed using Fisher's exact test for categorical data and Student's t-test or Mann–Whitney U test for continuous data, as appropriate. Cut-off values were determined by Youden's index derived from ROC curve analysis in the training cohort.
The prognostic significance of candidate variables was evaluated by univariate and multivariate logistic regression. Variables with p < 0.05 in univariate analysis were included in the multivariate model. Predictive performance was assessed using ROC curves and the AUC, with ORs and 95% CIs reported.
To evaluate model robustness, internal validation was performed with 500 bootstrap resamples, and both optimism-corrected and .632 + bootstrap estimates of AUC were calculated. Calibration was assessed by estimating the calibration slope. Statistical analyses were conducted using SPSS version 27.0 (IBM Corp.) and GraphPad Prism version 9.2.0 (GraphPad Software, Inc.), with two-sided p < 0.05 considered statistically significant. The reporting of this study conforms to the REMARK guidelines. 20
Results
Baseline Characteristics of Study Patients
Between January 2021 and January 2023, 30 HCC patients were enrolled in the training cohort. The mean age was 57.3 years (SD 8.19). Twenty-eight patients (93%) were male. Nineteen patients (63.3%) were BCLC stage A–B, and 11 (36.7%) were stage C–D. Twenty-four patients (80%) were Child–Turcotte–Pugh grade B–C. The median maximal tumor diameter was 7.75 cm (IQR 4.63-11.25). Extrahepatic metastases were present in eight patients (27%). Fifteen patients (50%) had received TACE, and 15 (50%) had undergone surgery. Ten patients (33%) were treated with TKIs in combination. All patients received camrelizumab at 200 mg per dose. The tumor progression group showed higher hsCRP levels (median 8.67 mg/L). PT was prolonged (mean 13.56 s). ALB was reduced (mean 29.91 g/L). Other hematological and biochemical parameters, including WBC, neutrophils, lymphocytes, platelets, and liver function indices, were not significantly different between groups. Detailed baseline characteristics are summarized in Table 1.
Baseline Characteristics of HCC Patients Receiving PD-1 Inhibitor Therapy (Training Cohort).

Notes: *TKI refers to Lenvatinib.
Cytokine Assay Results
Baseline cytokine assays revealed significant differences between groups. IL-2 levels were higher in the progression group (p = 0.0045). IL-10 levels were also higher (p = 0.025). Serum free PD-1 showed no significant association with tumor progression (p > 0.05). Other cytokines, including IL-1β, IL-4, IL-12p70, Granzyme B, TNF, and IFN-γ, are presented in Figure 1. At the end of follow-up, 16 patients had experienced disease progression.
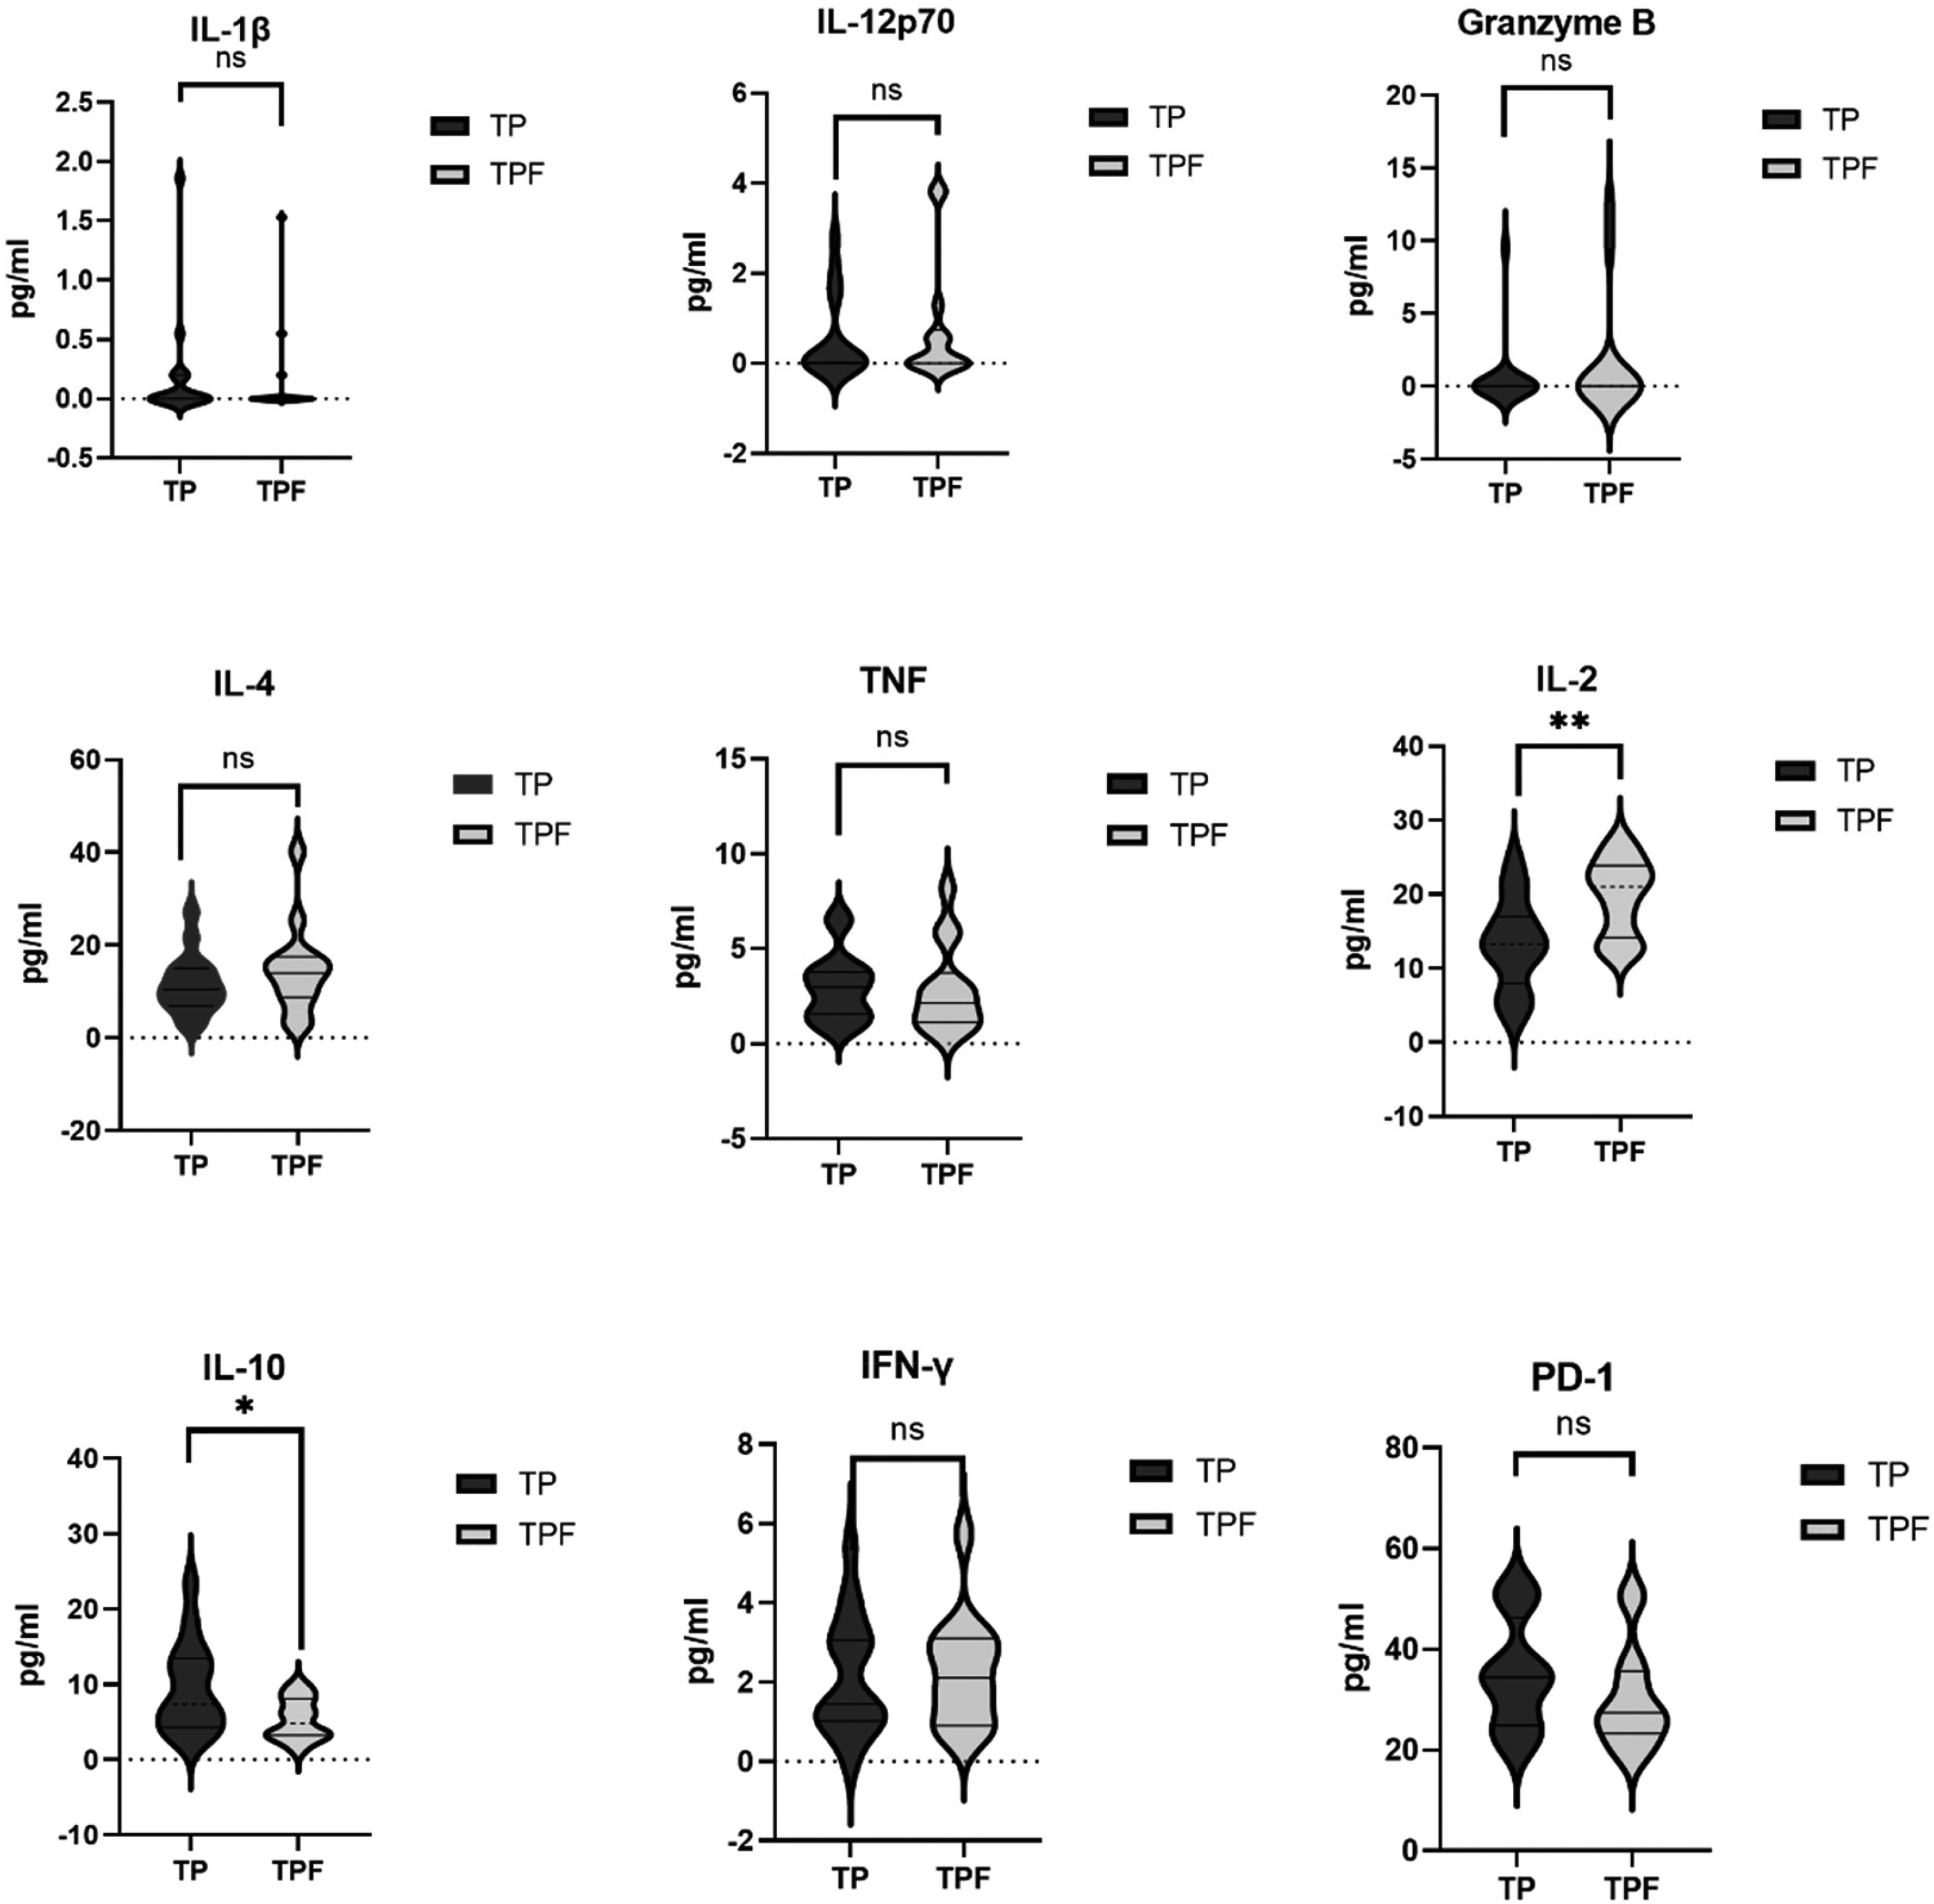
Baseline serum cytokine and immune marker profiles in HCC patients (training cohort).
Relationships Between Cytokines Prediction Models and Tumor Progression (Training Cohort)
Univariate logistic regression included baseline characteristics, hematological parameters, cytokine levels, serum PD-1, and four inflammation-based scores. Significant predictors of tumor progression were WBC (OR 0.167, 95% CI 0.028-0.997, p = 0.050), ALB (OR 1.223, 95% CI 1.001-1.494, p = 0.049), treatment option (OR 0.182, 95% CI 0.038-0.873, p = 0.033), IL-2 (OR 1.221, 95% CI 1.043-1.429, p = 0.013), IL-10 (OR 0.795, 95% CI 0.636-0.995, p = 0.045), and the IL-2/IL-10 ratio (OR 3.047, 95% CI 1.390-6.681, p = 0.005) (Supplementary Table 1). Serum PD-1 (p = 0.219) and inflammation-based scores, including NLR (p = 0.543), PLR (p = 0.256), CAR (p = 0.137), and LCR (p = 0.828), were not significant.
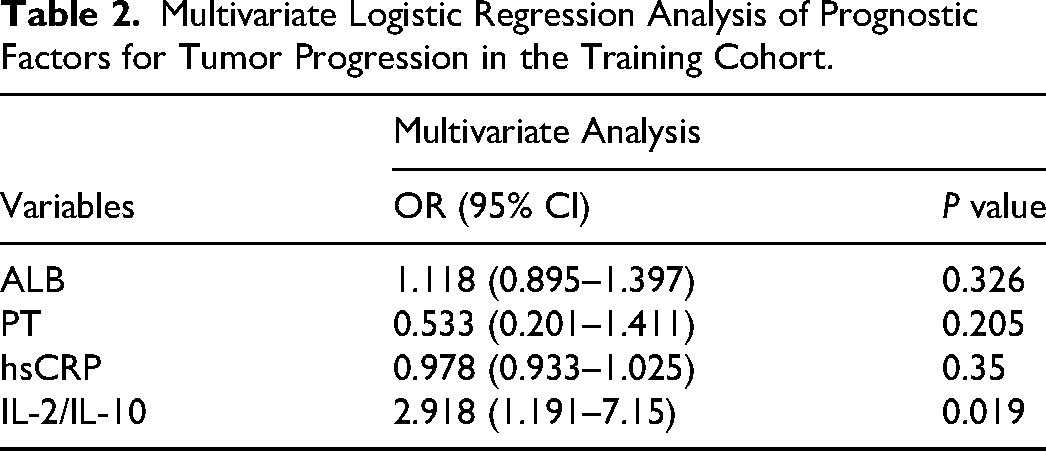
Multivariate logistic regression confirmed that the IL-2/IL-10 ratio remained significantly associated with tumor progression after adjusting for other covariates (OR 2.918, 95% CI 1.191-7.150, p = 0.019) (Table 2). Treatment option, IL-2, and IL-10 were not included in the model. ALB, PT, and hsCRP were not significant. The complete results of univariate regression analyses are provided in Supplementary Table 1, whereas the complete results of multivariate regression analyses are presented in Table 2.
Multivariate Logistic Regression Analysis of Prognostic Factors for Tumor Progression in the Training Cohort.
Comparison of the predictive value of cytokine scores and inflammation-based scores (training cohort)
The prognostic performance of the IL-2/IL-10 ratio was compared with traditional inflammation-based scores, including IL-2, IL-10, CAR, LCR, NLR, and PLR (Figure 2, Table 3). The IL-2/IL-10 ratio achieved an AUC of 0.884 (95% CI 0.766-1.000), with sensitivity of 1.000 and specificity of 0.687 (p < 0.001). This was superior to IL-2 (AUC 0.781), IL-10 (AUC 0.717), CAR (AUC 0.717), LCR (AUC 0.714), NLR (AUC 0.679), and PLR (AUC 0.616).

ROC curves comparing the IL-2/IL-10 ratio with conventional inflammation-based indices for predicting tumor progression in HCC patients receiving PD-1 inhibitor therapy (training cohort).
Predictive Performance of the IL-2/IL-10 Ratio and Inflammation-Based Indices for Tumor Progression in the Training Cohort.

In the training cohort, the apparent AUC of the IL-2/IL-10 ratio was 0.88. Internal validation with 500 bootstrap samples showed minimal optimism (≈0; mean optimism = −0.004). The optimism-corrected AUC was 0.89. Using the .632 + bootstrap method, the corrected AUC was 0.88. The calibration slope was 1.00, indicating good calibration and minimal overfitting.
Multivariate Analysis in the Validation Cohort
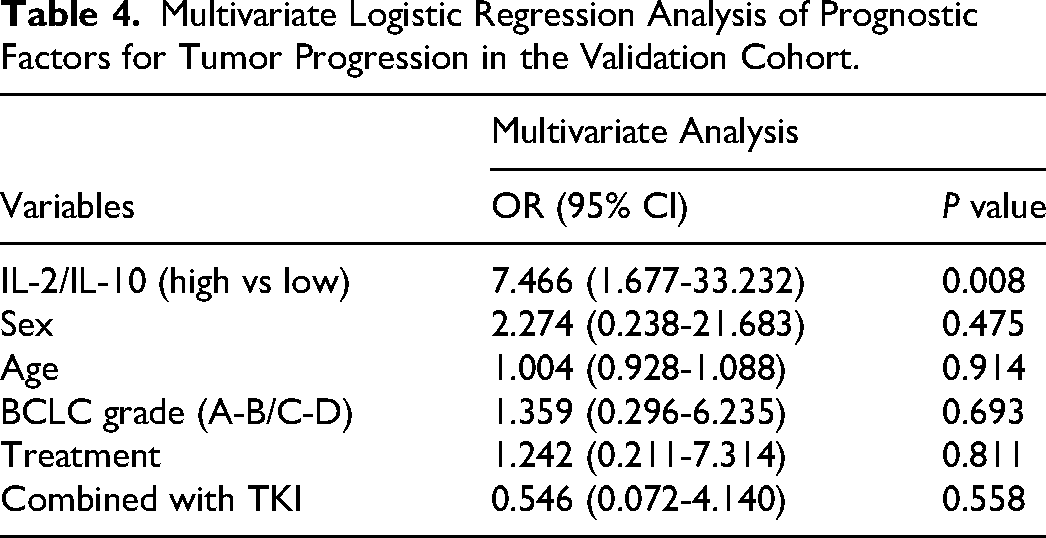
Multivariate logistic regression in the validation cohort showed that a high IL-2/IL-10 ratio (vs low) remained significantly associated with a lower risk of tumor progression (OR 7.466, 95% CI 1.677-33.232, p = 0.008) (Table 4). Other variables, including sex, age, BCLC stage, treatment, and combined TKI therapy, were not significant. The baseline characteristics of the validation cohort are provided in Supplementary Table 2, showing no significant differences between the TPF and TP groups.
Multivariate Logistic Regression Analysis of Prognostic Factors for Tumor Progression in the Validation Cohort.
ROC curve analysis further evaluated the discriminatory performance of the IL-2/IL-10 ratio. The AUC was 0.72 (Figure 3). These findings were consistent with those of the training cohort, confirming the robustness of the IL-2/IL-10 ratio as a prognostic factor associated with tumor progression.

ROC curve of the IL-2/IL-10 ratio for predicting tumor progression in HCC patients receiving PD-1 inhibitor therapy (validation cohort).
Immune Infiltration Analysis of IL-2/IL-10
Using TIMER and CIBERSORT algorithms, we assessed immune infiltration in relation to IL-2/IL-10 expression in the training cohort. CD4+ T cell infiltration was higher in the IL-2/IL-10 high group (p < 0.01) (Figure 4a). M2 macrophage infiltration was enriched in the IL-2/IL-10 low group (p < 0.001) (Figure 4b). Treg infiltration showed no significant difference, although a trend toward enrichment was observed in the low group (Figure 4c).

Immune infiltration analysis of IL-2/IL-10 in the training cohort. (a) CD4+ T cell infiltration was significantly higher in the IL-2/IL-10 high group. (b) M2 macrophage infiltration was significantly enriched in the IL-2/IL-10 low group. (c) Treg infiltration showed no significant difference between groups. **p < 0.01; ***p < 0.001.
These findings are consistent with the biological functions of IL-2, secreted by Th1 cells, and IL-10, produced by Tregs, and further highlight the contribution of immunosuppressive M2 macrophages. Supporting evidence was observed in the murine dataset GSE137610, where exhausted CD8+ T cells displayed decreased IL-2 and increased IL-10 compared with effector T cells (Supplementary Figures S1 and S2). Additional enrichment and correlation analyses confirmed that IL-2– and IL-10–related genes are involved in immune activation and suppression pathways and are significantly associated with multiple immune cell populations in HCC (Supplementary Figures S3 and S4). Analyses of IL-2 and IL-10 individually showed immune infiltration patterns similar to those observed for the IL-2/IL-10 ratio (Supplementary Figures S3 and S4).
Collectively, these data indicate that the IL-2/IL-10 ratio reflects the balance between effector and suppressive immune infiltration, reinforcing its predictive relevance in HCC.
Mutation Landscape and Immune Infiltration Associations
WES was performed on baseline tumor and matched adjacent non-tumor tissues from six HBV-related HCC patients within our in-house cohort. We analyzed the mutation landscape of these samples, and missense mutations were the most common variant classification (Figure 5a). SNPs accounted for most variant types, followed by insertions and deletions (Figure 5b). Among SNV classes, C > T transitions were the most frequent (Figure 5c). The median number of variants per sample was nine, with a range of 0 to 34 (Figure 5d). The overall distribution of variant classifications is shown in Figure 5e. The top 20 most frequently mutated genes are presented in Figure 5f. FLT3 (27%), DNMT3A (25%), and NPM1 (17%) were the most frequently mutated, followed by TET2 (10%), IDH2 (9%), and CEBPA (7%). Among these, 15 genes showed consistent immune infiltration patterns. Th1 infiltration was negatively correlated, whereas Treg infiltration was positively correlated.

Mutation landscape of the in-house HCC cohort. (a) Variant classification. (b) Variant type. (c) SNV class. (d) Number of variants per sample. (e) Summary of variant classification. (f) Top 20 mutated genes and their mutation frequencies.
We selected FLT3, TET2, and IDH2 for detailed analysis. All three genes showed negative correlations with Th1 infiltration and positive correlations with Treg infiltration (Figure 6). These results suggest that frequent HCC mutations are linked to an immune microenvironment characterized by reduced effector activity and enhanced suppression. This pattern aligns with the functional role of the IL-2/IL-10 ratio and provides additional evidence for its utility as a biomarker of tumor progression in an immunogenomic context.
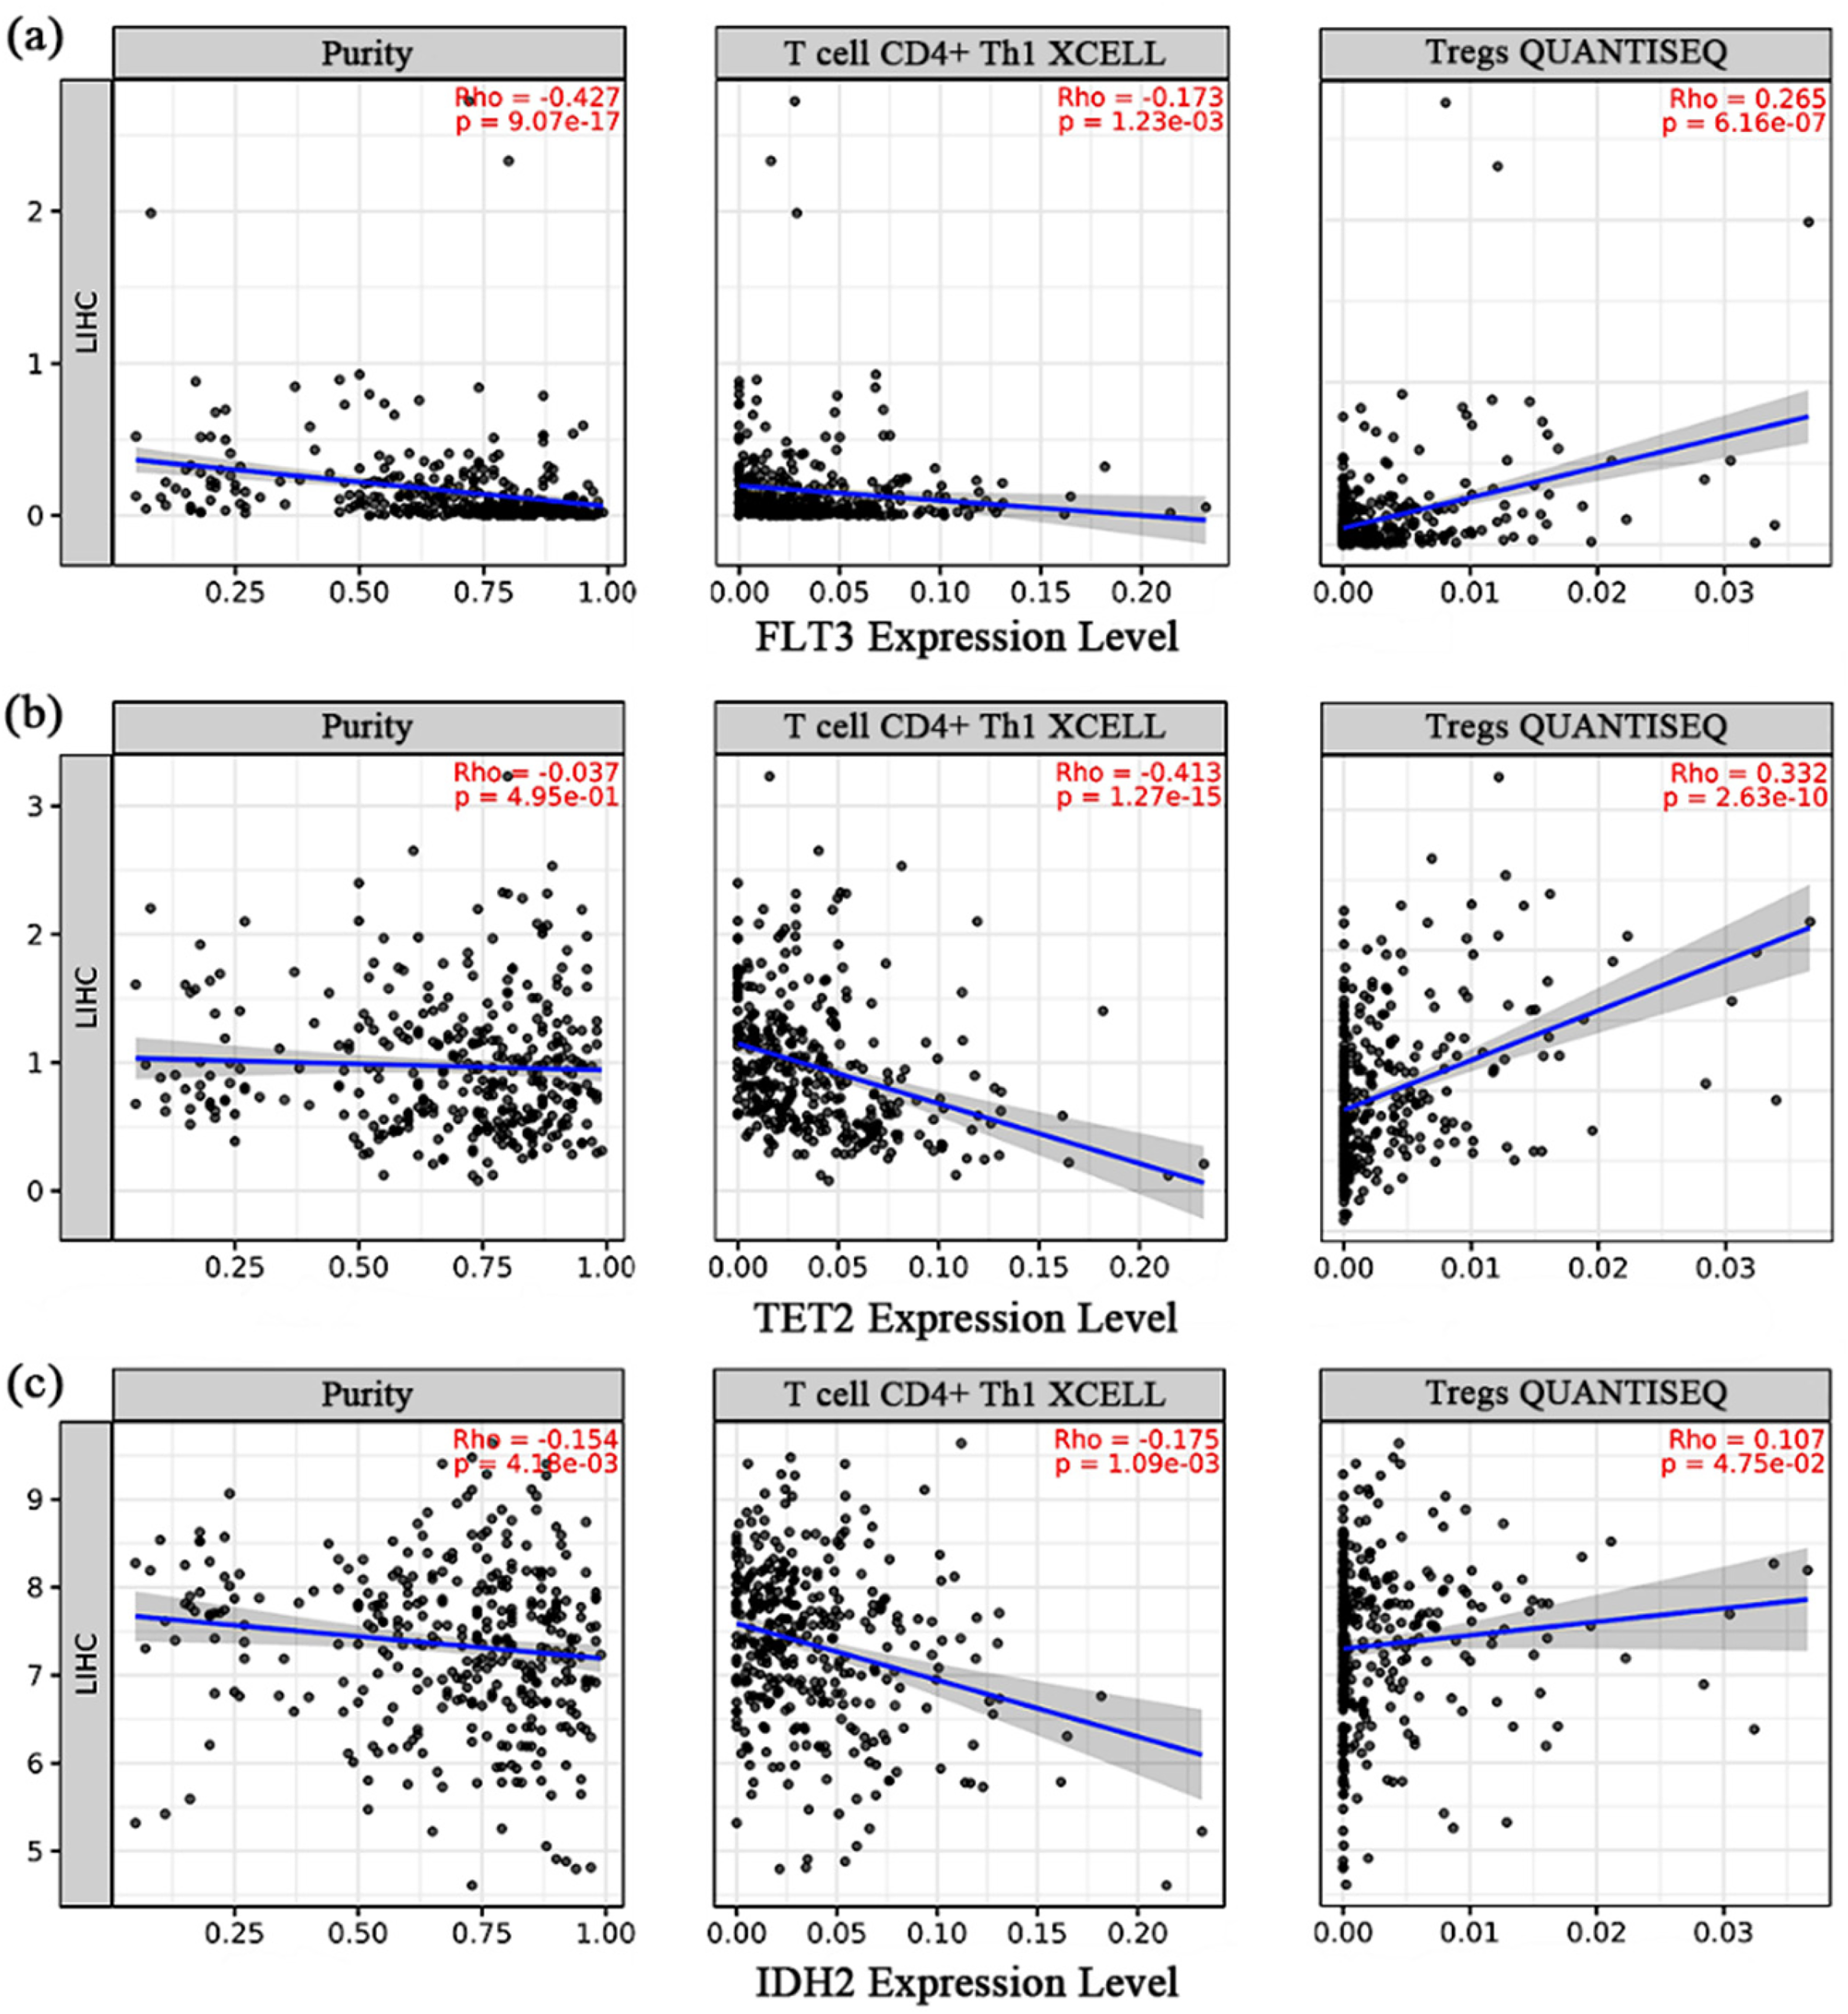
Correlation between FLT3, TET2, and IDH2 expression and immune cell infiltration in HCC. Expression levels of FLT3 (a), TET2 (b), and IDH2 (c) were analyzed for their correlations with tumor purity, CD4+ Th1 cells, and Tregs using the TIMER database.
Discussion
In our investigation, we identified the IL-2/IL-10 ratio as a potential predictor for the efficacy of anti-PD-1 therapy in patients with HCC. A higher ratio was associated with a more pronounced response, while a lower ratio suggested poor efficacy, potentially linked to the inhibitory systemic immune landscape observed in HCC patients. 19 These results are consistent with previous studies in other malignancies, 21 where elevated IL-2 was associated with favorable responses, 19 whereas IL-10, produced by Tregs, B cells, 22 and Th2-polarized CD4+ T cells, 23 correlated with treatment resistance. 24 In line with this, our sequencing analysis also revealed recurrent mutations in genes such as FLT3, TET2, and IDH2, which were associated with immunosuppressive infiltration patterns, further supporting the functional role of the IL-2/IL-10 axis. This dual role highlights that the balance between IL-2 and IL-10, rather than their absolute levels, is more biologically meaningful for predicting anti–PD-1 outcomes.
In the training cohort, the IL-2/IL-10 ratio demonstrated strong predictive performance (AUC = 0.888), with bootstrap and .632 + validation confirming model robustness. Although the AUC declined to ∼0.72 in the validation cohort, reflecting attenuation across populations, the IL-2/IL-10 ratio remained significantly associated with tumor progression after adjustment. The difference may be explained by small sample sizes (30 vs 39 patients), cohort heterogeneity, and technical variation. Despite this decline, the validation analysis supports the ratio's robustness and highlights the need for larger, multi-center studies.
The integration of anti–PD-1 therapy into HCC treatment is complex. It may mitigate PD-L1 upregulation after TACE 25 and counter trauma-induced immunosuppression when used postoperatively.26,27 However, blocking the PD-1/PD-L1 pathway alone does not fully determine antitumor immunity. 28 Our findings suggest that peripheral immune function, as reflected by IL-2 and IL-10 levels, is a key determinant of response. Intercellular communication and cytokine networks,29,30 including both immune activation and suppression, are central to PD-1 efficacy.31,32 Based on this, IL-2 and IL-10 can be considered prognostic biomarkers, and their combined ratio improves the ability to distinguish “hot” from “cold” tumors. This interpretation is supported by prior findings that elevated IL-10 correlates with poor prognosis in HCC patients 33 and that IL-10 can promote immunosuppressive microenvironments by enhancing Treg activity and inhibiting effector T cell responses. 34 Meanwhile, IL-2 is well recognized for its role in promoting T cell proliferation and enhancing anti-tumor immunity, suggesting that the IL-2/IL-10 balance may reflect the overall immune status within the tumor microenvironment. 35
Mechanistically, IL-10 is a classical immunosuppressive cytokine secreted primarily by Tregs, 36 known to inhibit Th1 responses and cytotoxic T cells.37–39 Its enrichment has been linked to poor prognosis in gastric, bladder, and liver cancers,40,41 and to PD-1 upregulation via STAT3 signaling, 42 contributing to immune evasion. 43 Conversely, IL-2, mainly secreted by activated CD4+ T cells, 44 activates downstream JAK-STAT, PI3K-AKT, and MAPK pathways, 45 and stimulates CTLs, NK cells, and LAK cells to exert cytotoxicity against tumor cells. 46 Together, these opposing functions explain why their ratio provides stronger predictive value than individual cytokines or conventional inflammation-based indices. To further explain these findings, we performed whole-exome sequencing and bioinformatic analyses, which revealed recurrent mutations in genes such as FLT3, TET2, and IDH2. These genes were associated with increased Treg and reduced Th1 infiltration, in line with our clinical observation that a low IL-2/IL-10 ratio predicts poor prognosis. Collectively, these results reinforce the concept that the balance between immune activation and suppression critically influences outcomes in HCC patients receiving PD-1 therapy.
To further contextualize the value of the IL-2/IL-10 ratio, it is also necessary to compare it with other well-established immunotherapeutic biomarkers. PD-L1 expression, although extensively studied, has shown inconsistent predictive value in HCC due to tumor heterogeneity and variability in immunohistochemical assessment.47,48 TMB is a promising biomarker in multiple cancers; however, its predictive significance in HCC remains controversial, as most cases are virus-related with relatively low TMB, and tissue-based next-generation sequencing imposes practical limitations.48–50 Importantly, unlike in melanoma or non-small cell lung cancer, neither PD-L1 nor TMB testing is currently mandatory for immunotherapy initiation in HCC, reflecting their limited utility in this setting.51,52 In contrast, the IL-2/IL-10 ratio can be measured non-invasively from peripheral blood, offering higher feasibility and reproducibility in routine practice. Moreover, it reflects the systemic immune balance between effector and regulatory responses, thereby providing complementary information to tissue-based biomarkers. Nevertheless, we acknowledge that cytokine ratios may be affected by inflammatory comorbidities and require assay standardization for clinical application.
From a translational perspective, the IL-2/IL-10 ratio may serve as a baseline biomarker for risk stratification before PD-1 therapy. A low ratio consistently indicated poor prognosis and an immunosuppressive microenvironment, supporting its use as a pretreatment predictor. Given the dynamic nature of cytokines, the ratio may also have potential as a monitoring marker during therapy, although prospective validation is required. For clinical implementation, assay standardization using validated ELISA or multiplex platforms with harmonized procedures is essential. The cut-off requires external validation: in our study, the threshold of 2.3 derived from the training cohort was successfully applied in the validation cohort, but multi-center prospective studies are needed for confirmation or recalibration.
Collectively, our results highlight the translational potential of the IL-2/IL-10 ratio as a clinically practical and biologically grounded biomarker. At the same time, they underscore the exploratory nature of this work and the necessity of larger, standardized, multi-center investigations—including expanded cytokine panels such as IL-6 and other immune mediators—to refine and confirm its role in guiding immunotherapy decision-making in HCC.
Conclusion
Our study reveals that a low IL-2/IL-10 ratio is significantly associated with adverse prognosis in HCC patients and may serve as a practical and biologically relevant biomarker for predicting the efficacy of anti–PD-1 therapy. Moreover, systematic evaluation of immune status could provide important guidance for predicting immunotherapy efficacy and supporting future clinical decision-making in HCC management.
Supplemental Material
sj-docx-1-tct-10.1177_15330338261421357 - Supplemental material for Prognostic Value of the Ratio of Interleukin-2 and Interleukin-10 in Patients with Hepatocellular Carcinoma Treated with Anti-PD-1 Therapy
Supplemental material, sj-docx-1-tct-10.1177_15330338261421357 for Prognostic Value of the Ratio of Interleukin-2 and Interleukin-10 in Patients with Hepatocellular Carcinoma Treated with Anti-PD-1 Therapy by Deyuan Zhong, M.D., Yuxin Liang, M.D., Yuhao Su, M.D., Qinyan Yang, M.D., Hongtao Yan, M.D., Xiaolun Huang, M.D., PhD, and Jin Shang, M.D., PhD in Technology in Cancer Research & Treatment
Footnotes
Abbreviations
Acknowledgements
The authors would like to thank the staff at the Sichuan Cancer Hospital and the Affiliated Hospital of University of Electronic Science and Technology of China for their support in patient management and data collection.
Ethics Statement
This was a retrospective study using clinical data and biospecimens retrieved from the institutional biobank of Sichuan Provincial People's Hospital. The study protocol was approved by the Ethics Committee of Sichuan Academy of Medical Sciences & Sichuan Provincial People's Hospital (Approval No. 2021 Research 552, approved December 2021). All biospecimens in the biobank had been collected with written informed consent at the time of sample acquisition, covering their use in research and publication. The present analyses were conducted strictly within the scope of this approval and in accordance with the Declaration of Helsinki.
Funding
The authors received no financial support for the research, authorship, and/or publication of this article.
Declaration of Conflicting Interests
The authors declared no potential conflicts of interest with respect to the research, authorship, and/or publication of this article.
Supplemental Material
Supplemental material for this article is available online.
References
Supplementary Material
Please find the following supplemental material available below.
For Open Access articles published under a Creative Commons License, all supplemental material carries the same license as the article it is associated with.
For non-Open Access articles published, all supplemental material carries a non-exclusive license, and permission requests for re-use of supplemental material or any part of supplemental material shall be sent directly to the copyright owner as specified in the copyright notice associated with the article.