
Abstract
Introduction
Identifying therapeutic targets and early screening biomarkers is essential for improving the prognosis of lung cancer. CCT3 has been linked to tumor progression; however, its role in lung cancer proliferation and invasion, as well as its diagnostic significance remain poorly understood.
Methods
CCT3 expression and its clinical correlations in lung cancer were analyzed utilizing data from the TCGA and GEO databases. The impact of CCT3 on cell proliferation, migration, and invasion was evaluated through CCK-8, colony formation, and Transwell assays. Western blotting was employed to assess the regulation of the PI3 K/AKT pathway and markers associate with epithelial-mesenchymal transition (EMT). Serum CCT3 levels in 714 participants were measured via ELISA, with diagnostic efficacy analyzed using receiver operating characteristic (ROC) curve analysis.
Results
CCT3 was over-expressed in lung cancer tissues, which was correlated with the stage of non-small lung cancer (NSCLC). CCT3 promotes cell proliferation, migration, and invasion by activating the PI3 K/AKT pathway and modulating EMT. In vivo, CCT3 knockdown significantly suppressed tumor growth in xenograft models. Elevated serum levels of CCT3 have been observed in patients with lung cancer, exhibiting high diagnostic efficacy for distinguishing NSCLC from benign nodules (AUC=0.873) and enhancing performance for small cell lung cancer when combined with proGRP.
Conclusion
CCT3 facilitates the progression of lung cancer through the PI3 K/AKT-EMT axis, positioning it as a potential therapeutic target and biomarker.
Introduction
Lung cancer is the most frequently diagnosed malignancy and stands as the leading cause of cancer-related mortality globally. 1 Recent data from the National Cancer Center indicate that approximately 2.48 million new cases and over 1.82 million deaths occurred globally.2,3 Due to mild clinical symptoms or a lack of routine screening via low-dose spiral computed tomography, most patients are diagnosed at intermediate or advanced stages, often missing the opportunity for radical resection treatment.4–6 The advent of novel therapeutic strategies, including small molecular kinase inhibitors, anti-PD-1 or CTLA-4 monoclonal antibodies for tumor immunotherapy, has resulted in improved overall five-year outcomes for the patients, especially in non-small cell lung cancer (NSCLC). 7 However, the prognosis remains unsatisfactory for individuals with lung cancer, particularly in cases of small cell lung cancer (SCLC).8,9 Therefore, it is essential to elucidate the underlying pathogenic mechanisms and develop innovative therapeutic approaches.
With the application of high-throughout technology, more and more evidence shows that a large number of abnormal expressed proteins and molecular chaperones are involved in the carcinogenesis of NSCLC and SCLC.10,11 A total of approximately 10% of the protein homeostasis can be regulated by molecular chaperones. 12 Chaperonin containing TCP1 subunit 3 (CCT3) has been reported to be an crucial molecular chaperon that maintaining the folding of its substrates and cell cycle regulation. 13 Emerging studies have demonstrated that aberrantly overexpressed CCT3 hinders YAP and TFCP2 ubiquitination-mediated degradation, thereby contributing to the progression of hepatocellular carcinoma.12,14 Furthermore, circulating levels of CCT3 can effectively differentiate hepatocellular carcinoma from liver cirrhosis and healthy controls, proving superior to alpha-fetoprotein for disease diagnosis.14,15 Down-regulated CCT3 significantly reduced the proliferation and metastasis ability, as well as increased apoptosis of breast cancer cells. 16 Chen et al 17 and Shi et al 18 reported high-expressed CCT3 enhanced the total intracellular ATP levels, protein translation, eukaryotic translation initiation factor 3 (EIF3G) and YAP1 expression to promote malignant phenotype in NSCLC. However, it only accounted for few patient. Moreover, there are currently no studies addressing its role in SCLC or evaluating its diagnostic value across various pathological subtypes within lung cancer.
In this study, we perform a comprehensive bioinformatics analysis, alongside functional and mechanistic experiments in cells, animal models, and population cohort diagnostic studies to elucidate the role of CCT3 in NSCLC and SCLC. We firstly indicate that elevated expression levels of CCT3 facilitate the progression of both NSCLC and SCLC through the PI3K-AKT- EMT axis. Furthermore, circulating CCT3 emerges as a novel complementary biomarker for the screening and diagnosis of these two subtypes, particularly NSCLC.
Materials and Methods
Eligible Individuals Enrollment and Laboraotory Detection
A total of 714 eligible individuals were enrolled in the study, comprising 237 normal controls (NC group), 88 individuals with benign pulmonary nodules (PN group), 295 NSCLC patients, and 94 SCLC cases. All participants were recruited from a tertiary university-affiliated hospital in southern China between 2022 and 2024. This study was approved by the Biomedical Research Ethics Committee of the Second Affiliated Hospital of Nanchang University (Approval No. O-2024161); the committee granted a waiver of informed consent for this observational study. The detailed process of subject screening and enrollment is schematically illustrated in Supplemental Figure 1. We collected clinical baseline characteristics along with 2 mL serum samples obtained at diagnosis, which were subsequently stored at −80 °C for future analysis. Serum CCT3 levels were quantified using a commercial human CCT3 ELISA kit (Bioswamp, HM11181; sensitivity: ≤0.025 ng/mL; linear range:0.125-10 ng/mL) following the manufacturer's protocol. Absorbance was read at 450 nm and concentrations calculated from the standard curve. Common biomarkers including carcinoembryonic antigen (CEA), carbohydrate antigen 19-9 (CA19-9), neuron-specific enolase (NSE), cytokeratin fragment 21-1 (CYFRA21-1), and pro-gastrin-releasing peptide (proGRP). The inter-assay and intra-assay coefficients of variation for these detection methods were found to be less than 5% and less than 10%, respectively.
Bioinformatics Analysis
The expression of CCT3 within NSCLC and its clinical correlations (including stage and lymph node metastasis) were analyzed using UALCAN with TCGA data, and the findings were validated against GEO datasets (GSE10072, GSE75037). Expression analysis of CCT3 within SCLC was conducted utilizing GEO datasets (GSE149507, GSE108055). For differential expression analysis, raw GEO expression matrices were processed in R (version 4.3.2). After background correction and normalization, differentially expressed genes (DEGs) were identified using the limma package, with thresholds set at |log2FC| > 1 and p < 0.05. Volcano plots were also generated using limma and the ggplot2 package to visualize the DEG distribution.
The protein-protein interaction (PPI) network was constructed using STRING with a confidence threshold greater than 0.7 and visualized through Cytoscape; core modules were identified via MCODE. Gene Ontology (GO) and Kyoto Encyclopedia of Genes and Genomes (KEGG) enrichment analyses were performed using DAVID with a false discovery rate (FDR) set at less than 0.05.
Cell Culture and Transfection
The human bronchial epithelial cell line BEAS-2B and lung cancer cell lines (NCI-H1703, DMS114, NCI-H446, A549) were obtained from the Cell Bank of the Chinese Academy of Sciences (Shanghai, China). The NCI-H1048 cell line was purchased from Fuheng Biology (Shanghai, China). All cell lines were authenticated by short tandem repeat (STR) profiling and routinely tested for mycoplasma contamination.
BEAS-2B, NCI-H1703, DMS114, NCI-H446, and NCI-H1048 were cultured in RPMI-1640 supplemented with 10% FBS and 1% penicillin-streptomycin; A549 was maintained in DMEM with 10% FBS. All cell lines were cultured at 37 °C in a humidified atmosphere containing 5% CO₂. CCT3 siRNAs (GenePharma) and the overexpression plasmid (PC-h-CCT3-HA; Hanheng Biotechnology) were transfected using Lipofectamine 2000. The sequences of the CCT3 siRNAs are provided in Supplemental Table 1.The efficiency of knockdown and overexpression was validated by qRT-PCR and Western blotting conducted 48 h post-transfection.
CCK-8 Cell Proliferation and Colony Formation Assay
Cells (5 × 10³/well) were seeded in 96-well plates. At time points of 0, 24, 48, 72, and 96 h, 10 μL of CCK-8 reagent (APExBIO) was added to each well. The cells were then incubated for an additional 2 h before measuring the absorbance at a wavelength of 450 nm. For colony formation assays, cells (1000/well) were seeded in 6-well plates and cultured for a duration of 14 days, with medium changes occurring every three days. Colonies were subsequently fixed using a solution of 4% paraformaldehyde, stained with a dye solution containing 0.1% crystal violet, and counted utilizing ImageJ software. All experiments were conducted in triplicate across three independent experiments.
Transwell Migration and Invasion Assay
For the migration assay, a total of 5 × 10⁴cells in serum-free medium were added into the upper chamber of a Transwell insert, while the lower chamber was supplemented with 20% FBS. After a period of 48 h, we removed the non-migrated cells, and the migrated cells were subsequently fixed and stained.
For the invasion assay, the chambers were pre-coated with Matrigel at a dilution of 1:8. Subsequently, 1 × 10⁵ cells were seeded, following the same procedural steps as described above. Cells within five random fields were counted. Each assay included three replicates and was performed across three independent experiments.
qRT-PCR and Western Blot Analysis
Total RNA was extracted using RNAiso Plus, and complementary DNA (cDNA) was synthesized with the PrimeScript RT Reagent Kit. Quantitative reverse transcription polymerase chain reaction (qRT-PCR) was conducted employing SYBR Premix Ex Taq (TaKaRa), utilizing GAPDH as a reference gene. The sequences of the specific primers used are listed in Supplemental Table 1. Primers were designed using PrimerBank and commercially synthesized by Sangon Biotech. Relative expression levels were calculated using the 2^(−ΔΔCt) method.
Cells were lysed in RIPA buffer containing protease inhibitors, followed by centrifugation to remove debris. Protein concentration was determined using the BCA assay. A total of 30 μg of protein was separated via 10% SDS-PAGE and subsequently transferred to PVDF membranes. Following blocking with 5% BSA, the membranes were incubated overnight at 4 °C with specific primary antibodies: CCT3 (Santa Cruz, sc-271336; 1:200), p-PI3 K (Abmart, T40116; 1:500), PI3 K (Abmart, T40115; 1:500), p-AKT (Abmart, T40067; 1:500), AKT (Proteintech, 10176-2-AP; 1:2000), GAPDH (Proteintech, 60004-1-Ig; 1:5000), Vimentin (Affinity, AF7013; 1:500), E-cadherin (Affinity, AF0131; 1:500), N-cadherin (Affinity, AF5239; 1:500), and SNAI1 (Proteintech, 13099-1-AP; 1:600). Subsequently, the membranes were incubated with HRP-conjugated secondary antibodies at a 1:5000 dilution for 1 h at room temperature. Detailed information on all antibodies is provided in Supplemental Table 2. Protein bands were visualized using ECL detection reagents.
Immunofluorescence
Cells were seeded on glass-bottom confocal dishes at a density of 1 × 10⁵ cells per dish and allowed to adhere overnight. The following day, cells were fixed with 4% paraformaldehyde for 20 min at room temperature and subsequently washed three times with PBS. For permeabilized staining, cells were treated with 0.1% Triton X-100 for 10 min. After blocking with 5% BSA for 60 min, cells were incubated with anti-CCT3 primary antibody(Santa Cruz, sc-271336; dilution:1:50) and Pan Cadherin antibody(Selleck, F0771; dilution:1:100) overnight at 4 °C, followed by a fluorophore-conjugated secondary antibody for 1 h at room temperature. Nuclei were counterstained with DAPI. Coverslips were mounted with antifade medium and imaged using a confocal microscope.
In Vivo Tumorigenesis Assay
Female BALB/c nude mice (4-6 weeks old, 18-22 g; GemPharmatech Co., Ltd, Jiangsu, China) were housed under SPF conditions (22 ± 2 °C, 50-60% humidity, 12-h light/dark cycle) with free access to sterilized food and water. All mice were acclimatized for 7 days before experiments.
Stable CCT3-knockdown NCI-H446 cells (si_CCT3#1) and control cells were prepared using lentiviral shRNA. Mice were randomly assigned to shNC or shCCT3 groups (n = 6 per group), with each mouse considered an experimental unit. For subcutaneous xenografts, 9 × 10⁶ cells in 150 µL serum-free medium were injected into the right flank. Tumor size was measured weekly using calipers by investigators blinded to group allocation, and tumor volume was calculated as (Length × Width2)/2. Tumor volume served as the primary outcome; tumor weight at endpoint was secondary.
Animals were monitored daily for general health. Humane endpoints included tumor diameter >20 mm, >20% weight loss, ulceration, or signs of distress. No animals met these criteria. On Day 21, mice were euthanized by gradual-fill CO₂ inhalation (∼20% chamber volume/min), followed by cervical dislocation to confirm death. Procedures complied with AVMA 2020 and ARRIVE guidelines. 19
All animal experiments were approved by the Animal Ethical and Welfare Committee of Nanchang University (Approval No. NCULAE-20250509002).
Immunohistochemistry
Paraffin-embedded tissue sections were deparaffinized, rehydrated, and subjected to heat-induced antigen retrieval. Endogenous peroxidase activity was blocked with 3% H₂O₂, followed by blocking with 5% BSA. Sections were incubated overnight at 4 °C with primary antibodies against CCT3 (Santa Cruz, sc-271336; dilution:1:200) and Ki-67 (Servicebio,GB111499-100; dilution:1:500), followed by HRP-conjugated secondary antibodies. Signals were visualized using DAB, counterstained with hematoxylin, dehydrated, cleared, and mounted.
Statistical Analysis
Continuous variables are presented as mean ± standard deviation (SD) for parametric tests, or as median with interquartile range (IQR) for non-parametric tests. Categorical variables are expressed as frequency (%) with the corresponding statistical analyses performed using χ2 or Fisher's exact test. Correlation assessments were carried out utilizing Spearman's rank correlation coefficient. Receiver operating characteristic curves and the area under the curve were used to evaluate the diagnostic value of CCT3 and the common tumor markers. A p-value<0.05 was deemed statistically significant. All the analysis was conducted using SPSS version 26.0 and GraphPad Prism version 9.5.
Results
CCT3 is Overexpressed in NSCLC and SCLC
Utilizing GEO databases, a significantly elevated level of CCT3 mRNA was observed in lung adenocarcinoma (LUAD) (p < 0.0001) and small cell lung carcinoma (SCLC) (p < 0.001) tissues when compared to normal tissues (Figure 1A, B, E and F). Similarly, a marked increase in both CCT3 mRNA and protein levels was validated in lung squamous carcinoma (LUSC) and LUAD tissues using the TCGA database (p < 0.0001) (Figure 1C, D), and the Human Protein Atlas database (Figure 1H, 1I). Furthermore, CCT3 mRNA levels were significantly higher in patients with stage IV LUAD and stage III LUSC compared to those at stage I (p < 0.001) and stages I-II cases, respectively (p < 0.001). Additionally, elevated levels of CCT3 mRNA and protein were detected in non-small cell lung cancer cell lines NSCLC H1703 and SCLC lines DMS114, H446, and H1048 when compared to the normal bronchial epithelial cell line BEAS-2B (p < 0.0001) (Figure 1G), with the exception of the A549 cell line. To determine the subcellular distribution of CCT3, immunofluorescence staining was performed in NCI-H1703 and NCI-H446 cells using antibodies against CCT3 and the membrane marker Pan-Cadherin. The results showed that CCT3 was predominantly localized in the cytoplasm and did not colocalize with Pan-Cadherin on the cell membrane, indicating the absence of membrane-associated CCT3 (Supplemental Figure 3A).
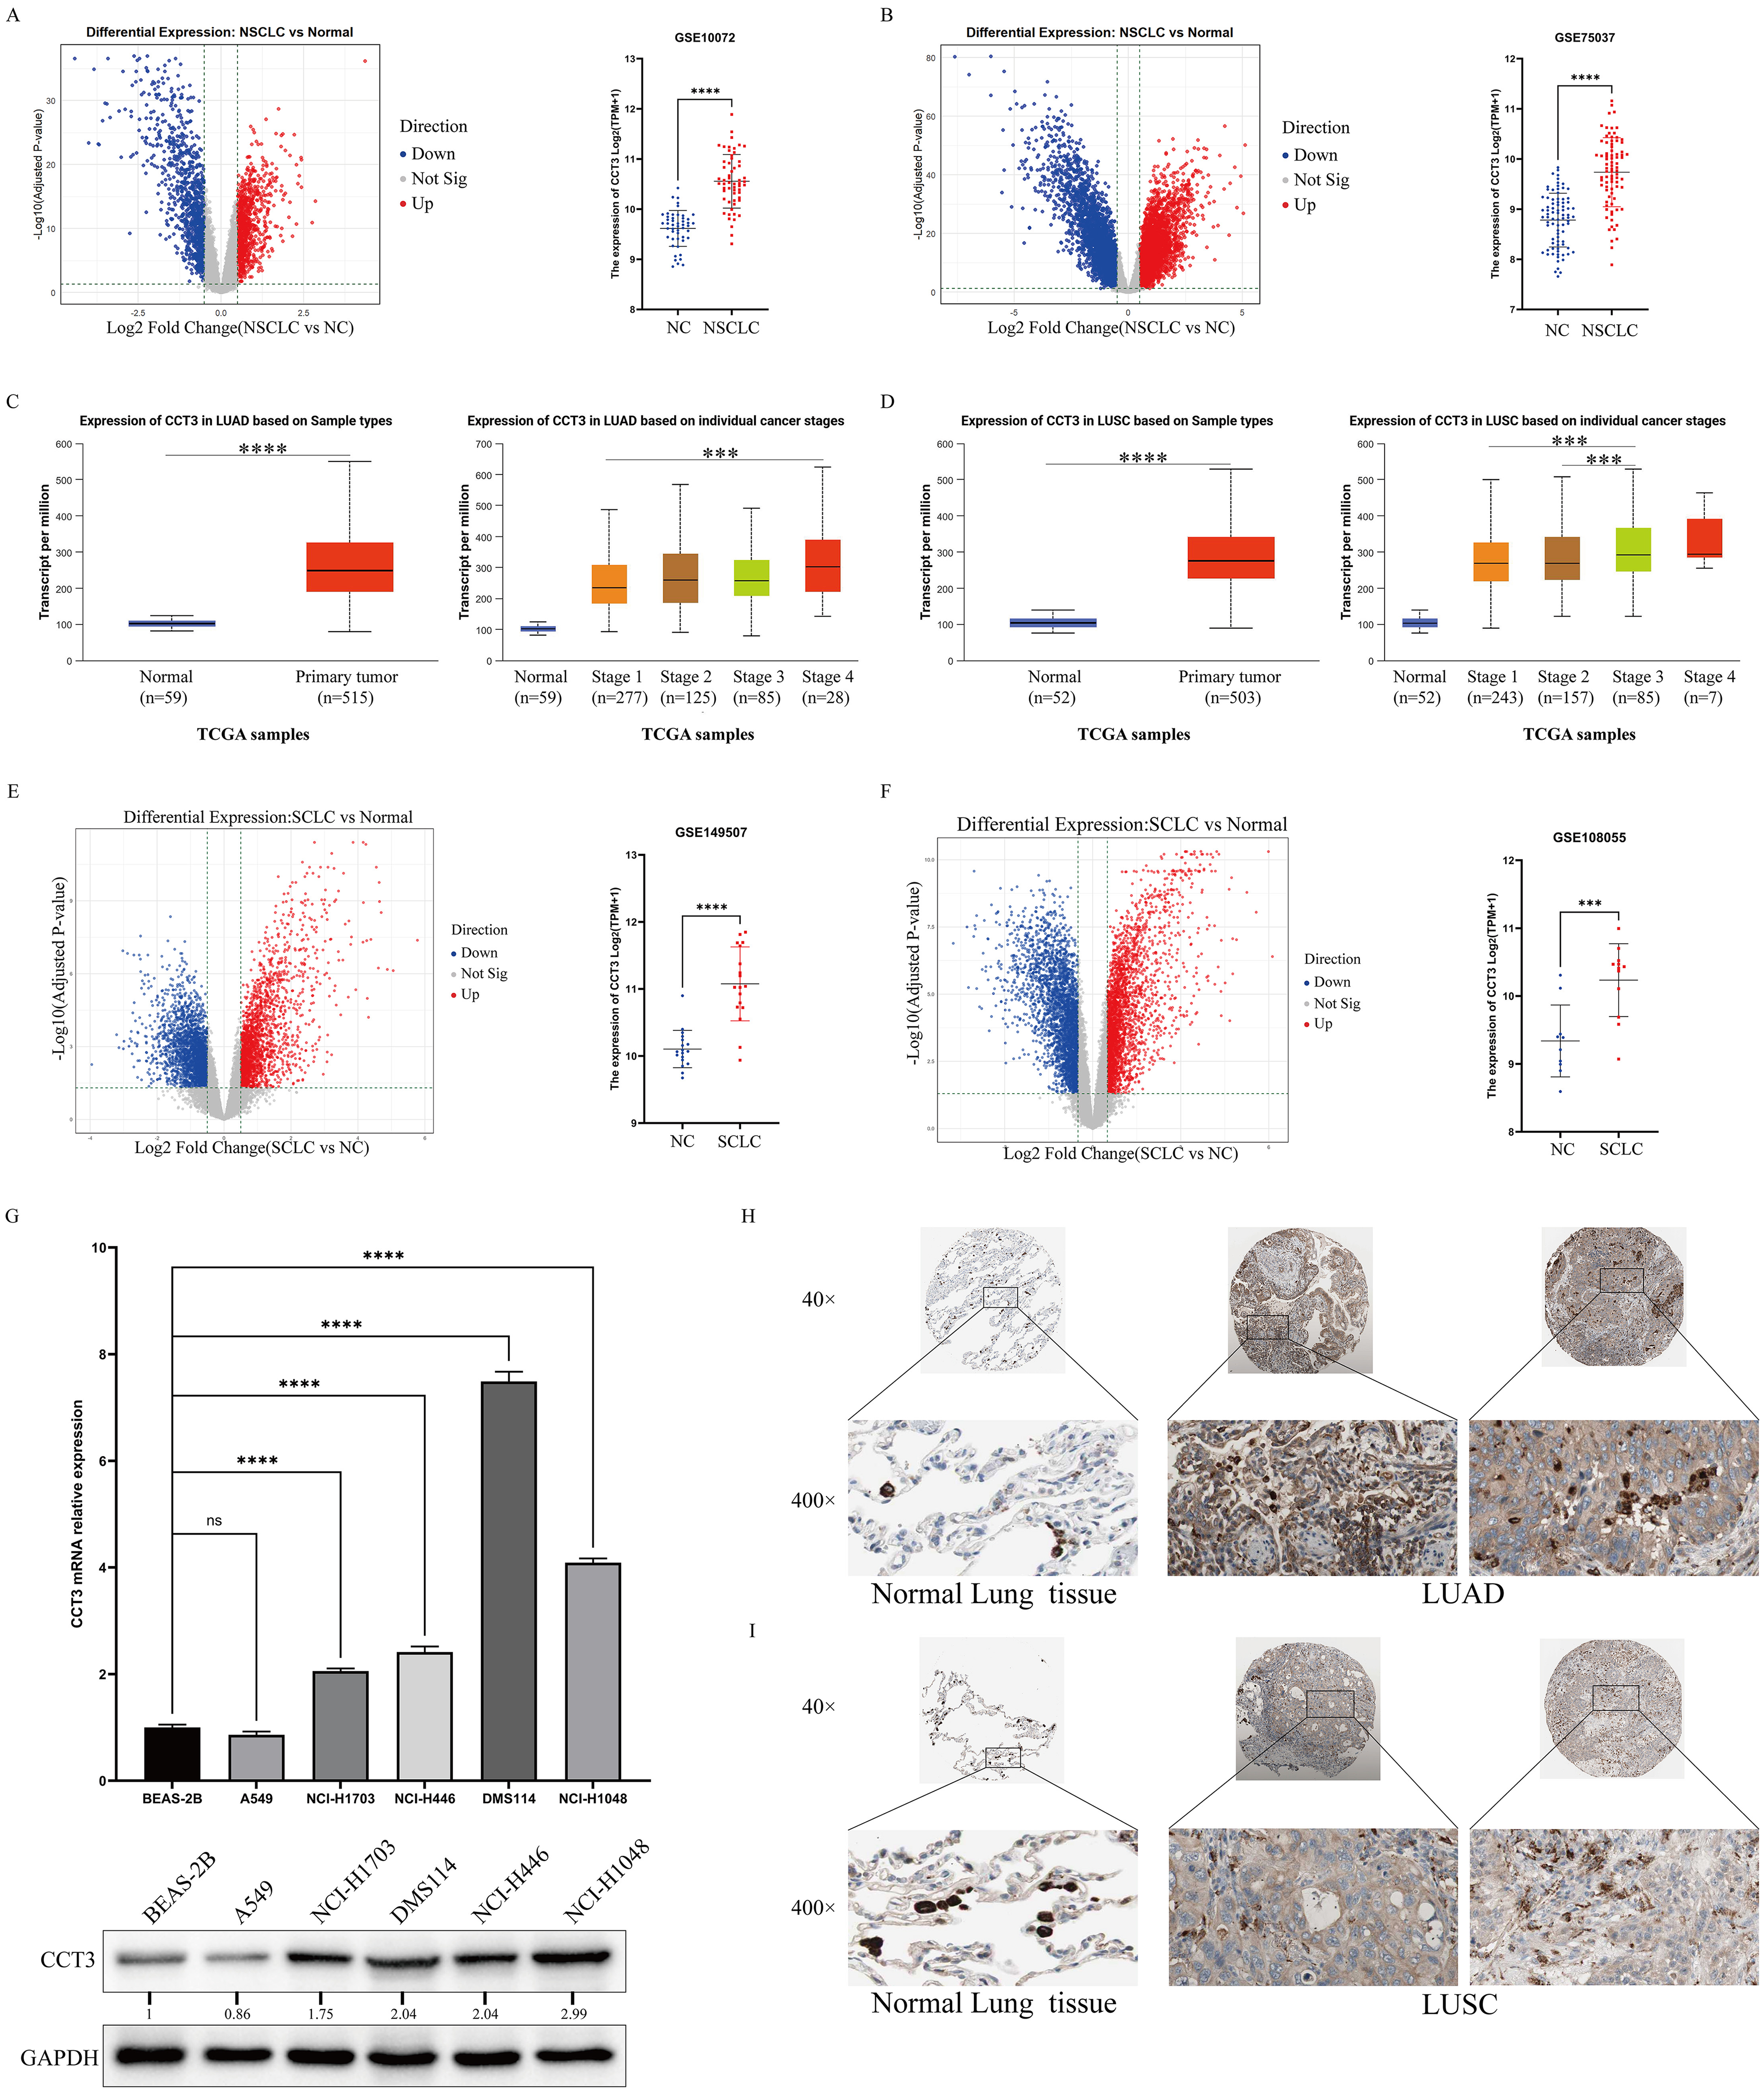
CCT3 is upregulated in lung cancer tissues and cell lines. (A–F) CCT3 expression in: (A,B) NSCLC (GSE10072, GSE19801), (C,D) TCGA-LUAD/LUSC (by stage), (E,F) SCLC (GSE40419, GSE30219) versus normal tissues (***P < 0.0001); (G) qPCR (left) and Western blot (right) of CCT3 in BEAS-2B versus lung cancer cell lines (GAPDH control, ***P < 0.0001, ns: not significant); (H,I) IHC staining of CCT3 in (H) LUAD and (I) LUSC tissues at 40×/400× magnification.
Overexpressed CCT3 Promotes the Malignant Phenotype in NSCLC and SCLC
To investigate the influence of CCT3 on malignant phenotypes in lung cancer cells, we selected the H1703 and DMS114, H446 cell lines for functional experiments. We designed three small interfering RNAs (siRNAs) specifically targeting CCT3, along with an overexpression plasmid. Validation through qRT-PCR and Western blotting confirmed that si_CCT3#1 and si_CCT3#2 achieved significant knockdown efficiency across all three cell lines; therefore, these siRNAs were chosen for subsequent experiments (Supplemental Figure 2A to C). Assessment of proliferative capacity through CCK-8 and colony formation assays revealed that the knockdown of CCT3 significantly diminished both the proliferation rate and the number of colonies formed in H1703, DMS114, and H446 cell lines (p < 0.0001). Conversely, overexpression of CCT3 markedly enhanced proliferative activity across all three cell lines (p < 0.0001) (Figure 2A, B). Transwell assays demonstrated that CCT3 knockdown substantially reduced the number of migrating and invading cells in all three cell lines (p < 0.0001). In contrast, overexpression of CCT3 significantly promoted cell migration and invasion (p < 0.0001) (Figure 2C).

Effects of CCT3 modulation on proliferation, colony formation, and metastasis of lung cancer cells. (A–C) Cell proliferation (CCK-8, A), colony formation (B, images and quantification), and migration/invasion (Transwell, C, images and quantification) in NCI-H1703, DMS114, and NCI-H446 cells transfected with control siRNA (NC), CCT3-targeting siRNAs (si-CCT3#1, si-CCT3#2), empty vector (Vector), or CCT3-overexpressing vector (OE-CCT3); (D) Representative images of xenograft tumors, (E) tumor volume quantification, (F) tumor weight measurement, and (G) IHC analysis of CCT3 and Ki67 expression in tumor tissues from BALB/c nude mice injected with control (shNC) or CCT3-knockdown (shCCT3) NCI-H446 cells; ***P < 0.001, ****P < 0.0001 versus respective controls (NC for siRNA, Vector for OE-CCT3).
Considering the endogenous expression levels of CCT3 across lung cancer cell lines, we additionally overexpressed CCT3 in the low-expressing A549 cell line to further validate its oncogenic role. Consistent with findings in other models, CCT3 overexpression significantly promoted A549 cell proliferation, as evidenced by CCK-8 and colony formation assays (Supplemental Figure 3B, C). Moreover, CCT3 overexpression enhanced the migratory and invasive abilities of A549 cells (Supplemental Figure 3D), reinforcing the protumorigenic function of CCT3 in NSCLC.
Previous studies have established the involvement of CCT3 in the tumorigenesis of NSCLC. 18 However, the oncogenic role of CCT3 in SCLC remains insufficiently characterized. Based on our in vitro findings, we developed a xenograft model utilizing the SCLC-derived NCI-H446 cell line with stable knockdown of CCT3. Prior to animal experiments, Western blotting confirmed that the constructed lentiviral shCCT3 vector efficiently reduced CCT3 protein expression (Supplemental Figure 4A). In vivo, CCT3 knockdown markedly inhibited subcutaneous tumor growth compared with the shNC group, resulting in significantly smaller tumor volumes and reduced tumor weights (p < 0.01). Immunohistochemical analysis further demonstrated that knockdown of CCT3 substantially decreased Ki67 staining intensity, indicating a suppressed proliferative capacity in vivo (Figure 2D to G).
CCT3 Induces EMT and Activates the PI3K-AKT Signaling Pathway
To elucidate the malignant behavior mediated by CCT3, we employed bioinformatics to identify relevant regulatory pathways. A CCT3-centered PPI network was constructed using STRING. GO and KEGG analyses revealed that the interacting proteins were significantly enriched in: Biological Processes (chaperone-mediated protein folding, telomere maintenance, cell cycle-related RNA metabolism); Cellular Components (cytoplasm, stress granules, chaperonin-containing complexes); and Molecular Functions (unfolded protein binding, ATPase/RNA binding). KEGG analysis highlighted an enrichment of the PI3 K/AKT signaling pathway (Figure 3A, B).

Exploration of CCT3-interacting proteins and downstream signaling pathways in lung cancer. (A) CCT3 protein-protein interaction network (STRING database prediction, Cytoscape visualization; nodes: proteins, edges: interactions); (B) GO enrichment (biological process, cellular component, molecular function) and KEGG pathway analysis of CCT3-interacting proteins (significant enrichment in PI3K-AKT pathway highlighted); (C–E) Western blot analysis of PI3K-AKT pathway components (p-PI3 K, PI3 K, p-AKT, AKT) and EMT markers (N-cadherin, E-cadherin, Vimentin) in NCI-H1703 (C), DMS114 (D), and NCI-H446 (E) cells transfected with control siRNA (NC), CCT3-targeting siRNAs (si-CCT3#1–#2), empty vector (Vector), or CCT3-overexpressing vector (OE-CCT3) (GAPDH loading control).
Given the enrichment of the PI3 K/AKT signaling pathway, we hypothesized that CCT3 promotes lung cancer progression by modulating this pathway. For this, we conducted molecular experiments in H1703, DMS114, and H446 cell lines with knockdown or overexpression of CCT3. Results of Western blotting showed that CCT3 knockdown significantly decreased the protein levels of phosphorylated PI3 K (p-PI3 K) and phosphorylated AKT (p-AKT), while total PI3 K (t-PI3 K) and total AKT (t-AKT) levels remained stable. Conversely, CCT3 overexpression led to an upregulation of p-PI3 K and p-AKT levels, with t-PI3 K and t-AKT levels remaining unchanging (Figure 3C to E).
As the PI3 K/AKT pathway is a well-established regulator of EMT, and in light of our findings that CCT3 modulates PI3 K/AKT phosphorylation, we sought to determine whether CCT3 influences EMT through this pathway. Analysis of key EMT markers demonstrated that knockdown of CCT3 significantly elevated the expression levels of the epithelial marker E-cadherin, while concurrently reducing the expression levels of mesenchymal markers N-cadherin and Vimentin (Figure 3C to E), whereas CCT3 overexpression produced the opposite effects. To further clarify the upstream regulatory layer, we assessed key EMT-related transcription factors (EMT-TFs). RT-PCR analysis showed that CCT3 knockdown significantly reduced SNAI1 expression in all three cell lines, while ZEB1 and TWIST1 remained largely unchanged (Supplemental Figure 4B). Accordingly, both CCT3 knockdown and overexpression resulted in corresponding downregulation or upregulation of SNAI1 at the protein level (Supplemental Figure 4C to H).
Activation of PI3 K/AKT Signaling Rescues the Malignant Phenotypes Induced by CCT3
To further substantiate the pivotal role of the PI3 K/AKT pathway in CCT3-mediated malignant phenotypes, a rescue assay was conducted. The PI3K-specific activator 740Y-P was administered to H1703, DMS114, and H446 cell lines with down-regulated CCT3. Compared to the si_CCT3 group, the si_CCT3 + 740Y-P group exhibited markedly enhanced proliferation rates and increased colony formation numbers in both CCK-8 and colony formation assays (p < 0.0001) (Figure 4A, B), approaching levels comparable to those of the NC group. Transwell assays indicated that the number of migrating and invading cells in the si_CCT3 group significantly increased following treatment with 740Y-P compared to si_CCT3 alone (p < 0.0001) (Figure 4C). Meanwhile, the si_CCT3 + 740Y-P group exhibited a significantly restored expression of p-PI3 K and p-AKT when compared to the si_CCT3 group, while total levels of PI3 K and AKT remained stable. Concurrently, N-cadherin and Vimentin were upregulated, whereas the epithelial marker E-cadherin was downregulated in the si_CCT3 + 740Y-P group, and the molecular shift corresponded with phenotypic recovery following pathway reactivation (Figure 5A to C). Moreover, treatment with the PI3 K/AKT activator 740Y-P restored SNAI1 expression following CCT3 knockdown (Supplementary Figure 4I to K)

Rescue assays confirm PI3K-AKT signaling mediates CCT3-regulated lung cancer cell phenotypes. (A) CCK-8 proliferation curves, (B) colony formation (images and quantification), and (C) migration/invasion (Transwell, images and quantification) in NCI-H1703, DMS114, and NCI-H446 cells transfected with control siRNA (NC), CCT3-targeting siRNA (si_CCT3), or si_CCT3 plus PI3 K agonist 740Y-P (si_CCT3 + 740Y-P); ****P < 0.0001 for si_CCT3 versus NC or si_CCT3 + 740Y-P versus si_CCT3.

CCT3-related functional validation, clinical significance, and mechanistic insights in lung cancer. (A–C) Western blot analysis of PI3 K - AKT pathway proteins (p-PI3 K, PI3 K, p-AKT, AKT) and EMT markers (N-cadherin, E-cadherin, Vimentin) in (A) NCI - H1703, (B) DMS114, and (C) NCI - H446 cells transfected with NC, si_CCT3, or si_CCT3 + 740Y - P. (D–F) Serum CCT3 concentrations in normal controls (NC), pulmonary nodules (PN), non-small cell lung cancer (NSCLC), and small cell lung cancer (SCLC) (**P < 0.01, ***P < 0.001, ****P < 0.0001); CCT3 levels in (E) NSCLC and (F) SCLC patients stratified by tumor stage (I–IV) and lymph node metastasis (N0 vs N1). (G–J) ROC curves: (G) CCT3 alone for PN/NSCLC/SCLC diagnosis; (H–I) Other tumor markers (eg, CEA, NSE) for NSCLC and SCLC diagnosis, respectively; (J) CCT3 combined with other markers for NSCLC/SCLC diagnosis. (K) Bootstrap internal validation (1000 iterations) for the CCT3 diagnostic model. (L–M) Decision-curve analysis (DCA) evaluating the net clinical benefit of CCT3-based models across different threshold probabilities for (L) NSCLC and (M) SCLC. (N) Schematic model summarizing the role of CCT3 in promoting lung cancer proliferation and metastasis via activation of the PI3K-AKT pathway and induction of epithelial-mesenchymal transition (EMT), integrating experimental and clinical findings.
To further confirm pathway dependency, we inhibited PI3 K/AKT signaling under CCT3-overexpressing conditions using the specific inhibitor BYL719. BYL719 effectively blocked the CCT3-induced increase in p-AKT (Supplemental Figure 5A to C), reversed EMT marker changes by decreasing N-cadherin and Vimentin while elevating E-cadherin (Supplemental Figure 5D to F), and suppressed the upregulation of SNAI1 induced by CCT3 overexpression (Supplemental Figure 4L to N). Together, these findings strongly demonstrate that CCT3 drives EMT and malignant behaviors primarily through PI3 K/AKT-dependent regulation of SNAI1.
Circulating CCT3 as a Novel Complementary Biomarker for NSCLC and SCLC
Previous studies showed circulating detectable concentration of CCT3 could effectively distinguish hepatocellular carcinoma, the benign disease and healthy participants.14,15 So,we investigated its diagnostic value in 237 NC individuals, 88 individuals with PN, 295 NSCLC patients, and 94 SCLC cases. The baseline characteristics of four group are described in Table 1. The highest serum CCT3 was detected in NSCLC group, which was significantly higher than that in SCLC patients (P < 0.01) (Figure 5D). Moreover, circulating CCT3 within SCLC group was obviously higher than that in either PN or NC subgroups (p < 0.001). CCT3 exhibited a positive correlation with clinical stage as well as lymph node metastasis in NSCLC. However, it correlated solely with clinical stage in SCLC (Figure 5E,F).
Baseline Characteristics of Normal, PN, NSCLC, and SCLC Groups.

Note: a:compared to the Control group, P < 0.0001; b:Compared with the PN group, P < 0.0001; c:Compared with the NSCLC group, P < 0.0001; a':compared to the Control group, P < 0.01; b':Compared with the PN group, P < 0.01; c':Compared with the NSCLC group, P < 0.01; b’':Compared with the NSCLC group, P < 0.001
Median (IQR); n (%)
Kruskal-Wallis rank sum test
ROC curve analysis was performed to evaluate the diagnostic efficacy of CCT3. Detailed information regarding the sensitivity and specificity for both individual markers and their combinations are described in Table 2. As shown in Figure 5G, circulating CCT3 levels differentiated between NSCLC and PN patients, yielding an AUC of 0.8731, with a sensitivity of 62.71% and a specificity of 98.86%. In distinguishing SCLC from PN, the AUC was found to be 0.7440, demonstrating a sensitivity of 41.49% and perfect specificity at 100%, which was significantly superior to NSE (p < 0.05). Integration of CCT3 and CYFRA21-1 improved sensitivity to 66.10% while maintaining high specificity at 97.73% in differentiating NSCLC from PN, resulting in an AUC of 0.857. Similarly, the combination of CCT3 and proGRP achieved a sensitivity rate of 65.96% alongside high specificity at 97.73% for distinguishing SCLC from PN, yielding an AUC value of 0.859 (Figure 5G to J).
Diagnostic Performance of CCT3 and Other Biomarkers in Distinguishing PN, NSCLC, and SCLC.

To further assess the robustness of the diagnostic performance of circulating CCT3 and to minimize the risk of cohort-specific bias, we conducted bootstrap internal validation (1000 iterations). The bootstrapped AUCs for NSCLC versus PN and SCLC versus PN remained highly consistent with the original estimates, indicating good model stability (Figure 5K). In addition, decision-curve analysis (DCA) was performed to evaluate the net clinical benefit across different risk thresholds. For NSCLC, CCT3 alone and the CCT3 + CYFRA21-1 combination both demonstrated clear net benefit compared with either treat-all or treat-none strategies, particularly within clinically relevant threshold ranges (Figure 5L). Similarly, for SCLC, both CCT3 alone and the CCT3 + proGRP model yielded superior net benefit compared with default strategies (Figure 5M). These results collectively support the clinical utility and robustness of circulating CCT3 as a complementary diagnostic biomarker.
Discussion
Lung cancer progression is characterized by complex mechanisms, and current diagnostic biomarkers exhibit significant limitations.20,21 Emerging technologies, such as self-assembled DNA nanosphere–based platforms for circulating tumor cell detection and macrophage-mediated targeted nanomedicine delivery, further emphasize the clinical need for biomarkers with robust molecular, functional, and translational relevance.22,23 In this context, our study systematically demonstrates that CCT3 is aberrantly overexpressed in both NSCLC and SCLC, functionally promoting malignant phenotypes such as proliferation, migration, and invasion. Immunofluorescence confirmed that CCT3 is localized in the cytoplasm rather than the plasma membrane, suggesting intracellular functional mechanisms rather than membrane-associated signaling. Mechanistically, CCT3 activates the PI3 K/AKT signaling pathway to upregulate N-cadherin and Vimentin while downregulating E-cadherin, thereby facilitating malignant phenotypes within NSCLC and SCLC cell lines. Clinically, the AUC values of circulating CCT3 for distinguishing NSCLC and SCLC from benign pulmonary nodules are 0.87 and 0.74, respectively.
It is well established that NSCLC and SCLC exhibit distinct pathological characteristics and mechanisms of carcinogenesis. NSCLC originates from bronchial or alveolar epithelial cells, characterized by slower growth rates, whereas SCLC arises from pulmonary neuroendocrine cells, displaying rapid growth and high invasiveness.24–26 However, accumulating evidence suggests that these two specific diseases share common oncogenes and underlying molecular mechanisms. 27 SOX2 and ILF2 has been identified and validated as an oncogene of the onset of both NSCLC and SCLC.28–30 Shapiro et al 31 found that cell cycle-related proteins (including cyclin D1, cdk4, retinoblastoma susceptibility protein (Rb), and p16) are common regulatory proteins in both NSCLC and SCLC. Additionally, Ekedahl et al 32 reported that the expression of stress-inducible heat shock proteins (HSPs), a type of molecular chaperones, is associated with ionizing radiation-induced apoptosis in lung carcinoma cell lines including NSCLC and SCLC. In our study, we conducted a comprehensive analysis of CCT3 expression across these two subtypes and discovered significantly elevated mRNA and protein levels of CCT3 in both NSCLC and SCLC using data from TCGA, GEO, as well as relevant cell lines. Notably, elevated CCT3 expression was robustly associated with advanced clinical stages: in LUAD, patients at stage IV exhibited markedly higher CCT3 mRNA levels compared to those at stage I (p < 0.001); in LUSC, stage III cases showed significantly increased CCT3 mRNA levels relative to stages I–II (p < 0.001). These findings, together with the observed overexpression of CCT3 in SCLC tissues, collectively underscore that heightened CCT3 expression is linked to more aggressive disease phenotypes in NSCLC and may play a pro-tumorigenic role in SCLC, aligning with its putative oncogenic function. Importantly, the two subtypes share pathogenic features beyond CCT3, including common lipid metabolism perturbations—such as pro-inflammatory fatty acid profiles, elevated specific n-6 polyunsaturated fatty acids, and increased Δ6 desaturase activity—supporting shared progression mechanisms, with CCT3 likely acting as a key contributor. 33 Furthermore, results from in vitro experiments demonstrated that shCCT3 effectively inhibited proliferation, migration, and invasion in both NSCLC and SCLC cell lines. Conversely, overexpression of CCT3 promoted malignant phenotypes within these cell lines. The subcutaneous tumorigenic experiments further confirmed CCT3 could regulate tumor volume and proliferation. These findings illustrate that CCT3 functions similarly as an oncogene in both NSCLC and SCLC.
Several studies have reported the potential mechanisms by which CCT3 contributes to the progression of NSCLC. Overexpression of CCT3 sustains glycolytic activity, thereby driving disease progression. 17 Additionally, it promotes cell survival by inhibiting SLC7A11-mediated ferroptosis while simultaneously accelerating tumor growth through activation of the AKT pathway. 34 In our study, PPI network analysis indicated that CCT3 interacts with proteins HSPA8 and HSP90AB1. GO and KEGG analyses suggested that PI3 K/AKT signaling may represent a downstream pathway influenced by CCT3. Previous research has confirmed that aberrant activation of the PI3 K/AKT pathway is associated with lung cancer progression.35–37 This phosphorylation-dependent activation releases suppression on EMT transcription factors, facilitating the epithelial-to-mesenchymal switch.38–40 Our molecular assays confirmed that CCT3 selectively regulates the phosphorylation of PI3 K and AKT without altering total protein levels, consistent with an activation model. Downstream, CCT3 modulates the EMT switch, increasing N-cadherin and Vimentin while suppressing E-cadherin. Importantly, we expanded EMT evaluation beyond classical markers to include transcription factors. CCT3 knockdown significantly reduced SNAI1—but not ZEB1 or TWIST1—at both mRNA and protein levels, establishing SNAI1 as a primary EMT-TF responsive to CCT3. Rescue experiments further strengthened causal inference: the PI3 K activator 740Y-P fully restored p-AKT, EMT marker expression, SNAI1 levels, and malignant phenotypes in CCT3-silenced cells; conversely, the PI3 K inhibitor BYL719 reversed CCT3-driven AKT activation, EMT, and SNAI1 upregulation. These complementary gain- and loss-of-function interventions collectively demonstrate that the CCT3–SNAI1 axis is critically dependent on PI3 K/AKT signaling. These results indicate that CCT3 specifically drives both NSCLC and SCLC progression by modulating phosphorylation-dependent activation of the PI3 K/AKT pathway to induce EMT, ultimately leading to increased proliferation and metastasis of these diseases.
Clinically, common tumor biomarkers such as NSE, proGRP, and CYFRA21-1 are utilized to differentiate subtypes of lung cancer and predict disease prognosis; however, their effectiveness is limited in screening and early diagnosis of either NSCLC or SCLC.41,42 In this study, CCT3 demonstrated an AUC of 0.873 for distinguishing NSCLC from PN, with a specificity of 98.86%, surpassing conventional biomarkers like CYFRA21-1 and others. For differentiating SCLC from PN, the AUC was initially 0.744 but improved to 0.859 when combined with proGRP. To assess the robustness of our diagnostic models, we performed an internal validation using 1000 bootstrap iterations, which confirmed the stability of the AUC estimates. Furthermore, to evaluate clinical utility, decision-curve analysis demonstrated a meaningful net benefit across a broad range of threshold probabilities. These analyses collectively support the potential of CCT3 as a stable and complementary serum biomarker. Beyond its diagnostic value, CCT3 displayed differential clinical associations across tumor types: in NSCLC, CCT3 correlated with both lymph node metastasis and stage, whereas in SCLC, the association was restricted to clinical stage. This divergence may reflect intrinsic differences in tumor biology between NSCLC and SCLC or distinct contexts in which CCT3 participates in disease progression.
Overall, these results collectively demonstrate that CCT3 promotes the malignant progression of both NSCLC and SCLC through PI3 K/AKT-mediated EMT induction, while its release into the bloodstream enables its use as a serum biomarker. This integrated molecular and translational mechanism is summarized in the schematic model (Figure 5N).
The following limitations must be addressed to comprehensively understand of the role of CCT3 in NSCLC and SCLC.First, although BEAS-2B is widely used as a non-malignant bronchial epithelial comparator, it is SV40-immortalized and may harbor genomic instability. To mitigate this, we interpreted BEAS-2B-related findings cautiously and ensured that all mechanistic conclusions were validated across three lung cancer cell lines and further confirmed through both knockdown and overexpression models. Second, this diagnostic study utilized a single-center cohort, which may introduce selection or spectrum bias. Although bootstrap validation and decision-curve analysis supported the robustness of our findings, potential confounders were minimized through predefined exclusion criteria, including inflammatory conditions, hepatic/renal dysfunction, and hemolyzed specimens. Nevertheless, multicenter prospective studies across diverse populations are required to further establish the diagnostic utility and generalizability of serum CCT3. Third, the in vivo experiments used a subcutaneous xenograft model based on a single SCLC cell line without metastasis or orthotopic validation. Future work should incorporate orthotopic, metastatic, or patient-derived xenograft (PDX) models to better characterize CCT3-mediated tumor progression and metastatic behavior. Finally, upstream regulators of CCT3 remain unclear. Identifying transcriptional, epigenetic, or post-transcriptional mechanisms that control CCT3 expression will be essential for understanding its integration into lung cancer signaling networks.
Conclusion
CCT3 contributes to progression of NSCLC and SCLC through the PI3 K/AKT-EMT axis, and it serves as an effective and complementary biomarker for these diseases.
Supplemental Material
sj-docx-1-tct-10.1177_15330338251412203 - Supplemental material for CCT3 Facilitates the Malignant Progression of NSCLC and SCLC via PI3 K/AKT-EMT Axis and Emerges as a Novel Serum Diagnostic Biomarker
Supplemental material, sj-docx-1-tct-10.1177_15330338251412203 for CCT3 Facilitates the Malignant Progression of NSCLC and SCLC via PI3 K/AKT-EMT Axis and Emerges as a Novel Serum Diagnostic Biomarker by Guobin Song, Kexin Han, Lin Xiang, Tian Peng, Hailong Chen, Anqi Tang, Yanan Li, Tianqi Lan, Houqun Ying and Xuexin Cheng in Technology in Cancer Research & Treatment
Footnotes
List of Abbreviations
Acknowledgments
This work was supported by the National Natural Science Foundation of China (Grant Nos. 82360416 and 82460545), the Funding Program of the Second Affiliated Hospital of Nanchang University (Grant No. 2022efyA02), and the Graduate Innovation Special Fund Project of Jiangxi Province (Grant No. YC2024-B042).
We gratefully acknowledge Dr Ziran Wang (Department of Clinical Laboratory, Peking Union Medical College Hospital) for his critical review of the manuscript and insightful scientific suggestions.
Ethics Declarations
Animal ethics
All animal procedures were approved by the Animal Ethical and Welfare Committee of Nanchang University (Approval No. NCULAE-20250509002) and were conducted in accordance with institutional and national guidelines for the care and use of laboratory animals. Euthanasia was performed by CO₂ inhalation. These procedures were carried out in accordance with the American Veterinary Medical Association (AVMA) Guidelines for the Euthanasia of Animals. This study is reported in compliance with the ARRIVE guidelines.
Ethics Approval and Consent to Participate
The protocol for the use of human serum samples in this study was reviewed and approved by the Biomedical Research Ethics Committee of the Second Affiliated Hospital of Nanchang University (Approval No. O-2024161). The requirement for written informed consent was formally waived by the aforementioned Ethics Committee due to the retrospective and anonymized nature of the research. All procedures involving human participants were performed in accordance with the Declaration of Helsinki.
Author Contribution
Guobin Song, Kexin Han, and Lin Xiang: Writing – original draft. Guobin Song and Lin Xiang: Data curation, Visualization, Validation. Kexin Han: Formal analysis, Investigation. Tian Peng, Hailong Chen, Anqi Tang, Yanan Li, and Tianqi Lan: Formal analysis, Investigation, Methodology. Tian Peng: Visualization. Houqun Ying and Xuexin Cheng: Conceptualization, Funding acquisition, Project administration, Supervision. All authors participated in Writing – review & editing.
Funding
The authors disclosed receipt of the following financial support for the research, authorship, and/or publication of this article: This work was supported by the Graduate Innovation Special Fund Project of Jiangxi Province, National Natural Science Foundation of China, Funding Program of the Second Affiliated Hospital of Nanchang University, (grant number YC2024-B042, 82360416 and 82460545, 2022efyA02).
Declaration of Conflicting Interests
The authors declared no potential conflicts of interest with respect to the research, authorship, and/or publication of this article.
Data Availability
The full uncropped Western blot images generated in this study have been provided as Supplementary Information files. All other datasets used and/or analyzed during the current study are available from the corresponding author upon reasonable request.
Supplemental Material
Supplemental material for this article is available online.
References
Supplementary Material
Please find the following supplemental material available below.
For Open Access articles published under a Creative Commons License, all supplemental material carries the same license as the article it is associated with.
For non-Open Access articles published, all supplemental material carries a non-exclusive license, and permission requests for re-use of supplemental material or any part of supplemental material shall be sent directly to the copyright owner as specified in the copyright notice associated with the article.