
Abstract
Introduction
Ovarian cancer is a major global concern. Due to late detection, it is one of the few malignancies for which the five-year survival rate continues to be low without appreciable improvement in recent decades. Screening methods are needed that non-invasively, without ionizing radiation, detect early-stage ovarian cancer with clear distinction from benign lesions. Magnetic resonance spectroscopy (MRS) could be a key contributor to early ovarian cancer detection, insofar as data analysis and interpretation after appropriate signal processing are implemented.
Methods
The derivative non-parametric and parametric fast Padé transform (dFPT) and the derivative fast Fourier transform (dFFT: optimized, unoptimized) are applied to proton MRS time signals encoded from the ovary. These include in vivo MRS for a borderline cyst, and in vitro MRS for serous cystic adenoma and serous cystic adenocarcinoma.
Results
On a broad chemical shift axis (aliphatic and aromatic), over 300 thin, clearly-delineated peaks are baseline-resolved and displayed in a readily amenable form for clinical interpretation. This is from the in vivo encoding. Clearly quantifiable peaks include cancer biomarkers: total choline components (phosphocholine, glycerophosphocholine, free choline) and the lactate doublet, as well as other diagnostically-relevant metabolites in spectrally-crowded regions. Concordance among three algorithms (parametric and non-parametric dFPT as well as optimized dFFT) provides cross-validation, essential for clinical trustworthiness of derivative MRS.
Conclusion
With these results that help benchmark derivative MRS for clinical applications in oncology, the time is deemed ripe to implement the stated advances. More effective early detection of ovarian cancer should be among the most urgent priorities for this upgrade.
Keywords
Introduction
Ovarian cancer is a major global concern, associated with approximately 207 000 deaths worldwide among women in 2020 alone. 1 It is one of the few malignancies for which the 5-year survival rate continues to be low and has not appreciably improved in recent decades. 2 The diagnosis of ovarian cancer is usually made at the late stages associated with advanced disease and poor prognosis.3,4 Yet, if the cancer is detected at the early stage when confined to the ovary, the prognosis is excellent (90% or even higher 5-year survival). 2
The crux of the problem is the lack of accurate early detection methods. The usual screening procedures are transvaginal ultrasound (TVUS) and serum cancer antigen (CA-125). However, large randomized trials indicate that screening with CA-125 and TVUS for ovarian cancer in women without increased familial risk does not significantly reduce mortality due to this malignancy.5,6 Moreover, screening with TVUS and CA-125 is associated with a large percentage of false positive findings. One of the deleterious consequences is that many women undergo surgical intervention to remove benign ovarian lesions. 5 The overall conclusion is: “given that screening did not significantly reduce ovarian and tubal cancer deaths, general population screening cannot be recommended” (p. 2182). 6
Women at high ovarian cancer risk often undergo screening with CA-125 and TVUS, although prospective evidence is lacking regarding successful early detection. 7 For women at very high ovarian cancer risk, eg carriers of deleterious BRCA mutations, bilateral salpingo-oophorectomy has been recommended. This recommendation was made by the U.S. National Comprehensive Cancer Network for women 35–40 years of age who have completed childbearing. 8 Although salpingo-oophorectomy does, obviously, protect against ovarian cancer, it is associated with many adverse consequences. 9 In this light, the need for truly “personalized” assessment has been underscored for patients considered to fall into the high-risk category. 10 Screening methods that non-invasively detect early-stage ovarian cancer on a molecular level with clear distinction from benign lesions would be a welcome advance. 4
Magnetic Resonance Spectroscopy — Possibilities for Timely Ovarian Cancer Detection
For well over two decades now, 11 magnetic resonance spectroscopy (MRS) has been suggested as a candidate for early ovarian cancer detection. The reasons include non-invasiveness, complementarity to anatomic imaging for potentially identifying metabolic features of cancer, and lack of exposure to ionizing radiation. However, the ovary is a small, moving organ, for which it is technically difficult for MRS to encode good quality time signals or free induction decay (FID) data. 12 With conventional processing of FIDs encoded by in vivo MRS, benign and malignant ovarian lesions have not been adequately distinguished. 13
Fundamental to MRS is signal processing which can respectively provide qualitative and quantitative information by shape and parameter estimations (viewed as two entirely separate categories). Without mathematics, the time domain data encoded in clinical scanners or via laboratory spectrometers are not directly interpretable. The equivalent representation of FIDs is the frequency domain which depicts spectra. The spectra are plotted as intensity versus frequency (chemical shift, expressed in parts per million, ppm). They display peaks or resonances assignable to molecules (called metabolites due to their involvement in cellular metabolism).
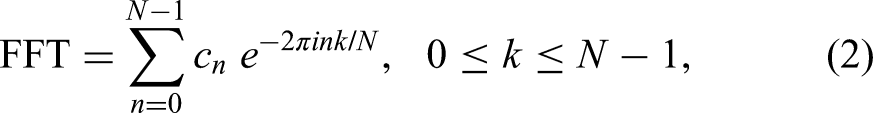
In clinical magnetic resonance (MR) scanners, signal processing is mainly done by the fast Fourier transform (FFT), a linear, low-resolution, non-parametric processor without noise suppression. Its spectrum is a single polynomial. It describes only a total shape spectrum or envelope, but not the components. Thus, the FFT, as a shape estimator, cannot autonomously generate the quantitative information needed to ascertain concentrations of cancer biomarkers and other metabolites of diagnostic interest. 14
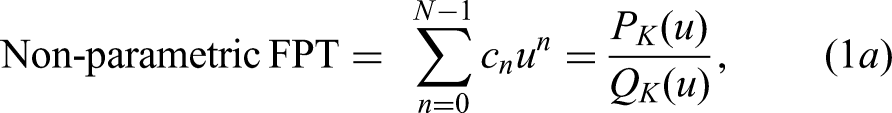
The fast Padé transform (FPT), an advanced, non-linear signal processor, provides high resolution with good signal to noise ratio (SNR). It can perform both shape and parameter estimations by the non-parametric and parametric FPT, respectively.14–20 In each version, the envelope spectrum is given by the ratio of two polynomials
As a single polynomial, the FFT describes the zeros of the spectrum. To describe poles, the FFT needs much constructive and destructive interference to counter the unattenuated sines and cosines. This requires long total acquisition time (denoted by T). Resolution in the FFT is predetermined by T, irrespective of the structure of the FID. In contrast, the FPT as the ratio of two polynomials describes both the spectral zeros and poles. This, in turn, retrieves the sought structure of the FID. The advantages of the FPT are better resolution and SNR, built-in quantification capabilities, as well as shorter T. The FPT is therefore more suitable than the FFT to describe spectra in MRS. Generally, functions with polar structure, as in the FPT, are the most frequently-employed mathematical models for spectra in inter-disciplinary research. 14
The parametric FPT yields densely-packed and often overlapping component peaks. Therein, prior to plotting, resonances are quantified by providing their parameters (position, widths, heights, phases, areas). These can be of diagnostic value, eg transverse relaxation time (inversely related to peak width) and peak area (proportional to metabolite concentration). These help characterize the tissue. The parametric FPT was established as a reliable and robust signal processor in MRS.13,14,21 This set the stage for the next steps aimed at clinical implementation.
Difficulties in MRS Impeding Fulfillment of the Main Diagnostic Expectations
The work of diagnosticians within oncology and radiology would be greatly facilitated if all the peaks in the given spectrum were visualized and quantified. Yet, the most vital clinical need is the trustworthiness of such information. Until recently, these two requisites seemed incompatible within MRS, especially for in vivo encoding at clinical magnetic field strengths (1.5, 3.0T). Shape estimators are not trustworthy. They yield only envelopes that do not accurately reflect the genuine presence and concentration of metabolites when the peaks are congested. Lineshapes from parametric estimation can be difficult to interpret visually when the reconstructed spectra are plotted. Namely, for FIDs encoded by MRS from eg the ovary, these resonances are very densely packed and overlapping. Clinical interpretation then becomes difficult.
A robust mathematical solution to this conundrum was developed by means of derivative signal processing. It was initially achieved through the derivative fast Padé transform (dFPT),22–24 and more recently via an optimized derivative fast Fourier transform (dFFT). 25 When derivative signal processing is used within MRS, this modality is termed derivative MRS.
Derivative MRS can Address Diagnosticians’ Needs
Slope changes in a spectral lineshape may point to hidden structures. Derivatives probe and then describe the slopes of lineshapes. The higher the derivative order, the more structure is revealed. By applying the derivative operator
The dFPT processes the originally encoded FID data points
The dFPT has passed rigorous benchmarking,22–24 including cross-checking between the parametric and non-parametric estimations with their full agreement. The magnitude mode for derivative lineshapes was found to best facilitate clinical interpretation. With non-derivative envelopes, the peaks are broadened in the magnitude mode compared to the absorption mode. However, as the derivative order
The question was raised as to whether the FFT could also yield further insights by its derivative version, ie
An optimized version of the dFFT was recently introduced by judiciously apodizing the FID. This is done by an attenuating exponential (or Gaussian) filter which must be adapted to the derivative order m and to the SNR of the encoded FID. By such a derivative-adapted optimization, quantitatively interpretable component spectra are generated with improved resolution and SNR. 25 This is achieved exclusively by shape estimation, and yet the sought quantitative information (parametrized component spectra) is provided. The mentioned sharp border between shape and parameter estimators is thereby erased.
Aim of the Present Study
Our goal is to offer a detailed, comprehensive view of how the dFPT and the optimized dFFT can be applied in the clinical setting within MRS to aid in diagnosing ovarian lesions. The particular focus is on conveying the results in such a way that physicians would be able to utilize derivative MRS in efforts to achieve timely and accurate detection of ovarian cancer.
Methods
The STARD checklist for reporting diagnostic accuracy studies has been thoroughly reviewed 27 together with the complementary presentation. 28 The pertinent STARD items are addressed herein.
Signal Processing
Non-Derivative Estimations
We use the Padé and Fourier estimations based on the non-derivative (FPT, FFT) and derivative (dFPT, dFFT) spectra. The FPT and FFT spectra are:

In Eq. (1b), the sum is the Heaviside partial fraction decomposition of
Once the peak parameters
The total number K reconstructed by the FPT contains both genuine
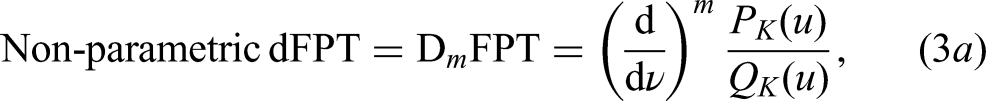
Derivative Estimations
To proceed further, we turn to derivative signal processing. The spectra in the dFPT and dFFT are:
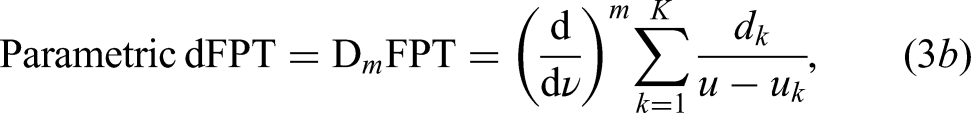

The peak positions, widths, heights, areas and metabolite concentrations retreived by the non-parametric dFPT are corroborated by the corresponding numerical data from the parametric dFPT. The latter is based on the exact solution of the quantification problem by the parametric FPT. In other words, the non-parametric dFPT resolves the FPT envelope into its genuine components. After the peak parameters are extracted from the derivative lineshape, they are mapped to their non-derivative counterparts
In the unoptimized dFFT from Eq. (4), the FID is weighted by the time power function
The resolution-SNR problem in the unoptimized dFFT is solved through apodizing the function


Parameter
Both the dFPT and optimized dFFT can be obtained for any derivative order m by comparable computer time. Stability of the derivative lineshapes for succesively increased derivative order
The results for the optimized dFFT can come straight from every MR clinical scanner and laboratory spectrometer. The time-domain filters of the exponential and Gaussian damping forms are already present in the software of these MR instruments. Thus, all that is needed is to raise these filters (with the damping mechanistically specified in (6)) to the power m and to multiply the outcomes by the time monomial
In the dFPT, the polynomial ratio
Time Signals Encoded by Proton MRS
Herein, the results are presented by applying derivative estimations to MRS data for a borderline serous cystic ovarian tumor from in vivo encoding on a 3T Magnetom Tim Trio scanner. Also presented are the results for benign (serous cystadenoma), and malignant (serous cystadenocarcinoma) ovarian fluid samples from in vitro encoding on a 600 MHz (14.1T) Bruker spectrometer. All diagnoses were histopathologically confirmed. The Regional Ethics Committee stated that they found no ethical issues to preclude implementation of this research.
For 3T, the in vivo encoded FIDs contained 1024 complex-valued data points with bandwidth (BW) of 1200 Hz and sampling time τ = 1/BW ≈ 0.833 ms. The voxel of interest was 3 cm × 3 cm × 3 cm in the inferior cystic portion of the borderline ovarian tumor. A point-resolved spectroscopy sequence (PRESS) for single-voxel MRS was applied using repetition time (TR) of 2000 ms, echo time (TE) of 30 ms using WET (water suppression through enhanced T1 effects). Sixty-four encoded FIDs were averaged to improve SNR. 32
For 14.1T in vitro encoding, two excised samples from the serous cystadenoma and from the serous cystadenocarcinoma were bathed in D20 solvent. The acquisition parameters were: TR = 1200 ms, BW = 6667 Hz, TE = 30 ms and τ ≈ 0.15 ms. Improved SNR resulted from averaging 128 encoded FIDs. Trimethylsilyl-2-2-3-3 tetradeuteropropionic acid (TSP: sodium salt), as an internal reference substance, was added to each sample for calibrating chemical shifts and metabolite concentrations. The averaged FIDs were zero-filled once prior to Fourier and Padé signal processing for both the in vivo and in vitro encodings. The in vitro data were a part of a series of ovarian cyst fluid samples obtained from 40 patients with a primary ovarian tumor (12 malignant and 28 benign). 33 The encoded FIDs were from Refs..32,33 The signal processing presented herein was performed independently from the histopathology.
Results
The Padé spectra to be presented are computed from the stabilized values of
In Vivo Encoding from Borderline Ovarian Cyst: the dFPT Delineates Myriads of Peaks in the Full Nyquist Range

In Vivo MRS (3T) for Ovarian Borderline Cyst: Spectra Covering Almost the Entire Nyquist Frequency, with Aliphatic and Aromatic Regions. FPT (a:m = 0) Versus Derivatives in the dFPT (b-e: m = 3) Estimations. The Non-Parametric and Parametric dFPT Display a Plethora of Well-Delineated Peaks Amenable to Retrieving Concentrations of Cancer Biomarkers and Other Diagnostically-Relevant Metabolites. The dFPT Spectra in (b,c) Coincide, as Do those in (d,e). Note, the Non-Parametric dFPT Maps the Crude, Uninformative Top Trace in (a) to Separated, Sharp Resonances in (b,d). Spectral Intensities (Ordinates) in Arbitrary Units (au); Chemical Shifts (Abscissae) in Parts Per Million (ppm). In (b), Just Above the Abscissa, Illustrative Peak Parameters (Extracted for m = 3 and Mapped to m = 023,24) are Displayed for NAA and acNeu: Real and Imaginary Parts of Complex Resonance Frequency
On the lower trace of (a) for the parametric FPT several sub-peaks underlying the water residual are revealed. Elsewhere, on the bottom trace, an enormous number of overlapping peaks appear, whose separate lineshapes are difficult to distinguish, even when enlarged and inspected window-by-window. The envelope for the non-parametric FPT is a single curve which represents the combined contribution of all the individual peaks (Depending on the relative effects of constructive and/or destructive interference, overlaps among the components can have varied influence on the envelope). From this single curve, it is impossible to surmise what the actual contributory sub-peaks are. Not only would that be entirely speculative, but also non-unique, ie many different combinations are possible.
With application of the third derivative in the dFPT, the situation changes completely in the aliphatic (b,c) and the aromatic (d,e) regions. In the non-parametric dFPT (b), many sharp resonances emerge as a direct consequence of the mechanism of derivative signal processing. Namely, this additional transform simultaneously narrows and intensifies all the peaks, lowering their tails and separating overlaps. This is most markedly manifested in the water residual, which collapses to a single sharp peak surrounded by two well-delineated doublets. The mentioned four chemical-shift bands are seen to be baseline-resolved into their quantifiable components. These are tCho: free choline (Cho), phosphocholine (PC) and glycerophosphocholine (GPC), tCr: creatine (Cr) and phosphocreatine (PCr), NAA complex: NAA and N-acetylneuraminic acid (acNeu) and Lac: lactate doublet. In the parametric dFPT (c), the results fully coincide with those for the non-parametric dFPT (b). For illustrative purposes, numerical data for peak areas of some derivative lineshapes are presented in panel (b), after mapping to their corresponding non-derivative counterparts.23,24
Likewise, in the aromatic region (d,e), a plethora of well-delineated, sharp peaks appear, descending to the flattened baseline in the dFPT (
Further Elucidation of Total Cho Components by the dFPT: in Vitro MRS for Benign & Cancerous Ovarian Cysts
The focus in

In Vitro MRS (14.1T) for Benign (Left Column) and Malignant (Right Column) Ovarian Cyst Fluid Samples. Cholines are Approximately 4 Times More Abundant in the Latter (e-h) than in the Former (a-d) Cases. In the FPT
For the malignant case (e-h), the non-parametric FPT in (e) produces an oscillating baseline on which wide peaks associated with GPC, PC and free Cho are superimposed. Phosphoethanolamine (PE) appears as two peaks at 3.20–3.21 ppm. Inset into (e) with the baseline lifted to 80 au (arbitrary units) is a spectrum from the first derivative non-parametric dFPT. Besides a flattening of the baseline, the most notable finding in this inset is that at ∼3.19 ppm, a conspicuous notch appears on the top of the peak. In contrast, at
Such a coincidence is particularly noteworthy for the ability of the non-parametric dFPT to robustly unravel a completely hidden sub-peak, Acn, in the singlet-appearing free Cho from the bottom trace in (e). Without identifying the splitting, the concentration of free Cho would be underestimated by a factor of 2, thereby compromising the diagnostic accuracy of this cancer biomarker.
High Resolution & SNR with Resilience of dFPT to Derivative-Induced Distortions:
In Vitro MRS Around the Lactate Doublet for Cancerous Ovarian Cyst Fluid
We now focus in

In Vitro MRS (14.1T) for Malignant Ovarian Cyst Fluid Sample. Focusing on Lactate Doublet, Lac, and Its Neighborhood, Including Branched-Chain Amino Acids (Valine Val, Leucine Leu, Isoleucine Iso). The 3rd Derivative in the dFPT
For the parametric (c) and non-parametric (d, bottom trace) third derivatives in the dFPT, almost all the peaks are resolved down to the chemical shift axis. Each resonance is distinct, isolated and located on the entirely flat baseline. Consequently, all the peaks adjacent to Lac can be accurately quantified. This is noteworthy since small peaks in the vicinity of a large resonance are usually distorted and, as such, non-quantifiable. The Lac doublet also has clear integration limits for finding the peak area and hence the concentration. It is divided by 35 in (c, d) to be displayed as intact on the same ordinate alongside all the other resonances.
Comparing Fourier and Padé Reconstructions in the Region Dominated by the Lactate Doublet
In
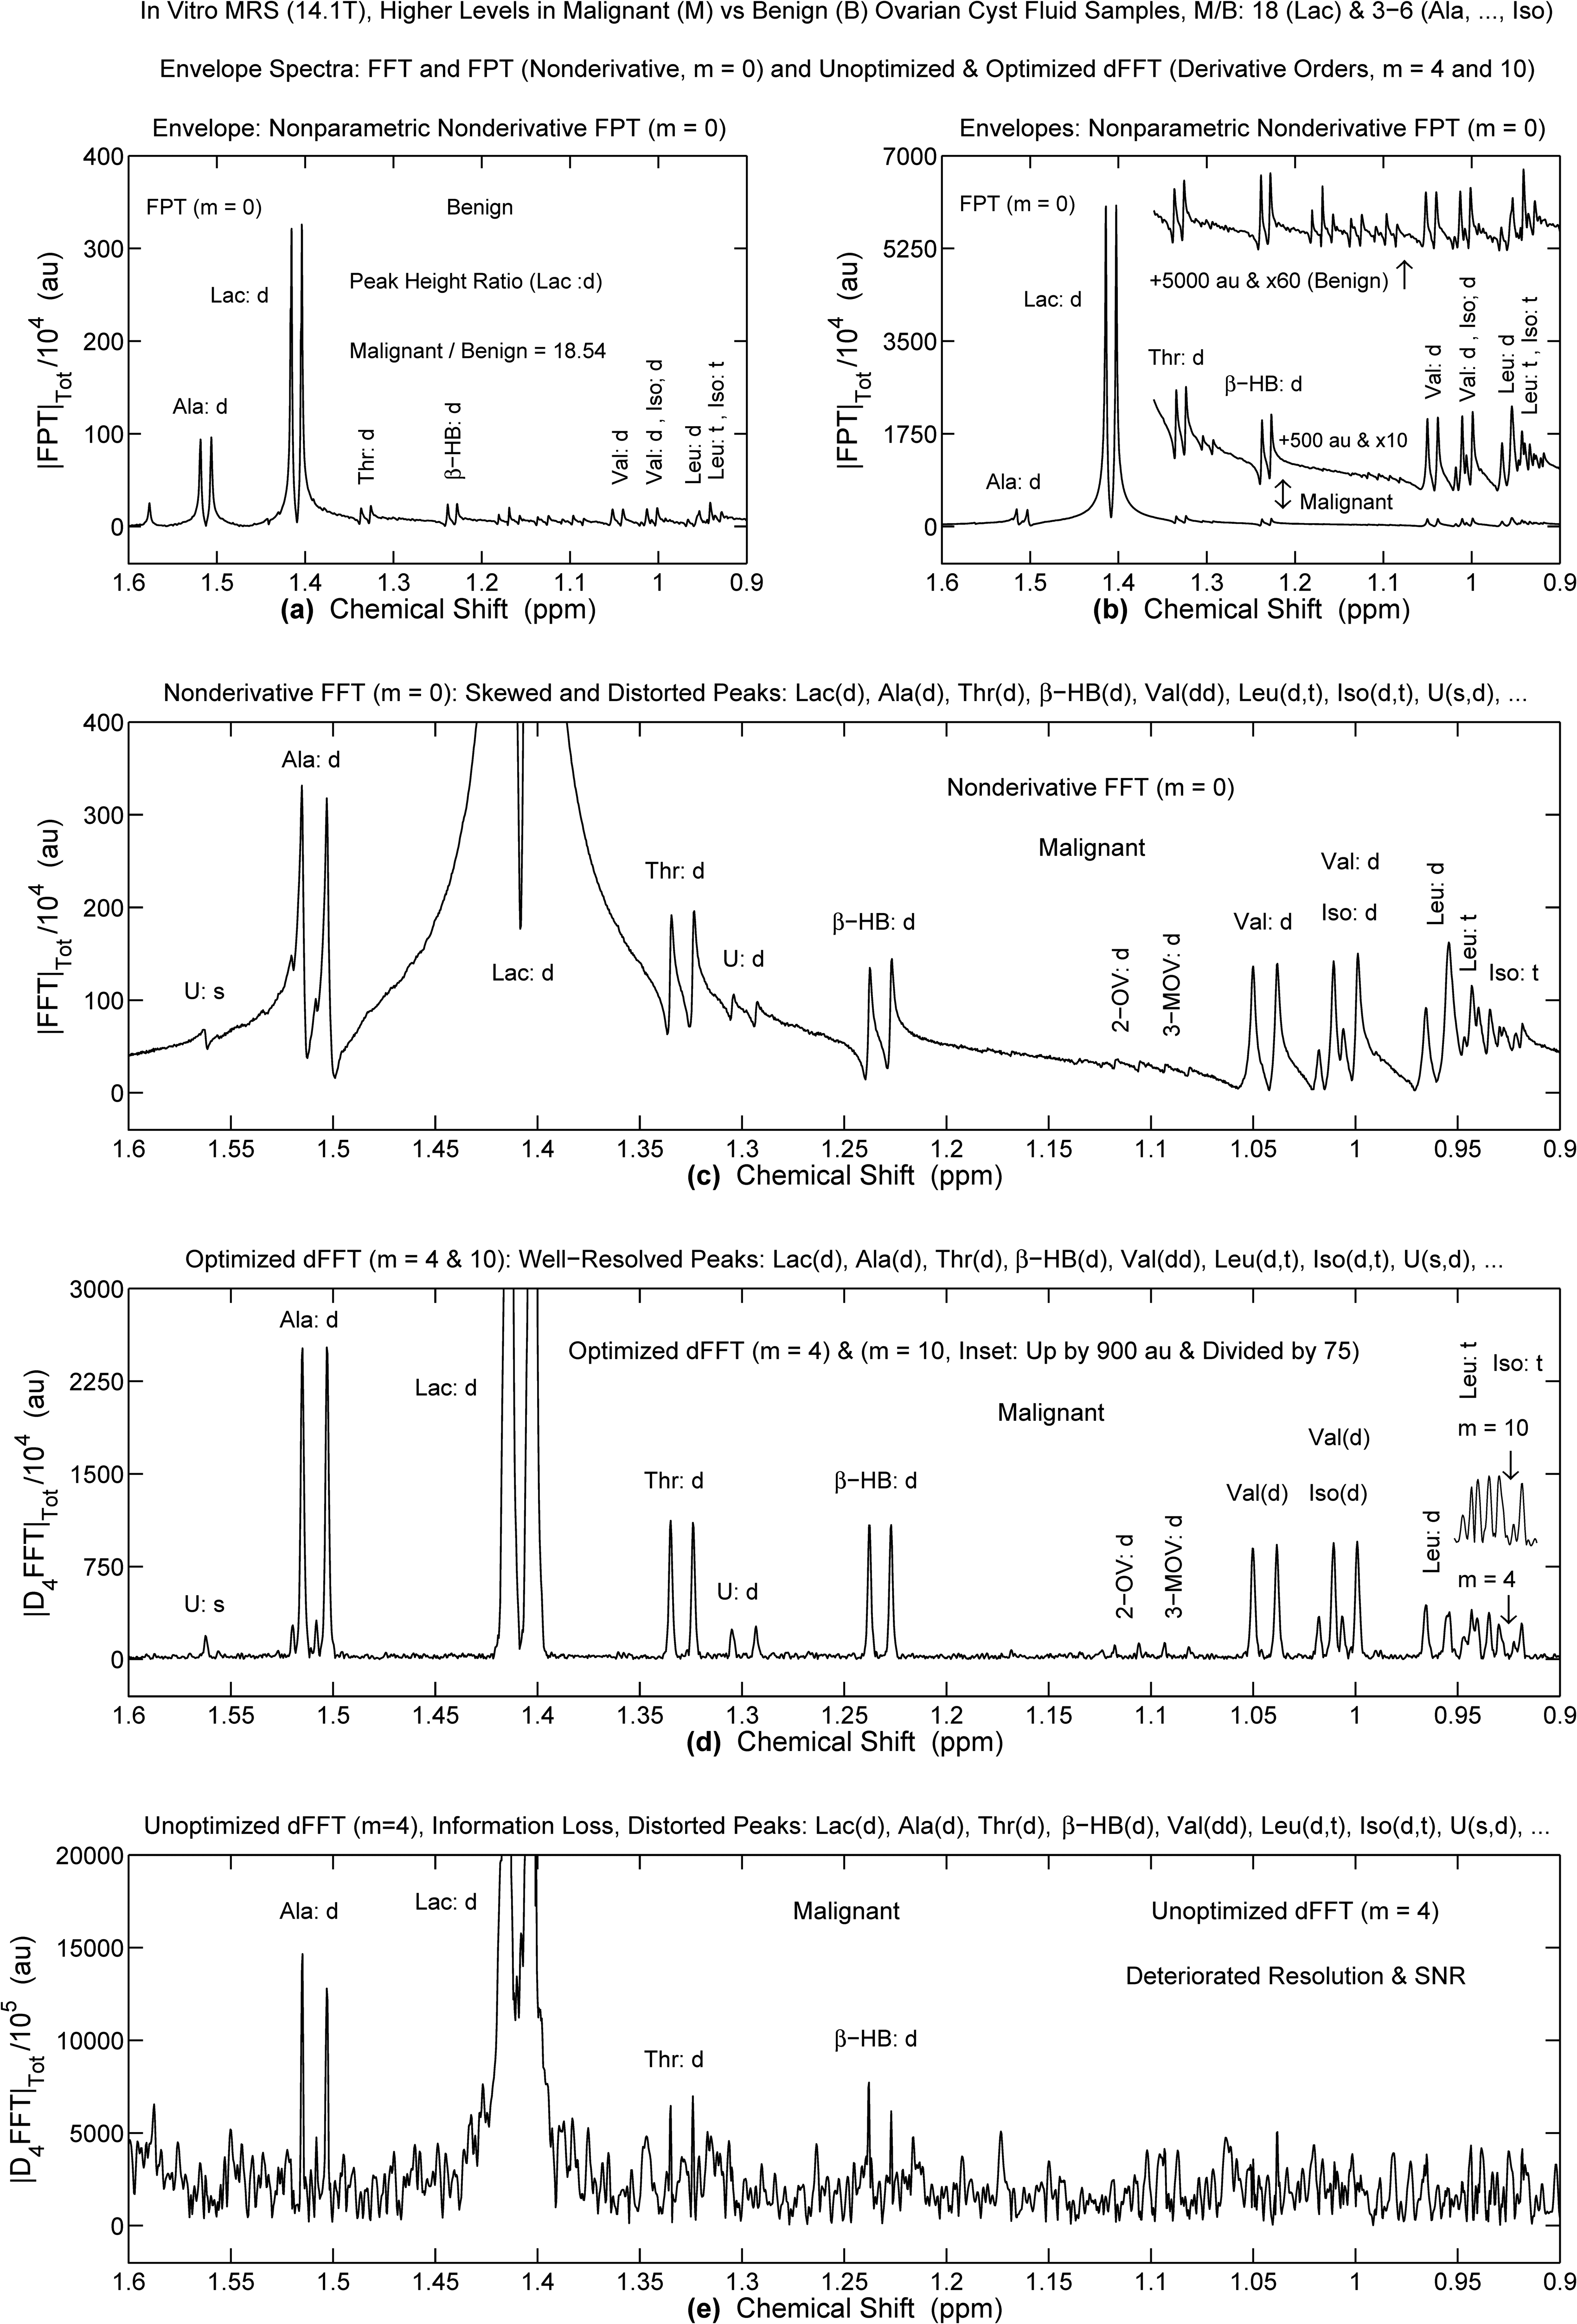
In vitro MRS (14.1T) for Benign and Malignant Ovarian Cyst Fluid Samples: FPT (a,b), FFT (c) and dFFT (d: Optimized, e: Unoptimized). Refocusing on the Lactate Doublet and its Vicinity. Malignant-to-Benign Ratio Levels are Approximately 18 for Lac, 3 to 6 for Ala, Thr, Beta-HB, Val, Leu and Iso, as Seen in (a,b). The Optimized dFFT for m = 4 (d) Generates a Well-Delineated Spectrum from the Rough FFT (c, m = 0). The Unoptimized dFFT (e, m = 4) Loses All Physical Information. Ordinates in au, Abscissae in ppm (for Details, See Text).
For the optimized dFFT at
In sharp contrast, with the unoptimized dFFT, marked deterioration of resolution and SNR occur at
Just like in panel (c) of Figure 4, the most congested region below 1 ppm could not be quantified either in Refs.33,34 by the FFT for in vitro high field ovarian MRS. The same lack of resolution within this diagnostically-relevant region was also reported in a study on ovarian lesions employing MRS with high-resolution magic angle spinning (HRMAS). 35
Depletion of Citrate in the Malignant Ovarian Lesion
In

In Vitro MRS (14.1T) for Benign and Malignant Ovarian Cyst Fluid Samples. Focusing on the Citrate Quartet. In the FPT (m = 0), the Citrate Abundance is Approximately 5 Times Higher in the Benign (a,b) Relative to Malignant (c,d) Samples. Panels (c-h) Are for the Malignant Sample Alone for Which e.g. the Non-Parametric (g) and Parametric (h) Versions of the dFPT (m = 3) are Identical. Ordinates in au, Abscissae in ppm (for Details, See Text).
The spectra retrieved by the FPT (c,d) using the FID from the malignant sample are yet more complicated. The overall observation is that Cit is several times less abundant for the malignant relative to the benign ovary. Specifically, in (c) from the non-parametric FPT, the outer Cit peak at ∼3.03 ppm appears to be the tallest, and is surrounded by two wide, intense unknown resonances. In that region, the baseline is most lifted. The parametric FPT (d) reveals that in the vicinity of the outer Cit peak at ∼3.03 ppm, there are numerous resonances in addition to the two unknown peaks seen in (c). On the other hand, minuscule resonances underlie the other three Cit peaks. With
Discussion
To the best of our knowledge, this is the first study in which results for in vivo MRS encoded FIDs from the ovary have been presented for the nearly-entire Nyquist interval. Without derivative processing, the component spectra retrieved by parametric estimations are difficult to interpret visually, due to the numerous overlapping resonances. These overlapping resonances are not even identifiable by any non-derivative shape estimator. Notably, with FFT processing of in vivo encoded MRS time signals from the ovary, overlapping resonances have been a major stumbling block. 13 In contradistinction, both versions of the dFPT for the third derivative yielded confluent results, with altogether over 300 clearly identifiable, thin, baseline-resolved peaks for the aliphatic plus aromatic regions.
In the aromatic region, among the identified resonances were histidine at ∼7.75 ppm, phenylalanine multiplets centered at ∼7.4 ppm and tyrosine doublets at ∼6.9 and ∼7.2 ppm. These resonances were also observed in the spectrum associated with a serous ovarian carcinoma, as reported by Kyriakides et al 34 in their in vitro MRS study of ovarian lesions. With inclusion of the aromatic as well as the aliphatic regions, these authors state: “the respective metabolic profiles contain mechanistic information which could help identify biomarkers and therapeutic targets for ovarian tumours” (p. 7216).
Crucially, for the presently analyzed in vivo MRS data from the borderline ovarian cyst fluid, all three components of tCho in the aliphatic region around 3.2 ppm were quantified by the dFPT (
Altered choline metabolism is considered to represent one of the hallmarks of cancer. 38 Phosphocholine, in particular, has been identified as a biomarker for several types of cancer. 39 This might be due to loss of tumor suppressor p53 function. 40 Increased levels of GPC, which comes as a subsequent metabolic step, may also be a biomarker of malignancy, according to Sonkar and colleagues, who highlight the need for more investigation using “innovative” MRS methodologies. 41 However, with FFT processing of in vivo encoded MRS time signals from the ovary, due to overlap, the components of tCho have not been assessed. 13 Even tCho has not consistently been detected by FFT processing of in vivo encoded data from malignant ovarian lesions.13,42
Additional insights concerning these diagnostically-important tCho components are gleaned from derivative processing by the dFPT of the in vitro MRS data encoded from benign and patently malignant ovarian fluid samples. Firstly, multifold higher PC and substantially higher GPC levels are observed in the latter specimens. Moreover, free Cho resonating at ∼3.19 ppm is found to closely overlap with L-acetylated carnitine, Acn. The Acn peak is so intense that it must be excluded in order to accurately assess the level of free Cho, and to make an overall assessment of this recognized cancer biomarker.
It is well-known that water is a dominant molecule in human tissues and biofluids. As such, FIDs encoded by MRS from these tissues and biofluids yield spectra dominated by the water peak, which obscures all the other resonances. The water peak is usually fitted with several artificial Lorentzians, as done in eg the Hankel-Lanczos singular valued decomposition. 14 Subsequently, the ensuing lineshapes are subtracted from the total shape spectrum. However, spectral subtraction can wash out some physical resonances. This bottleneck is successfully solved without subtraction of any spectra by the dFPT and the optimized dFFT. These two processors simultaneously narrow the water peak and flatten its tail. Both estimators can give spectra of comparable quality by using the FIDs encoded with and without water suppression.23,43 The latter acquisition option would reduce the overall examination time for the patient. This would help the patient and hospital management, including the long-sought cost effectiveness of MRS.
It has been generally considered that FIDs encoded by in vitro MRS at high field spectrometers represent the “gold standard”. With in vitro MRS, broad resonances are considerably narrowed, thereby enhancing peak resolution. Nevertheless, more scrupulous assessment of results from in vitro MRS is needed. Namely, in such FFT spectra, there are still many unresolved resonances superimposed on lifted background baselines with uncertain integration limits. This can be seen by examining the spectra extracted from in vitro encoded ovarian data as displayed in Refs..33–35 Consequently, clinically reliable assessment by non-derivative, non-parametric estimations in MRS is often precluded even with the strongest magnetic fields with or without HRMAS.
Clarification is also needed in the region 1.3–1.4 ppm where Lac and broad Lip overlap. Elevated Lac can be associated with the presence of cancer cells, whose energy source is the glycolytic pathway. This can be due to tissue hypoxia. However, even with normal O2 levels, cancer cells activate glycolysis 44 yielding increased Lac, possibly contributing to invasiveness and resistance to immune attack. An in vitro MRS investigation of cells from ovarian cancer and benign ovary revealed significantly higher intracellular Lac in ovarian cancer cells. 45 High Lip levels at 1.3–1.4 ppm have also been associated with several cancers, particularly necrotic tumors. 14 Thus, this overlap of narrow, longer-lived Lac and broad, short-lived Lip at 1.3–1.4 ppm is troublesome for oncologic diagnostics.
In the meta-analysis of in vivo MRS studies of ovarian lesions (cancerous, borderline and benign), this chemical shift region was of special interest. 13 On the one hand, the appearance of Lac was significantly associated with malignant ovarian lesions, as opposed to those that were benign. However, data regarding Lac were missing in 75% of cases. Moreover, lipid was more often noted in malignant lesions, although that was not a statistically significant finding.
By sequential quantification, 23 after quantifying Lac, the ordinates for the intensities in the plotted spectrum can be reduced, thus enabling appearance of the broader resonances, including lipids. The latter can be quantified in the same way as done with Lac. Sequential quantification is especially helpful for regions of mixtures of resonances with different widths. It is particularly important at short echo times such as TE = 30 ms,32,33 for which Lac is otherwise often undetected due to overlap with lipid. 23 Macromolecules impede analysis and interpretation of spectra throughout the Nyquist range. This problem can likewise be solved by sequential quantification without any subtraction of spectra.
Short echo times provide the richest spectra. Frequently, acquisitions are made with long TEs to produce sparse spectra more amenable to interpretation. However, much potentially-important diagnostic information is irretrievably lost thereby. With the dFPT and the optimized dFFT, time signals encoded by MRS at short TEs are fully accessible to estimation, as seen herein.
Another region of interest is 0.91–1.12 ppm where branched-chain amino acids, isoleucine (Iso), leucine (Leu), valine (Val) are interspersed with several other tightly overlapped resonances. Increased levels of Iso, Leu and Val have been viewed as protein breakdown products characterizing malignant ovarian lesions. 11 High levels of Val and Leu are reportedly associated with poor survival in patients with epithelial ovarian carcinomas. 35 The main obstacle to quantifying the resonances in the band 0.91–1.12 ppm had been attributed to “spectral crowding”. 33 With the third derivative in the dFPT applied to FIDs encoded from ovarian cyst fluid, not only were Iso, Leu and Val resonances fully resolved, but so were several other metabolites residing in that congested region.
Citrate, a quartet centered at ∼2.90 ppm, 33 was seen to be markedly depleted in the serous cystadenocarcinoma compared to the serous cystadenoma. Elevated citrate was also reported in 8 benign ovarian lesions assessed via in vitro MRS. 34 A recent metabolomic investigation similarly indicates that Cit is downregulated in ovarian cancer cells. 46 Moreover, therein, Cit was found to induce ovarian cancer cell death. Together, these findings suggest that lowered Cit may help identify malignant ovarian lesions. It has been established that diminished levels of Cit are a key metabolic marker of prostate cancer as assessed through MRS. 47
The findings presented in our current study underscore the full agreement between the non-parametric and parametric versions of the dFPT. This agreement also extends to the optimized dFFT. Such a threefold cross-validation helps provide the diagnostic clarity for which clinicians fervently strive. On the other hand, the noise-content of the latter part of the encoded FID completely undermines the unoptimized dFFT.
The present study was carried out for MRS data from three patients. In vivo MRS was from one patient with borderline ovarian cyst. For the other two patients, one with benign and one with malignant ovarian cyst fluid, in vitro MRS was used. The small number of included patients obviously limits statistical analysis as to which metabolites best distinguish these three clinical categories. Rather, the reported findings are intended to be illustrative of the potential for enhanced diagnostics for ovarian lesions through derivative MRS. A key implication of the present feasibility study is that derivative MRS is a viable option for assessing ovarian lesions in the clinical setting. Further rigorously controlled examination will be needed to ascertain the actual readiness of derivative MRS for clinical implementation.
Practical issues should also be considered. Namely, the results for the optimized dFFT can be available from every MR clinical scanner and laboratory spectrometer. The filters of the exponential and Gaussian damping forms are already present in these MR instruments. These just need to be adapted to the derivative order and to the SNR of the encoded time signal, according to Eqs. (5) and (6). Likewise, fast computations in signal processing can enable the dFPT to readily enter the manufacturers’ software for MR devices.
As noted, the ovary is a small, moving organ, such that encoding high-quality FIDs by in vivo MRS is technically difficult, an objective limitation. Moreover, the histopathology of ovarian lesions is diverse, 48 and includes both cystic as well as solid types, further limiting the generalizability of the reported findings.
Notwithstanding these challenges, it is hoped that the results of the present study will encourage the MR community to give further attention to this problem area of major public health concern.1,2 Among the next strategic steps would be to apply derivative MRS to FIDs encoded in vivo from various types of ovarian lesions: benign, borderline, as well as cancerous. Potential confounders such as patient age, hormone status and comorbidities, that might affect metabolic profiles would also be important to consider. Blinded validation cohorts will be required in the future to externally evaluate the diagnostic accuracy of derivative MRS for assessing ovarian lesions. Comprehensive multivariable investigation will be needed to identify the metabolite patterns that most accurately distinguish benign, borderline and clearly malignant ovary.
It warrants re-emphasis that MRS examinations do not entail any exposure to ionizing radiation. This consideration is especially salient for ovarian cancer screening, for which women themselves have expressed ardent interest. 49
Conclusions
We report on furthering molecular imaging by magnetic resonance spectroscopy, MRS, for ovarian tumor diagnostics. This powerful modality could provide quantitative information for trustworthy differentiation between benign and malignant lesions. To achieve this goal, MRS relies heavily upon mathematical analysis and interpretation of encoded FIDs. It is precisely here that trustworthiness is at stake due to customary signal processing. Presently, this gap is bridged by resorting to derivative signal processing.
The ensuing derivative MRS, through data analysis by non-parametric and parametric algorithms, provides the cross-validation essential for clinical trustworthiness. Precisely the lack of trustworthiness has been the reason for which clinicians often decline to use MRS even when readily available, as reported by several European cancer centers. 50 Notably, in this light, the non-parametric and parametric versions of the dFPT yield identical final results. Since these results stem from two entirely different computational algorithms, they provide the sought cross-validation. Moreover, it is presently shown that the optimized dFFT gives the same results as the dFPT. This accord is all the more important given that the optimized dFFT is yet a third and entirely different computational algorithm.
Both visualization and quantification by the dFPT and the optimized dFFT can be expeditiously implemented in MR clinical scanners. Crucially, then, derivative MRS can provide clinically interpretable findings about cancer biomarkers and other diagnostically-important metabolites to help identify or rule-out ovarian malignancy. With derivative MRS, more accurate non-invasive assessment of ovarian lesions becomes feasible. As stated, malignant lesions confined to the ovary have an excellent prognosis. 2 Derivative MRS offers the possibility for early detection of ovarian cancer, and could thereby potentially impact on survival.
Footnotes
List of main acronyms
Acknowledgements
This work has been supported by The Marsha Rivkin Center for Ovarian Cancer Research (U.S.), King Gustav the fifth Jubilee Fund, and FoUU through Stockholm County Council to which the authors are grateful. We would like to thank our colleagues, Professors Marinette van der Graaf, Leon Massuger, Ron Wevers, Eva Kolwijck, Udo Engelke, Arend Heerschap, Henk Blom, M’Hamed Hadfoune, and Wim Buurman from Radboud University for kindly making available to us the in vivo and in vitro MRS time signals encoded in the Department of Obstetrics/Gynecology University Medical Centre Nijmegen, the Netherlands. Open Access has been provided by the Karolinska Institute, Stockholm, Sweden.
Ethical Approval and Informed Consent Statements
The Regional Ethics Committee, Karolinska Institute (Dnr # 2007/708-31/1) June 20, 2007 stated that they found no ethical issues to preclude implementation of this research. No informed consent statements are needed.
Author Contributions
Signal processing and the art work were carried by DžB. Analysis of the obtained spectra was performed by DžB and KB. Both authors cooperatively designed this study. KB drafted the manuscript. Both authors critically read and revised the manuscript and approved the final version submitted for publication.
Funding
This work has been supported by The Marsha Rivkin Center for Ovarian Cancer Research, King Gustav the 5th Jubilee Fund, and FoUU through Stockholm County Council to which the authors are grateful. Open Access has been provided by the Karolinska Institute, Stockholm, Sweden. The funders had no role in the initiation or design of the study, nor with any other aspect of the study.
Declaration of Conflicting Interests
The authors declared no potential conflicts of interest with respect to the research, authorship, and/or publication of this article.
Data Availability Statement
Data from this work can be made available to other researchers upon request to the authors.