
Abstract
Introduction
Osteosarcoma (OS) is a highly aggressive primary bone malignancy with poor prognosis. Histone modifications play crucial roles in tumor progression, but their systematic investigation in OS remains unexplored.
Methods
This study integrated single-cell RNA sequencing data and large-scale clinical information to systematically analyze the spatial heterogeneity of histone modifications in OS and their clinical significance. We employed Seurat for single-cell data analysis, CellChat for cell-cell communication network analysis, and LASSO Cox regression to construct a prognostic model. Additionally, we conducted functional enrichment analysis, immune characteristics analysis, and drug sensitivity prediction.
Results
We identified five major cell types in the OS microenvironment and discovered significant differences in histone modification levels among different cell types, with osteosarcoma cells and endothelial cells exhibiting higher modification levels. Cell-cell communication network analysis revealed the importance of signaling pathways such as SPP1, CypA, MIF, IGFBP, and VEGF in OS. Based on nine histone modification-related genes, we constructed an efficient prognostic model (AUC values of 0.713, 0.845, and 0.888 for 1-, 3-, and 5-year predictions, respectively), which was validated in an external cohort (AUC = 0.808). Immune microenvironment analysis showed significantly higher proportions of CD8+ T cells and Treg cells in the low-risk group. Drug sensitivity analysis revealed that the low-risk group was more sensitive to Imatinib, Rapamycin, and Sunitinib, while the high-risk group was more sensitive to MAPK pathway inhibitors.
Conclusion
This study systematically revealed the spatial heterogeneity of histone modifications in OS and their clinical significance for the first time, proposing an “epigenetic-immune” regulatory network hypothesis and developing a histone modification-based prognostic model. Our proposed “epigenetic-guided personalized medication strategy” provides new insights for precision treatment of OS, potentially significantly improving patient prognosis.
Keywords
Introduction
Osteosarcoma (OS) is a highly aggressive primary malignant bone tumor that predominantly affects children, adolescents, and older adults. Globally, the incidence rate is approximately 2-3 cases per million population annually, with a higher incidence in adolescents peaking at 8-11 cases per million per year. 1 Among adolescents aged 10-19, OS accounts for 15% of all extracranial tumors. 1 Despite significant advancements in comprehensive treatment strategies over the past few decades, including the combination of surgical resection and neoadjuvant chemotherapy, the long-term survival rate for OS patients remains stagnant. The 5-year survival rate for localized OS is about 60%-70%, but it plummets to 30% for patients with metastases at diagnosis. 2 Notably, approximately 20% of patients present with metastases at initial diagnosis, severely impacting prognosis. 2 The limited treatment efficacy is primarily due to the complex pathogenesis of OS, involving multiple genetic and epigenetic alterations, which poses significant challenges for precision medicine. 1
Histone modifications play a crucial role in regulating gene expression and determining cell fate, and have become a hot topic in cancer research in recent years. These modifications include acetylation, methylation, phosphorylation, and ubiquitination, which can alter chromatin structure and accessibility, thereby affecting gene transcriptional activity.3,4 In OS, studies have shown that abnormal expression of histone modification-related enzymes is associated with tumor progression and poor prognosis. For instance, the histone deacetylase HDAC2 is a critical factor controlling OS stem cells and tumorigenesis. 5 High expression of histone methyltransferases SETDB1 and EZH2 is significantly correlated with OS development and unfavorable outcomes.3,6 However, despite these findings highlighting the importance of histone modifications in OS development, there has been no systematic study examining OS from a holistic perspective, discussing score distribution and its use in constructing prognostic models.
In recent years, the rapid development of high-throughput sequencing technologies, including single-cell RNA sequencing, has provided unprecedented opportunities to decipher the complexity of the tumor microenvironment. 7 In this study, we utilized single-cell data from OS to systematically score different cell types based on the expression patterns of histone-related genes, revealing epigenetic differences and interaction networks between cell types. To translate these findings into clinical applications, we integrated large-scale OS datasets to identify and validate characteristic genes. Based on these signature genes, we constructed a clinically valuable risk scoring system. Furthermore, we explored differences in drug sensitivity between different risk groups classified according to the scoring results. By integrating multi-omics and corresponding clinical data, this study not only deepens our understanding of the molecular mechanisms of OS but also provides important insights for developing new diagnostic tools and personalized treatment strategies, potentially improving the clinical prognosis of OS patients.
Materials and Methods
Data Source
This study primarily utilized resources from three databases. First, we extracted gene expression data and corresponding survival information for 88 OS samples from the Therapeutically Applicable Research to Generate Effective Treatments (TARGET) Project (https://portal.gdc.cancer.gov/). Second, we obtained two OS datasets from the Gene Expression Omnibus (GEO) database (https://www.ncbi.nlm.nih.gov/geo/): GSE21257 and GSE152048. GSE21257 includes tissue sequencing data for 54 OS samples with survival information. GSE152048 contains single-cell RNA sequencing data for 11 OS samples. Based on the clinical information from Zhou et al's 2020 study, we included 5 primary OS samples and excluded other recurrent and metastatic samples to reduce sample heterogeneity. 8 Additionally, histone modification-related genes were sourced from two origins: cancer-associated histone modifications reported by Füllgrabe et al in 2011, 9 and genes with a histone modification relevance score greater than 20 from the GeneCards database (https://www.genecards.org/).
Data Processing
In the data processing phase, we first extracted transcripts per million (TPM) format data from STAR count data and clinical information. To stabilize variance and improve normal distribution of the data, we normalized the data and applied a log2(TPM + 1) transformation. In the final stage of data preprocessing, we retained only samples with both RNA sequence data and complete clinical information for subsequent analysis.
Single-cell Analysis
Data Preprocessing
Single-cell RNA sequencing data analysis was performed using the Seurat v4.3.0 package. 10 We initially read 10X Genomics data for 5 primary OS samples (BC2, BC3, BC5, BC6, and BC16). For each sample, we created Seurat objects using the CreateSeuratObject function, setting the minimum cell number to 3 and the minimum feature number to 200. Subsequently, we calculated the expression proportions of mitochondrial, ribosomal, and red blood cell genes. We then used the subset function to screen cells, retaining those with detected gene numbers between 200 and 5000, total UMI counts less than 20,000, mitochondrial gene proportion less than 10%, and red blood cell gene proportion less than 1%.
Data Normalization and Dimensionality Reduction
After quality control, we normalized the data using the NormalizeData function and selected 3000 highly variable genes using the FindVariableFeatures function. We then scaled the data using the ScaleData function. Next, we performed principal component analysis (PCA) using the RunPCA function and plotted an elbow plot using the ElbowPlot function to determine the number of principal components for downstream analysis. We selected the first 30 principal components for subsequent analysis. To eliminate batch effects, we used the RunHarmony function from the Harmony package for batch correction, setting the group.by.vars parameter to “orig.ident” and max.iter.harmony to 20. After correction, we performed non-linear dimensionality reduction using RunUMAP and RunTSNE functions, setting the dims parameter to 1:30 for visualizing cell population structure. Dimensionality reduction results were visualized using the DimPlot function.11,12
Cell Clustering and Annotation
We constructed a KNN graph using Seurat's FindNeighbors function, followed by cell clustering using the FindClusters function with the resolution parameter set to 0.5. To annotate these subgroups, we first calculated marker genes for each subgroup using the FindAllMarkers function, setting min.pct to 0.25 and logfc.threshold to 0.5. We also used the SingleR package 13 and expression patterns of known specific genes for annotation reference, with HumanPrimaryCellAtlasData as the reference dataset.
Histone Modification Score Analysis
To study the role of histone modifications in OS, we calculated a histone modification score for each cell based on a predefined set of histone modification-related genes. We used the ssGSEA algorithm for this calculation, implemented through a custom ssGSEA_score function. Subsequently, we visualized the distribution of histone modification scores on UMAP plots using the FeaturePlot function. Additionally, we plotted boxplots of histone modification scores for different cell types using the ggboxplot function and compared score differences between cell types using Kruskal-Wallis tests and Dunn's post-hoc tests.
Cell Communication Analysis
We analyzed cell-cell communication in the OS microenvironment using the CellChat package. 14 First, we created a CellChat object using the createCellChat function, setting the database to the “Secreted Signaling” section of CellChatDB.human. We then performed a series of analyses using functions including identifyOverExpressedGenes and identifyOverExpressedInteractions to identify overexpressed ligand-receptor pairs, computeCommunProb to calculate cell communication probabilities, filterCommunication to filter low-expression interactions, and computeCommunProbPathway to calculate communication probabilities at the pathway level. Finally, we aggregated communication network results using the aggregateNet function. Analysis results were visualized using functions such as netVisual_circle and netVisual_heatmap, showing overall cell-cell communication and detailed information for specific signaling pathways.
Prognostic Model Construction and Feature Selection
To construct a prognostic model for OS patients, we first used OS samples from the TARGET database as an internal training set. LASSO Cox regression analysis was performed based on histone modification-related genes to select genes with significant prognostic value. 15 The lambda parameter for LASSO regression was determined through cross-validation. We plotted the relationship between partial likelihood deviance and log(λ) to visualize the selection process of the optimal lambda value. The selected features and their coefficients were used to construct a risk score model.
We then calculated the risk score for each sample and divided patients into high-risk and low-risk groups based on the median score. We generated risk score distribution plots, survival status scatter plots, and gene expression heatmaps to visually demonstrate the relationship between risk scores and survival outcomes. Kaplan-Meier survival curves were plotted, and log-rank tests were used to assess the statistical significance of survival differences between groups. We also calculated the hazard ratio (HR) and its 95% confidence interval for the high-risk group relative to the low-risk group to quantify the model's predictive power. Additionally, we plotted ROC curves for different time points and calculated corresponding AUC values to evaluate the model's predictive accuracy.
To validate the model's universality, we used the GSE21257 dataset from the GEO database (comprising 54 OS samples) as an external validation set and repeated the above analysis process.
Functional Enrichment Analysis
To gain a deeper understanding of the biological mechanisms associated with OS prognosis, we performed gene set enrichment analysis on the high-risk and low-risk groups. Single-sample GSEA analysis was conducted on the Hallmark gene set using the GSVA package, and the limma package was used to compare pathway enrichment differences between high-risk and low-risk groups.16,17 We plotted bar charts to show the enrichment levels of various pathways in different risk groups and used correlation heatmaps to display the relationship between risk scores and pathway enrichment scores. Survival analysis was performed for each pathway to identify pathways significantly associated with prognosis, and Kaplan-Meier survival curves were plotted.
Immune Characteristics Analysis
We further explored the immune characteristics in the OS microenvironment by conducting multifaceted immunological analyses on the TARGET dataset. First, we used the ESTIMATE algorithm 18 to evaluate the stromal score, immune score, and ESTIMATE score of the samples, comparing differences between high-risk and low-risk groups. Subsequently, we performed enrichment analysis on immune-related pathways using the ssGSEA method, presenting the differences in pathway activity between risk groups through heatmaps. The CIBERSORT algorithm 19 was employed to estimate the proportions of 22 immune cell types, and violin plots were used to visualize the differences in immune cell composition between high-risk and low-risk groups. We also analyzed the correlation between risk scores and immune cell proportions, visualizing the results with dot plots. Finally, we explored the correlations between key genes in our model and immune cell proportions, presenting their relationships through heatmaps.
Significance of the Prediction Model in Drug Sensitivity
We explored the association between OS risk scores and drug sensitivity using the Genomics of Drug Sensitivity in Cancer (GDSC) database (https://www.cancerrxgene.org/) to predict the sensitivity of high-risk and low-risk group samples to common anticancer drugs. GDSC is one of the largest public resources in the field of pharmacogenomics, providing rich drug sensitivity and related genomic information crucial for discovering potential cancer treatment targets. 20 To this end, we applied the pRRophetic software package 21 to construct a cell line-based ridge regression model, trained using the CGP2016 dataset. We conducted predictive analysis for each potential drug, using the pRRopheticPredict function to predict IC50 values of OS samples for various anticancer drugs. 22 Subsequently, we combined the predicted drug sensitivity with our risk score model to compare drug response differences between high-risk and low-risk groups. We used the Wilcoxon rank-sum test to assess statistical significance and generated box plots for drugs showing significant differences using the ggplot2 package.
Experiment Validation
Total RNA was extracted from OS cell lines (MG-63 and U2OS) and normal osteoblast cell line (hFOB 1.19) using TRIzol reagent (Invitrogen, USA). The cell line information is as follows: MG-63 (Cellosaurus MG-63, RRID: CVCL_0426), U2OS (Cellosaurus U2OS, RRID: CVCL_0042) and hFOB 1.19 (Cellosaurus hFOB 1.19, RRID: CVCL_3708). RNA concentration and purity were measured using a NanoDrop spectrophotometer. Following the manufacturer's protocol, 1 μg of total RNA was reverse transcribed into cDNA. Real-time quantitative PCR was performed using SYBR Green PCR Master Mix (Applied Biosystems, USA) with GAPDH as an internal control. The PCR conditions were as follows: initial denaturation at 95 °C for 10 min, followed by 40 cycles of denaturation at 95 °C for 15 s, annealing and extension at 60 °C for 1 min. The relative expression levels of CPE, TPM1, PTN, HIST1H4C, and NPC2 were calculated using the 2^-ΔΔCt method. Each sample was analyzed in triplicate, and all experiments were performed three times independently. The primer sequences used are shown in Table 1.
Primer Sequences for qRT-PCR.

Besides, to investigate the expression differences of top 5 proteins in OS cell lines (MG-63 and U2OS) and normal osteoblast cell line (hFOB 1.19), Western blot (WB) analysis was performed. Total protein was extracted using RIPA lysis buffer (Beyotime, Shanghai, China). Proteins were separated by sodium dodecyl sulfate-polyacrylamide gel electrophoresis (SDS-PAGE) and transferred to PVDF membranes (MilliporeSigma, Germany) using a cold transfer buffer and semi-dry transfer system. A volume of 12 μl of protein sample was loaded into each well for electrophoresis.
Membranes were blocked in 5% skim milk for 1 h, then incubated overnight at 4 °C with primary antibodies. The following primary antibodies were used: NPC2 and GAPDH (ABclonal, Wuhan, China), HIST1H4C, PTN, TPM1, and CPE (HUABIO, Hangzhou, China). The following day, membranes were incubated with corresponding HRP-conjugated secondary antibodies for 1 h at room temperature. Signal detection was performed using enhanced chemiluminescence (ECL) reagent (MilliporeSigma, Germany) according to the manufacturer's instructions.
The antibodies used and their catalogue numbers were as follows: anti-GAPDH antibody (ABclonal, A19056), anti-CPE antibody (HUABIO, ER65474), anti-TPM1 antibody (HUABIO, ET7108-74), anti-PTN antibody (HUABIO, HA722055), anti-HIST1H4C antibody (HUABIO, ET1602-40), and anti-NPC2 antibody (ABclonal, A5413). Protein band density was quantified using ImageJ software. GAPDH served as an internal reference protein for normalization to calculate the relative expression levels of the target proteins. All experiments were performed in triplicate.
Results
All analytical processes are illustrated in the flowchart (Figure 1). Starting with OS as the central focus, the workflow branches into three parallel analytical streams. The left branch (Step 1) encompasses “Cell data analysis,” beginning with histone-related gene identification, followed by single-cell sorting analysis to examine cellular heterogeneity, cell type differentiation to understand population variability, and CellChat analysis to explore intercellular communication networks within the tumor microenvironment. The middle section (Step 2) illustrates the development of the Lasso regression model, which bifurcates into two validation pathways: internal training using the TARGET database and external validation leveraging the GEO database. The right branch (Step 3) represents the multi-faceted validation process, including riskscore construction and clinical testing to evaluate prognostic significance, immune analysis to characterize the tumor immune microenvironment, drug sensitivity analysis to identify potential therapeutic targets, and pathological validation to confirm the biological relevance of the findings.
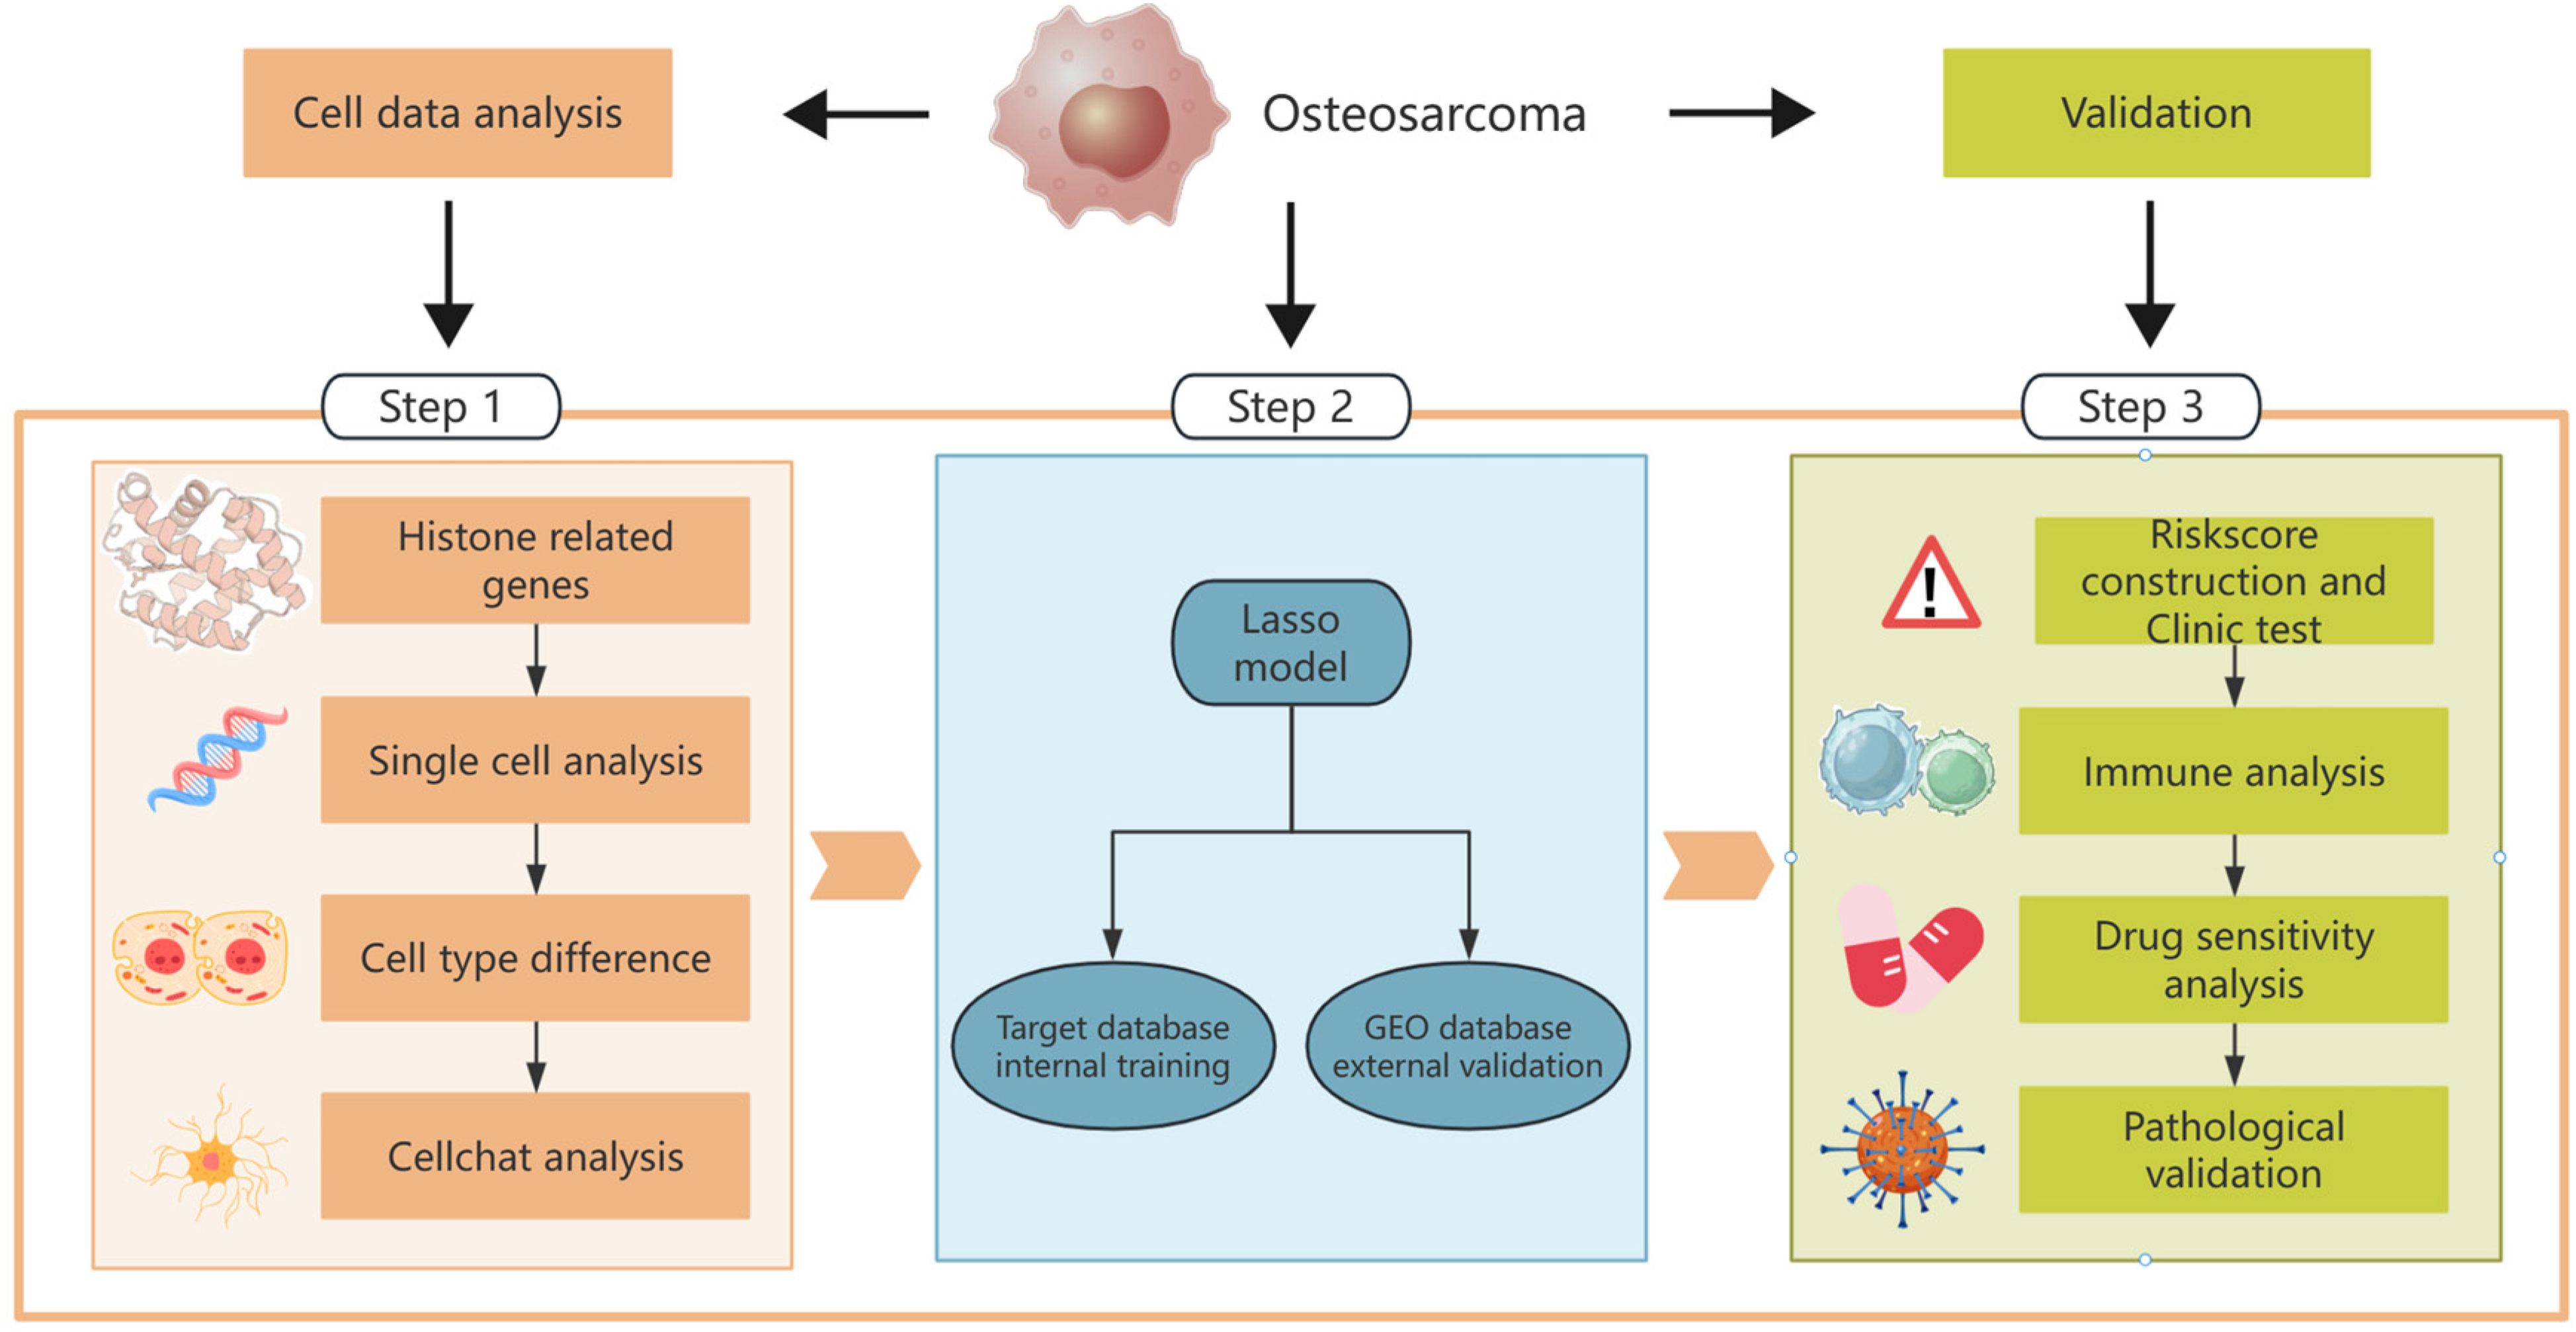
Study Flowchart. It Illustrates the Multi-step Approach Adopted in this Study.
Single-cell RNA Sequencing Data Reveals Cellular Heterogeneity and Histone Modification Distribution in the Tumor Microenvironment
First, through t-SNE dimensionality reduction visualization and cell type annotation (Figure 2A), we identified five major cell types in OS samples: OS cells, endothelial cells, myeloid cells, osteoclasts, and tumor-infiltrating lymphocytes. To validate the accuracy of cell type annotations, we analyzed the expression of marker genes for each cell type (Figure 2B). The results showed that endothelial cells highly expressed VWF and PECAM1, myeloid cells highly expressed CD74 and CD14, osteoclasts highly expressed MMP9 and CTSK, OS cells highly expressed DCN, LUM, RUNX2, CDH11, and COL1A1, while tumor-infiltrating lymphocytes highly expressed NKG7, CD3D, and IL7R. These gene expression patterns are consistent with the known characteristics of each cell type, further supporting our cell type annotations.

Analysis Results of Single-Cell RNA Sequencing Data In OS. (A) T-sne Plot of OS Samples, Showing the Distribution of Five Major Cell Types. (B) Heatmap of Marker Gene Expression for Each Cell Type, Validating the Accuracy of Cell Type Annotations. (C) Distribution of Histone Modification Scores on the t-SNE Plot, Illustrating Differences In Histone Modification Levels Among Different Cell Populations in OS. (D) Box Plot of Histone Modification Scores Across Different Cell Types, Demonstrating Statistical Differences in Histone Modification Levels Between Cell Types. Statistical Significance was Assessed Using Kruskal-Wallis Test Followed by Dunn's Post Hoc Test.
Next, we investigated the distribution of histone modifications in the OS microenvironment (Figure 2C). The results showed that histone modification levels were significantly upregulated in OS tissue compared to normal tissue. Within OS, the OS cell population exhibited higher histone modification scores. To quantify the differences in histone modifications among different cell types in OS, we conducted statistical analyses (Figure 2D). Kruskal-Wallis test results showed significant differences in histone modification scores among cell types (P < 2.2e-16). Further Dunn's post-hoc tests revealed that OS cells and endothelial cells had higher histone modification scores (median 0.22 and 0.21, respectively) compared to other cell types.
Analysis of Intercellular Communication Networks in the Microenvironment
We first constructed an overall intercellular communication network diagram (Figure 3A), which illustrates the intensity of interactions among the five major cell types in the OS microenvironment. The diagram reveals extensive and strong communication between OS cells and other cell types, with the interaction between OS cells and osteoclasts being particularly significant. Further, we analyzed the role of several key gene pathways in intercellular communication in OS. Figure 3B presents a heatmap of intercellular communication from the perspective of OS cells sending signals. Genes such as MIF, SPP1, PTN, MDK, and PPIA primarily participate in the process of OS cells sending signals to other cells. We then investigated pathways related to histone modifications as reported in current literature. SPP1, CypA, MIF, IGFBP, and VEGF signaling pathways (Figure 3C-G) were identified as significant histone modification-related pathways in OS. These results reveal the complex intercellular communication network in the OS microenvironment, particularly emphasizing the central role of OS cells in multiple signaling pathways.

Intercellular Communication Networks in the OS Microenvironment. (A) Overall Intercellular Communication Network Diagram, Showing the Intensity of Interactions Between Different Cell Types. (B) Heatmap of Intercellular Communication in OS, with Signal-sending Cells at the Bottom and Signal-receiving Cells at the Top. (C-G) Heatmaps of Intercellular Communication Involving Histone Modification-related Pathways.
Functional Enrichment Analysis of OS-Related Genes
Based on OS single-cell RNA sequencing data, we conducted an in-depth functional enrichment analysis of differentially expressed genes (|logFc| > 0.5, P < .05) between high and low histone expression groups to reveal potential molecular mechanisms and biological processes related to histones. First, we constructed a protein-protein interaction network (Figure 4A). Further GO analysis revealed the main functional categories enriched in these genes (Figure 4B). The results showed significant enrichment in multiple functions related to MHC protein complexes, including MHC class II protein complexes, antigen processing and presentation. This finding highlights the potential importance of the immune system in OS, especially in antigen presentation and T cell activation. KEGG pathway enrichment analysis (Figure 4C) showed, in addition to classic tumor-related pathways such as p53 signaling and cell cycle, enrichment in multiple immune-related pathways, including antigen processing and presentation, phagosome formation, and Th17, Th1, and Th2 cell differentiation. This further supports the important role of the immune system in OS development while also suggesting potential immunotherapy strategies.

Functional Enrichment Analysis of Histone-related Differentially Expressed Genes in OS. (A) Protein-protein Interaction Network, Showing Complex Interactions Between Genes. (B) GO Analysis Results. (C) KEGG Pathway Enrichment Analysis Results.
Construction of OS Prognostic Model Based on Histone Modification-Related Genes
Based on single-cell RNA sequencing data and histone modification-related genes, we constructed a prognostic model for OS. This model not only effectively predicts patient prognosis but also reveals potential molecular mechanisms. First, we selected genes with significant prognostic value through LASSO Cox regression analysis (Figure 5A and B). Figure 5A shows the relationship between partial likelihood deviance and log(λ), helping us determine the optimal λ value. Figure 5B displays the coefficient changes of each gene under different L1 norms, and we ultimately selected 9 key genes as prognostic markers. Using these key genes, we calculated a risk score for each patient and divided patients into high-risk and low-risk groups (Figure 5C). Kaplan-Meier survival analysis (Figure 5D) confirmed the predictive power of our model. Patients in the high-risk group had significantly lower overall survival rates than those in the low-risk group (Log-rank P = 2.6e-05, HR = 4.804, 95% CI: 2.312-9.984). Figure 5E further shows the survival status of each patient and the expression patterns of key genes (NPC2, HIST1H4C, PTN, MDK, TPM1, CPE, PSIP1, HACD3, RBBP7). Finally, we evaluated the predictive accuracy of the model using time-dependent ROC curves (Figure 5F). The results showed AUC values of 0.713, 0.845, and 0.888 for 1-year, 3-year, and 5-year predictions, respectively, indicating that the model has stable long-term predictive capability.

Os Prognostic Model Based on Histone Modification-related Genes. (A) Relationship Between Partial Likelihood Deviance and log(λ) in LASSO Regression Analysis. (B) LASSO Coefficient Curve, Showing Coefficient Changes of Each Gene under Different L1 Norms. (C) Distribution of Patient Risk Scores. (D) Kaplan-Meier Survival Curve Based on Risk Scores. (E) Heatmap of Patient Survival Status and Key Gene Expression. (F) Time-dependent ROC Curves of the Prognostic Model.
Validation of the Prognostic Model in External Cohorts and Exploration of Biological Significance
To further validate the reliability and generalizability of our OS prognostic model based on histone modification-related genes, we conducted validation in an independent external cohort and explored the model's biological significance. First, we applied the prognostic model to the external validation set and performed survival analysis (Figure 6A). The results showed that the model maintained good predictive ability in the external validation set, with patients in the high-risk group having significantly lower survival rates than those in the low-risk group (Log-rank P = .045). This result confirms the robustness and generalizability of our model. The model's predictive accuracy was evaluated using ROC curves (Figure 6B). The AUC value reached 0.808 (95% CI: 0.687-0.929), indicating that the model maintained high predictive accuracy in the external validation set.
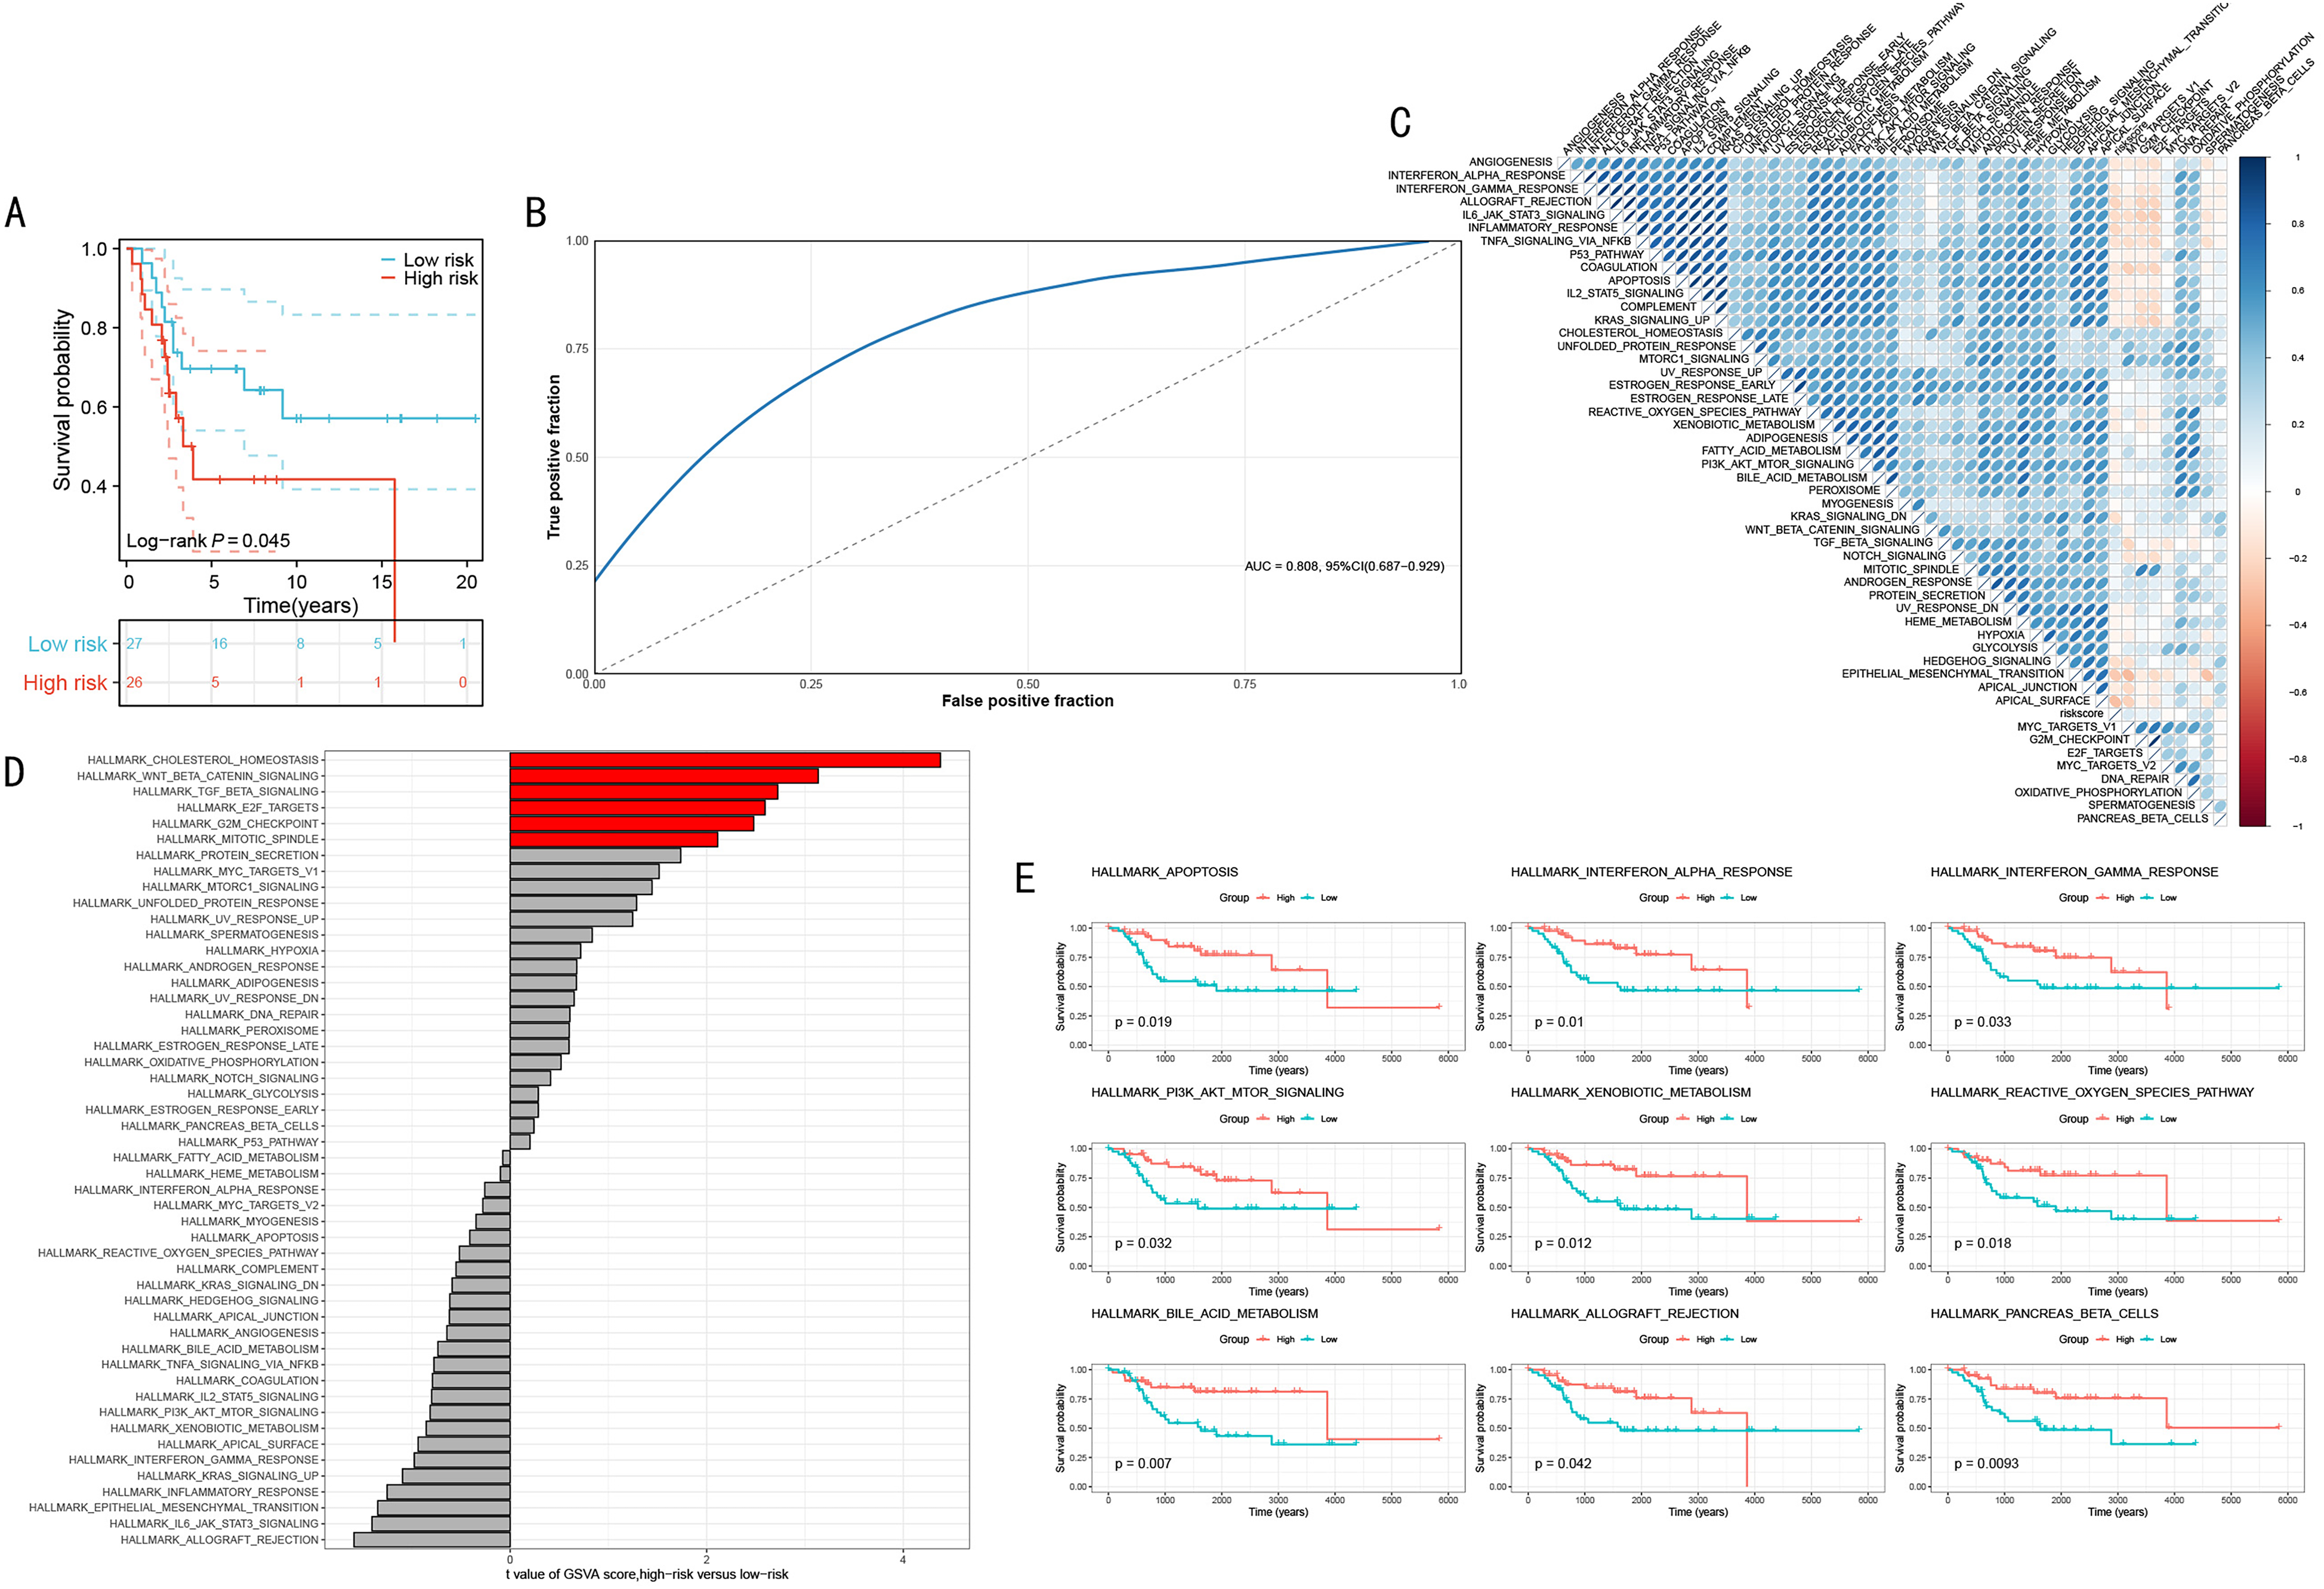
Validation of the Prognostic Model in the External Validation Set and its Biological Significance. (A) Kaplan-Meier Survival Curves in the External Validation Set. (B) ROC Curve in the External Validation set. (C) GSVA Heatmap Between High and Low-risk Groups. (D) Bar Plot of Significantly Different Pathways between High and Low-risk Groups. (E) Survival Analysis Curves of Key Pathways. Survival Differences were Assessed Using Log-rank Tests, Correlation Analyses Used Spearman's Rank Correlation.
To understand the biological significance of the model, we performed GSVA analysis on high and low-risk groups (Figure 6C). The heatmap shows differential expression patterns of multiple signaling pathways and biological processes between the two groups. Figure 6D further quantifies the differences in various pathways between high and low-risk groups. Notably, pathways related to cell cycle and DNA replication were significantly upregulated in the high-risk group, which may explain the poor prognosis of high-risk patients. Finally, we selected 9 pathways significantly associated with prognosis for survival analysis (Figure 6E). These pathways cover multiple important biological processes, including immune response, cell death and survival, metabolism, and oxidative stress. The results show that upregulation of these pathway activities is significantly positively correlated with better patient survival rates. This suggests the need for a more comprehensive perspective in understanding tumor biology, considering the complex interactions between tumor cells, microenvironment, and host response.
Association Analysis of Immune Microenvironment Characteristics and Prognostic Model
Based on the prognostic model, we explored the complex associations between tumor immune microenvironment characteristics and patient prognosis. Specifically, the stromal score was significantly higher in the low-risk group than in the high-risk group (Figure 7A), suggesting that tumors in low-risk patients may have richer stromal components. The immune score showed no statistically significant difference between the two groups (Figure 7B), but the low-risk group tended to have higher scores. The ESTIMATE score was significantly higher in the low-risk group (Figure 7C), suggesting that the tumor microenvironment in the low-risk group may be more complex and heterogeneous overall.
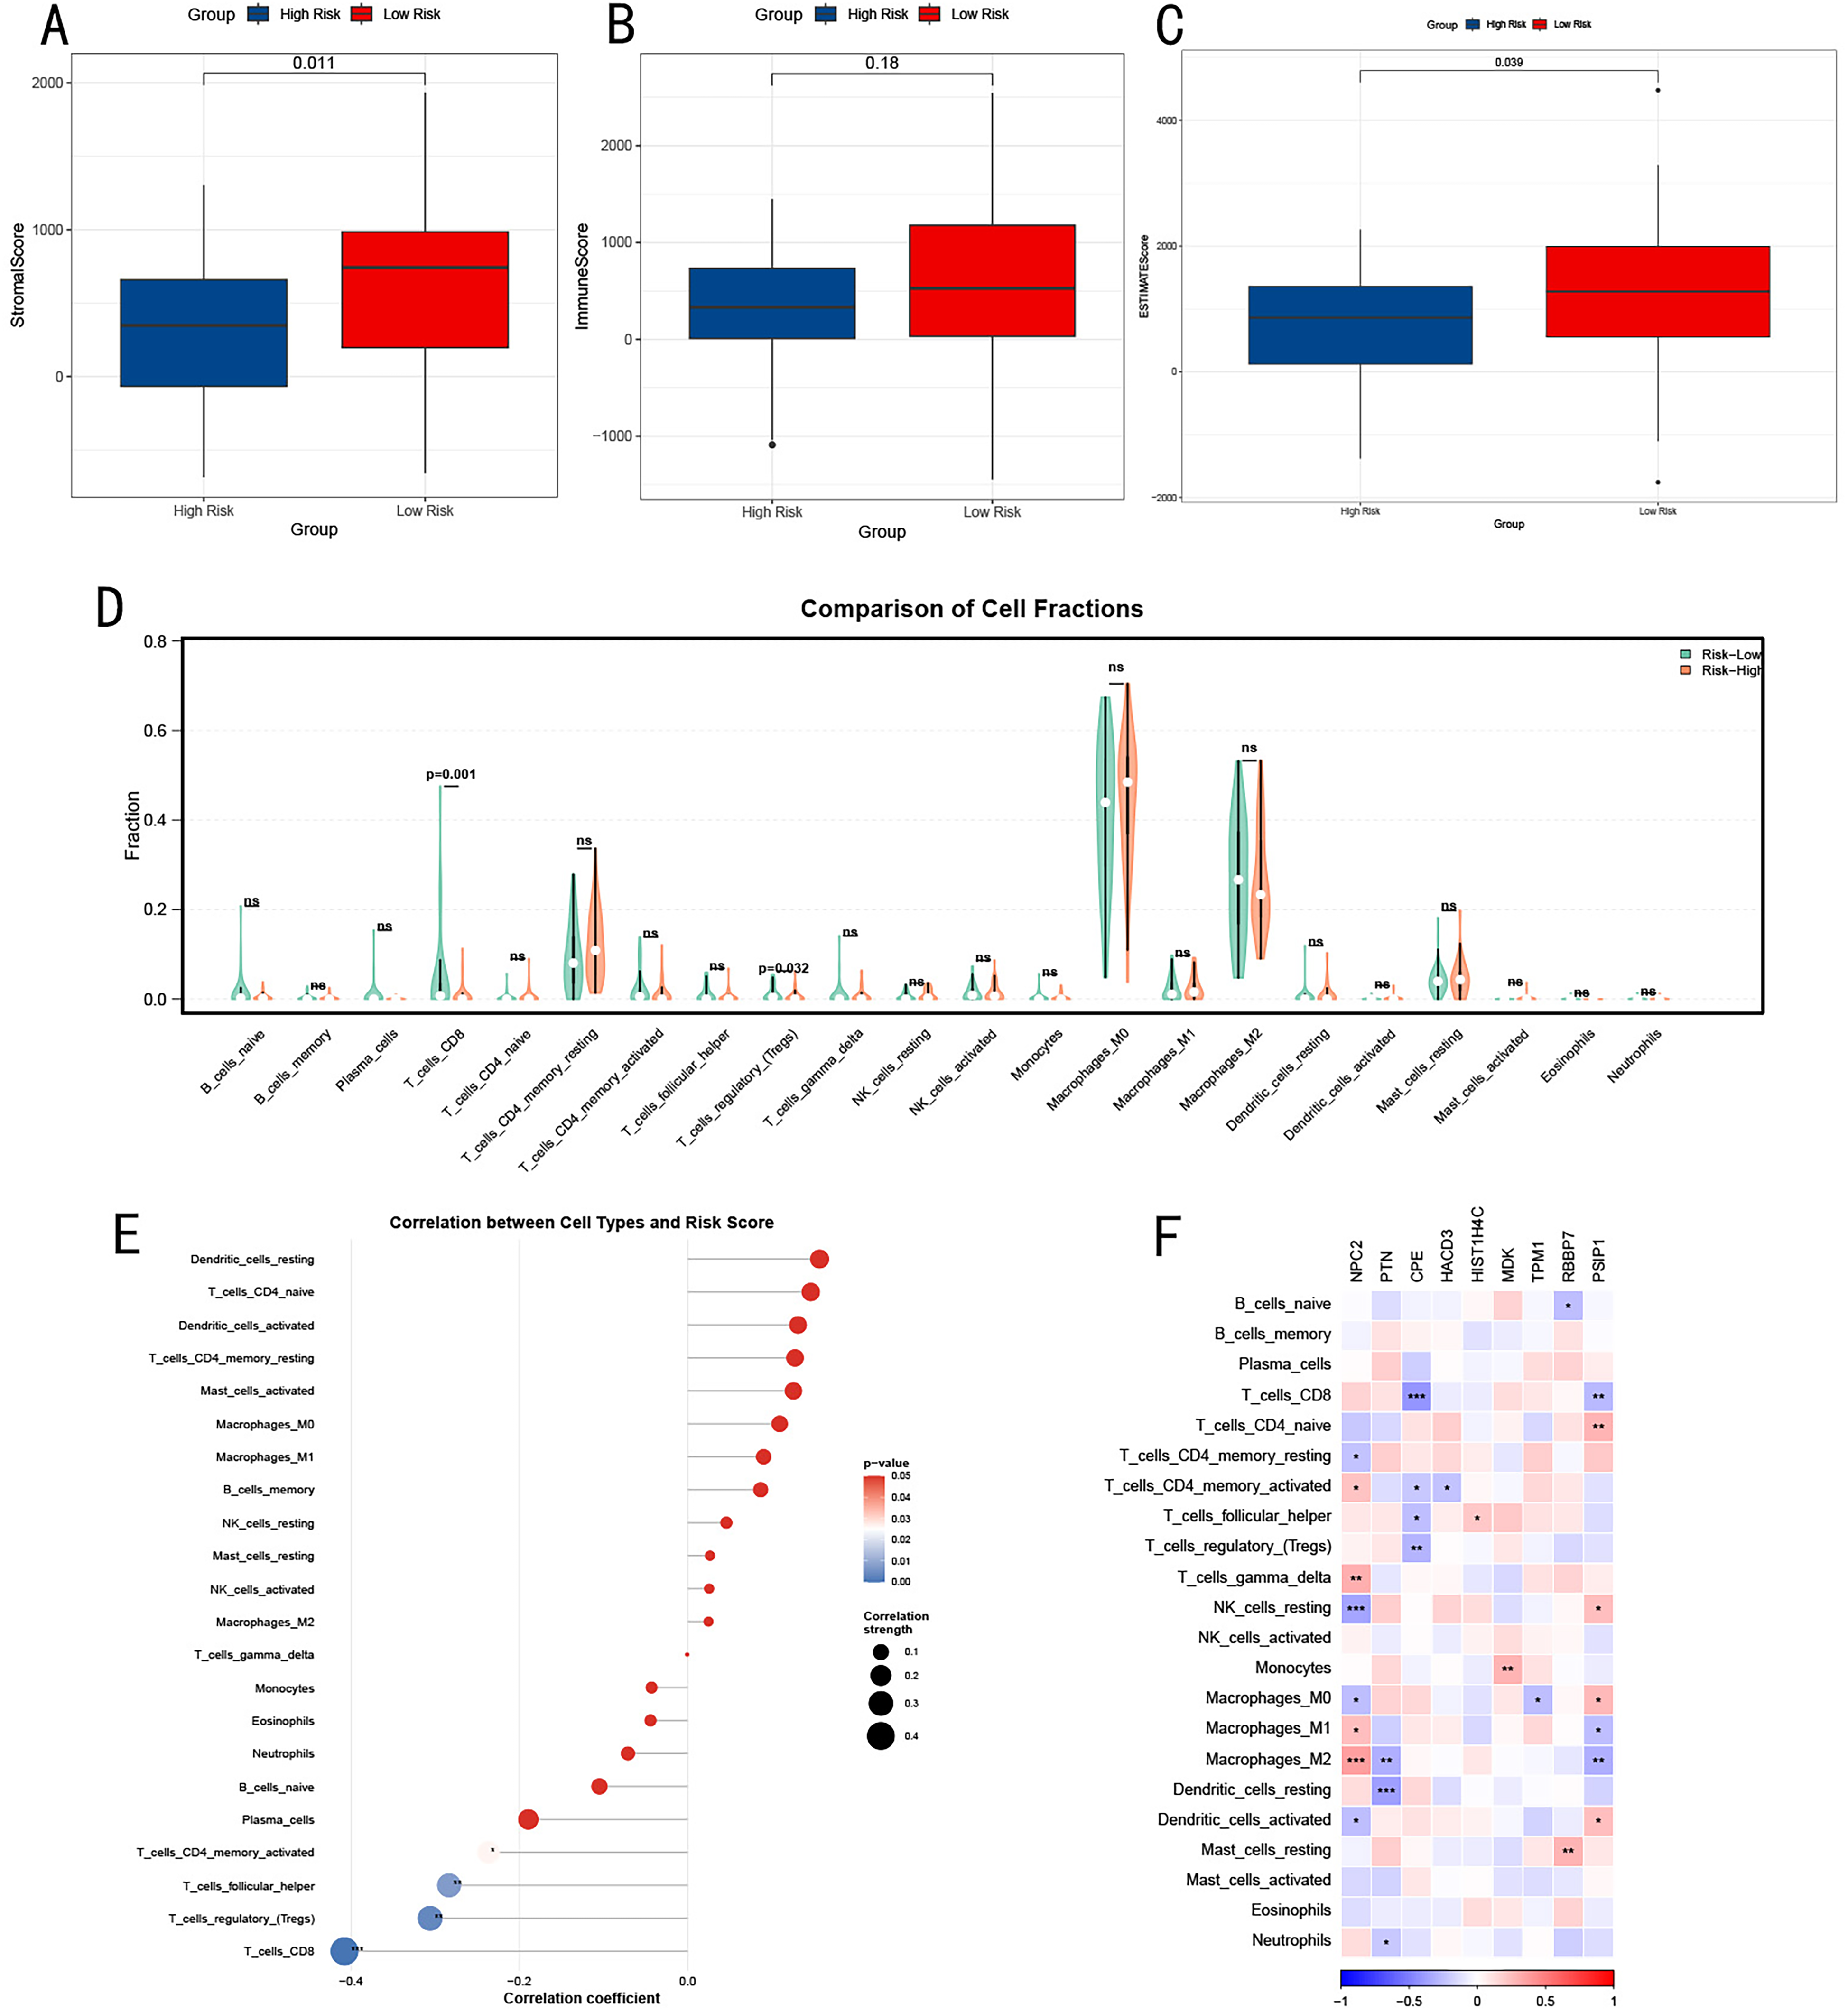
Association Analysis of OS Immune Microenvironment Characteristics and Prognostic Model. (A) Comparison of Stromal Scores Between High and Low-risk Groups. (B) Comparison of Immune Scores Between High and Low-risk groups. (C) Comparison of ESTIMATE Scores between High and Low-risk Groups. (D) Comparison of Proportions of Different Immune Cell Subgroups Between High and Low-risk Groups. (E) Correlation Analysis of Immune Cell SubgroFmethoups and Risk Scores. (F) Correlation Heatmap of Key Genes in the Prognostic Model and Immune Cell Subgroups. Statistical Significance was Determined using Wilcoxon Rank-sum Test, with p-values Displayed above Each Comparison.
We further analyzed the distribution of different immune cell subgroups in high and low-risk groups (Figure 7D). Notably, the proportions of CD8+ T cells and Treg cells were significantly higher in the low-risk group (P = .001, P = .032). Meanwhile, most other immune cell subgroups showed no significant differences between high and low-risk groups, suggesting that a single immune cell type may not be sufficient to explain prognostic differences, and the complex interactions of the entire immune network need to be considered. To better understand the relationship between immune cells and prognosis, we analyzed the correlation between various immune cell subgroups and risk scores (Figure 7E). Dendritic cells, CD4+ naive T cells, resting CD4+ memory T cells, and certain subtypes of macrophages were positively correlated with higher risk scores, while CD8+ T cells, Tregs, follicular helper T cells, and activated CD4+ memory T cells were significantly associated with lower risk scores. Consistent with previous results, this indicates that T cell activation is significantly positively correlated with reduced OS risk.
Finally, we explored the correlation between key genes in the prognostic model and immune cell subgroups (Figure 7F). This analysis revealed potential links between gene expression and immune cell composition. For example, CPE was significantly negatively correlated with CD8+ T cells, Tregs, follicular helper T cells, and activated CD4+ memory T cells. NPC2 was significantly positively correlated with activated CD4+ memory T cells, T cells gamma delta, and macrophages M1 and M2, while negatively correlated with resting CD4+ memory T cells, macrophages M0, and dendritic cells.
Drug Sensitivity
Based on our prognostic model of histone modification-related genes, we further explored the potential application value of this model in guiding drug therapy for OS. By analyzing the sensitivity of high-risk and low-risk patients to different drugs, we discovered some clinically significant differences. Imatinib, a tyrosine kinase inhibitor, showed higher sensitivity in low-risk patients (Figure 8A, P = .0191). Similarly, Rapamycin and Sunitinib also demonstrated higher sensitivity in the low-risk group (Figure 8B and C, P = .00165 and P = .0191, respectively). These results emphasize the potential roles of the mTOR signaling pathway and angiogenesis in OS progression, while also providing more treatment options for low-risk patients. Notably, AKT inhibitor VIII also showed significantly higher sensitivity in the low-risk group (Figure 8F, P = .00635). In contrast, Trametinib and Dabrafenib, two MAPK pathway inhibitors, exhibited higher sensitivity in high-risk patients (Figure 8D and E, P = .0306 and P = .0413, respectively). This finding reveals that the MAPK pathway may play a more critical role in high-risk OS.

Analysis of Drug Sensitivity in OS Patients Based on the Histone Modification-Related Gene Prognostic Model. (A) Imatinib. (B) Rapamycin. (C) Sunitinib. (D) Trametinib. (E) Dabrafenib. (F) AKT inhibitor VIII. All Comparisons were Made Between High-Risk and Low-Risk Groups, with the y-axis Representing Drug Sensitivity (IC50 Values). Statistical Significance was Determined Using two-Tailed Unpaired t-tests, with p-Values Shown for each Comparison. P-Values Indicate the Statistical Significance of Differences Between Groups.
Quantitative Real-time PCR Analysis
We chose the top 5 genes with the highest weights in our model for experimental validation. Based on the qRT-PCR results shown in Figure 9, the expression patterns of the five genes varied significantly among OS cell lines (MG-63 and U2OS) and normal osteoblast cells (hFOB 1.19). CPE, PTN, HIST1H4C, and NPC2 exhibited significantly higher expression levels in both OS cell lines compared to hFOB 1.19 cells (P < .001). Among these, HIST1H4C showed the most pronounced upregulation, with approximately 2.8-fold and 2.5-fold higher expression in MG-63 and U2OS cells, respectively. In contrast, TPM1 demonstrated an opposite trend, with significantly lower expression in OS cells compared to hFOB 1.19 cells (P < .01). Notably, MG-63 cells generally showed higher expression levels of the upregulated genes compared to U2OS cells, suggesting potential cell line-specific differences in gene regulation.

Expression Levels of CPE, TPM1, PTN, HIST1H4C, and NPC2 in OS and Normal Osteoblast Cell Lines. Statistical Analysis was Performed Using One-way ANOVA Followed by Tukey's Post-hoc Test for Multiple Comparisons. Significance is Indicated as: ns = not Significant, *P < .05, **P < .01, ***P < .001. Data are Presented as Mean ± SEM from Three Independent Experiments.
WB Analysis
As shown in Figure 10A-E, WB analysis shows significant difference among these proteins. The quantitative analysis of protein bands is shown in Figure 10F, the results showed that CPE expression was significantly higher in MG-63 cells (1.00 ± 0.11) and U2OS cells (0.84 ± 0.07) compared to hFOB 1.19 cells (0.63 ± 0.04). TPM1 exhibited an opposite trend, with lower expression in MG-63 cells (1.00 ± 0.03) and U2OS cells (1.41 ± 0.08) compared to hFOB 1.19 cells (1.80 ± 0.01). PTN expression gradually decreased from MG-63 cells (1.00 ± 0.04) to U2OS cells (0.85 ± 0.03) and hFOB 1.19 cells (0.52 ± 0.02). Similarly, HIST1H4C showed higher expression in OS cells (MG-63: 1.00 ± 0.09; U2OS: 0.83 ± 0.06) compared to hFOB 1.19 cells (0.37 ± 0.02). NPC2 expression followed a similar pattern, with higher levels in MG-63 cells (1.00 ± 0.06) and U2OS cells (0.79 ± 0.02) compared to hFOB 1.19 cells (0.51 ± 0.02).

Validation of Protein Expression by Western Blot Analysis. (A-E) Representative Western Blot Images Showing the Expression Levels of CPE, TPM1, PTN, HIST1H4C, and NPC2 in OS cell Lines (MG-63 and U2OS) and Normal Osteoblast Cells (hFOB 1.19). (F) Quantitative Analysis of Protein Expression Levels Normalized to GAPDH. Statistical Analysis was Performed Using One-way ANOVA Followed by Tukey's Post-hoc Test for Multiple Comparisons. Significance is Indicated as: ns = not Significant, *P < .05, **P < .01, ***P < .001. Data are Presented as Mean ± SEM from Three Independent Experiments.
Discussion
The spatial heterogeneity of histone modifications in the OS microenvironment is a key finding of this study, and its biological significance and potential clinical impact merit in-depth discussion. 23 First, we observed significant differences in histone modification levels between different cell types, particularly high levels in OS cells and endothelial cells. This difference may reflect the distinct functions and epigenetic regulatory mechanisms of various cell types in tumor progression. High levels of histone modifications may confer stronger proliferative capacity and adaptability to OS cells,2,24 while high modification levels in endothelial cells may be closely related to tumor angiogenesis.25,26 Second, our cell-cell communication network analysis revealed potential associations between histone modifications and cellular interactions. In particular, we found that signaling pathways such as SPP1, CypA, MIF, IGFBP, and VEGF are significantly active in OS, all of which are related to histone modifications.27–32 This finding highlights the important role of histone modifications in regulating cell-cell dialogue in the tumor microenvironment, providing a new perspective for understanding the complex biological processes of OS. Finally, the spatial heterogeneity of histone modifications may have profound implications for OS treatment strategies. Traditional global treatment approaches may struggle to effectively address this heterogeneity, thus developing targeted therapeutic strategies for specific cell types or specific histone modification patterns may be more effective. 33 For example, histone deacetylase inhibitors targeting OS cells and endothelial cells may become promising treatment options.34–37
Furthermore, based on our research findings, we can propose an innovative perspective that there exists a complex “epigenetic-immune” regulatory network in OS, which may play a crucial role in tumor progression and patient prognosis. First, our data reveal that histone modifications may have an important regulatory role in immune cell infiltration. In particular, we observed significantly higher proportions of CD8+ T cells and Treg cells in low-risk group patients. This finding inspires us to propose a new hypothesis: specific histone modification patterns may create a microenvironment favorable for T cell infiltration by regulating the expression of chemokines and cell adhesion molecules. This “epigenetic immune remodeling” mechanism may be one of the key factors affecting the immune microenvironment of OS.38–40 Second, our study shows that immune microenvironment characteristics are closely related to patient prognosis. Specifically, the activation of T cell subsets is significantly associated with reduced OS risk. This finding not only emphasizes the importance of the immune system in OS progression but also implies the potential existence of an “epigenetic-immune prognostic fingerprint”. We speculate that certain specific histone modification patterns may influence patient long-term prognosis by affecting the functional state of immune cells (such as T cell activation and exhaustion). 41 This fingerprint could become a powerful tool for predicting patient prognosis and guiding treatment decisions.
Notably, our study found that Tregs and CD8+ T cells were both associated with the low-risk OS group, which seems to contradict the traditional understanding that Tregs suppress CD8+ T cell activation/effector function. 42 However, this phenomenon may reflect a dynamic equilibrium in the tumor immune microenvironment. Several possible explanations exist: First, increased Tregs might be a feedback regulation to pre-existing strong anti-tumor immune responses, indicating that the immune system has been effectively activated; Second, Tregs in OS may exhibit functional heterogeneity, with certain subgroups potentially not suppressing anti-tumor immunity; Third, Tregs might prevent tumor progression by inhibiting pro-inflammatory cytokine storms and excessive inflammatory responses that could promote tumor-associated inflammation. Furthermore, recent studies have suggested that in certain tumor types, tumor-infiltrating Tregs are associated with better prognosis, especially when they coexist with high levels of CD8+ T cells, possibly reflecting an active but controlled immune response. These findings highlight the necessity for more in-depth research on Tregs and CD8+ T cell functions and interactions in OS to develop more effective immunotherapeutic strategies.
Subsequently, based on the above findings, we propose an innovative treatment strategy: the synergistic combination of histone modification-targeted therapy and immunotherapy. Specifically, we can design a “double-hit” strategy: first using histone deacetylase inhibitors (such as Vorinostat, which has shown efficacy in other cancers 43 ) to reshape the tumor microenvironment, making it more conducive to immune cell infiltration and activation; then combining with immune checkpoint inhibitors (such as PD-1/PD-L1 inhibitors) to further enhance anti-tumor immune responses. This strategy may not only enhance the effect of single treatments but also overcome the current limited efficacy of immunotherapy in OS. At the same time, our research has inspired a new research direction: developing “epigenetically guided personalized immunotherapy”. By analyzing histone modification patterns and immune microenvironment characteristics of patient tumor samples, we may be able to predict patient responses to different immunotherapy strategies, thereby tailoring optimal treatment plans for each patient.
Based on our research results, we propose a potentially highly impactful “epigenetically guided personalized medication strategy” that has the potential to fundamentally change the treatment approach for OS. This innovative approach integrates epigenetics, precision medicine, and drug sensitivity prediction to form a comprehensive treatment framework. Specifically, this strategy includes five key steps: First, comprehensive histone modification analysis of patient tumor samples; Second, risk assessment and stratification using our developed prognostic model; Third, predicting the potential efficacy of various drugs based on the patient's histone modification pattern and risk grouping; Fourth, designing personalized treatment plans based on prediction results, possibly including specific combinations of epigenetic regulators, traditional chemotherapy, and targeted drugs; Finally, dynamic monitoring and adjustment during treatment, optimizing treatment strategies in real-time based on changes in tumor epigenetic status. This personalized medication strategy based on histone modifications not only has the potential to significantly improve treatment efficacy but may also reduce unnecessary toxic reactions, providing more precise and effective treatment options for OS patients. More importantly, this innovative approach may not only bring breakthrough progress in OS treatment but also provide a new paradigm for personalized treatment of other types of cancers, potentially having a far-reaching impact in the broader field of tumor therapy.
Limitation
Despite our significant advancements in understanding histone modifications and personalized treatment in OS, we acknowledge certain limitations in our current study, which also point towards directions for future research. Firstly, our study primarily relies on bioinformatics analysis and single-cell RNA sequencing data. While these provide rich information, they lack direct experimental validation. Notably, our proposed “epigenetic-immune” regulatory network hypothesis, although potentially clinically significant, requires further in vitro and in vivo experimental validation. Such validation would not only enhance the reliability of our conclusions but could also reveal additional unknown molecular mechanisms.
Secondly, while our research focuses on histone modifications, we recognize that epigenetic regulation is a complex, multi-layered system. Therefore, we propose that future studies should adopt an integrated multi-omics approach. This method could simultaneously consider multiple aspects of epigenetic information, including DNA methylation, non-coding RNA regulation, and chromatin accessibility, combined with proteomics and metabolomics data, to construct a more comprehensive molecular characteristic map of OS. This multi-dimensional analysis would not only provide a more thorough understanding of disease mechanisms but could also uncover new therapeutic targets and biomarkers.
Conclusion
This study, through the integration of single-cell RNA sequencing data and large-scale clinical information, systematically revealed the spatial heterogeneity of histone modifications in OS and their clinical significance for the first time. We discovered significant differences in histone modifications among different cell types, closely related to cell-cell communication networks. Based on these findings, we successfully constructed a prognostic model using histone modification-related genes, which demonstrated excellent predictive performance across multiple independent cohorts. Further analysis revealed complex associations between histone modifications, the immune microenvironment, and drug sensitivity, providing new theoretical foundations for immunotherapy and personalized medication strategies in OS. Building on these results, we proposed an innovative “epigenetic-guided personalized medication strategy,” encompassing epigenetic analysis, risk assessment, drug sensitivity prediction, personalized treatment plan design, and dynamic monitoring and adjustment. This comprehensive strategy not only holds promise for significantly improving the treatment efficacy of OS but may also provide a new paradigm for precision medicine in other cancer types.
Footnotes
Abbreviations
Acknowledgements
The authors would like to thank all the researchers and technical staff who contributed to this study. We especially appreciate the bioinformatics support from our institution's data analysis center. We are grateful to all the reviewers for their valuable comments that helped improve this manuscript.
Consent for Publication
All co-authors consent to publication.
Author Contributions/CRediT
YY and XT contributed equally to this work and share first authorship. YY and XT performed the data analysis and wrote the manuscript. ZL conceived and designed the study, supervised the research, and critically revised the manuscript. All authors read and approved of the final manuscript.
Funding
The authors received no financial support for the research, authorship, and/or publication of this article.
Conflicting Interests
The authors declared no potential conflicts of interest with respect to the research, authorship, and/or publication of this article.
Data Availability
The original contributions presented in the study are included in the article/Supplementary material, further inquiries can be directed to the corresponding authors.