
Abstract
Background
Clear cell renal cell carcinoma (ccRCC) is a widespread urogenital neoplasm. However, the therapeutic efficacy of these methods is unsatisfactory. In-depth screening of biomarkers could aid early diagnosis and therapy and predict patient prognosis.
Methods
The GEO datasets were selected with specific criteria. Differentially expressed gene (DEG), weighted gene coexpression network analysis (WGCNA), protein–protein interaction, LASSO, random forest, and Cox regression analyses were applied to identify the independent prognostic biomarkers. Survival analysis, correlation with clinical features, gene set enrichment analysis (GSEA), GO enrichment, immune infiltration analysis, and correlation with cuproptosis-related genes were carried out to determine the prognostic value and possible molecular mechanisms of the TSVR. Wound healing assays, transwell assays, cell colony formation experiments, flow cytometry, and immunohistochemistry (IHC) analysis were used to validate the functional attributes of CRYL1.
Results
Four GEO datasets were included to screen for hub genes. DEG combined with WGCNA showed a key module with 300 genes having the strongest correlation with “survival state” (R2 = -0.24 and P = 7e−8); six genes were identified by LASSO, random forest, and Cytoscape. Finally, CRYL1 (hazard ratio (HR) = 2.01, P < 0.001) was selected as an independent prognostic biomarker. The higher CRYL1 expression group had better DFS and overall survival (OS). GSEA demonstrated that the CRYL1-related DEGs were enriched mainly in the metabolism of sugar, fat, and amino acids. CRYL1 is positively correlated with FDX1 and the LIAS pathway, which are important molecule involved in cuproptosis. CRYL1 affects the infiltration abundance of four immune cells and can predict a positive OS. Wound healing, transwell, cell colony formation, and flow cytometry assays demonstrated that CRYL1 silencing enhances migration and proliferation and leads to a decreased apoptotic ratio. IHC analysis suggested that CRYL1 was highly expressed in adjacent tissues.
Conclusions
CRYL1 is a robust predictive marker for clinicopathological characteristics and survival status in ccRCC patients.
Introduction
Renal cell carcinoma (RCC) is a widespread urogenital malignancy. It is estimated that in 2022, China is expected to experience 77,410 new cancer cases and 46,345 cancer-related fatalities. 1 RCC comprises more than 10 histological types, of which clear cell renal cell carcinoma (ccRCC) is the most prevalent type and is responsible for the majority of fatalities related to tumors. 2 Localized ccRCC can be treated effectively via surgery. Nevertheless, approximately 20% to 40% of patients suffer cancer progression or even death after curative intent surgery.3,4 Chemotherapy and immunotherapy alone or in combination are recommended for treating progressive ccRCC. Although significant advances in immune checkpoint inhibitors and antiangiogenic drugs and enhanced clinical benefits have been shown in many clinical studies, 5 metastatic RCC has a bleak prognosis boasting a 5-year overall survival (OS) rate of less than 5%. 6 In the era of precision therapy, high-throughput sequencing has enabled us to identify new biomarkers related to the pathogenesis of ccRCC. In-depth screening of these biomarkers could help discover reliable targets for early diagnosis and therapy, and predicting the prognosis of ccRCC patients.
In the present study, CRYL1 was screened as a robust prognostic factor for ccRCC using various public databases, including The Cancer Genome Atlas (TCGA) and GEO. Human CRYL1, also known as crystallin lambda 1, was found in 2003 and is located at chromosomal region 13q12.11. The protein encoded by CRYL1 contains two HCDH domains, and it was speculated that the protein has a function similar to that of 3-hydroxyacyl-CoA dehydrogenase. CRYL1 mRNA is highly expressed in the liver and kidney, but is expressed at low levels in peripheral blood leukocytes and the thymus. 7 Further research showed that CRYL1 was expressed at lower levels in HCC tumors than in adjacent tissues, and this reduced expression was associated with advanced tumor staging, larger tumors, and decreased patient disease-free survival. 8 The potential molecular mechanism involves increasing the number of pro-apoptotic cells through the induction of PARP cleavage and prolonging the G(2)-M phase by disrupting the Cdc2/cyclin B pathway. 9 Nonetheless, there are not enough data on the pathological function of CRYL1 or its involvement in ccRCC. Through multiple experiments in the present study, the differential expression of CRYL1 between ccRCC tissues and adjacent tissues was validated, demonstrating its anticancer effect on renal cancer cell lines. Furthermore, various bioinformatics analyses have been conducted, offering potential directions for the subsequent investigation of molecular mechanisms, such as immunology and cuproptosis. This evidence contributes to the understanding of the role of CRYL1 in ccRCC and provides valuable insights for future research on its molecular mechanisms.
Materials and Methodologies
Data Acquisition
The bioinformatics screening process is illustrated in Figure 1a. The novel website GEOexplorer (https://geoexplorer.rosalind.kcl.ac.uk/) enables users to perform interactive and reproducible gene expression analyses of microarray and RNA-seq datasets. 10 Four gene expression datasets (GSE36895, GSE40435, GSE53757, and GSE66272) were acquired from GEOexplorer with the following criteria: contained at least 20 paired ccRCC and normal tissues. The following samples in the GEO datasets were excluded: no matched normal or tumor tissue or pathological type was not ccRCC. The TCGA database (up to March 10, 2022; https://portal.gdc.cancer.gov/) provided the validation cohort data. Patients with incomplete survival data were excluded.

Bioinformatics analysis schematic and volcano and Venn plots of DEGs. (a) Bioinformatics analysis schematic. (b) Volcano plots visualizing the DEGs in the GSE66272, GSE53757, GSE36895, and GSE40435 datasets. Venn diagrams showing the overlapping DEGs of downregulated genes and upregulated genes. DEG: differentially expressed gene.
Differentially Expressed Gene Identification
The results of the differential gene expression analysis were downloaded from GEOexplorer.
For differentially expressed gene (DEG) analysis, the criteria were set at logFoldchange > 1 and adj P < 0.05. The ggplot2 R package was used to display the outcomes of the DEG analysis. The intersecting DEGs between the four GEO datasets were calculated and visualized by the vennDiagram R package.
Weighted Gene Coexpression Network Analysis
The weighted gene coexpression network analysis (WGCNA) approach can detect the coexpressed gene sets strongly correlated with clinical phenotypes. 11 In this study, the intersecting DEGs of four GEO datasets were subjected to WGCNA using ccRCC cohort data from the TCGA. The WGCNA R package was utilized for WGCNA with the following thresholds: cutHeight = 5000, softPower = 4, minModuleSize = 30, and MEDissThres = 0.1. The gene sets with the strongest correlation with “survival state” were selected for further analysis.
Protein–Protein Interaction Network Construction
The turquoise module of the WGCNA showed the strongest correlation with survival. The most robust prognostic molecules in the turquoise module were identified. Protein‒protein interaction (PPI) networks were constructed through the Search Tool for the Retrieval of Interacting Genes/Proteins (STRING) (http://string-db.org) 12 website. Moreover, Cytoscape software was used for the visualization of interaction networks, 13 and to obtain the strong-connecting subnetwork, the MCODE plugin in Cytoscape was utilized, with default parameter values (node score threshold ≥ 0.2, degree threshold ≥ 2, K-core value ≥ 2, and maximum depth = 100).
Candidate Hub Gene Identification
LASSO 14 and random forest are useful algorithms capable of screening core molecules from a gene set. In this study, the R packages LASSO and randomForestSRC were used to identify robust prognostic variables. The overlapping genes were viewed as candidate hub genes.
Cox Regression Analysis and Hub Gene Identification
Cox regression was used to analyze the independent prognostic variables according to the potential hub genes and valuable clinical features. The data were visualized by a forest plot with the survival R package. The independent prognostic variable was defined as the hub gene. Moreover, a nomograph diagram was drawn.
Verification of Hub Gene Expression and HPA Analysis
TCGA-KIRC patients were used as the validation cohort. The paired samples were chosen for analysis of the expression levels of the hub genes. Moreover, paired sample analysis of four GEO datasets was performed using the ggpubr R package to determine the RNA expression levels of the hub genes. Immunohistochemical images were downloaded from the HPA (https://www.proteinatlas.org/) database. ImageJ software was used to quantitatively analyze the immunohistochemical staining. The threshold value was automatically selected. GraphPad software was used to visualize the results.
Evaluation of Survival and Clinicopathological Features
Survival analysis was performed using GEPIA (http://gepia.cancer-pku.cn/). 15 Clinicopathological characteristic evaluation was carried out through UALCAN (http://ualcan.path.uab.edu/).16,17
Gene Set Enrichment Analyses and GO Analysis
Gene set enrichment analysis (GSEA) 18 and GO 19 are normal algorithms used to investigate the prospective biological role of genes. In this study, TCGA-KIRC patients were first segregated into two categories according to the median expression level of the hub gene. Furthermore, DEG analysis was performed with the limma R package, applying adj. P < 0.05 and logFC > 1 were used as criteria. GO analysis was performed using the clusterProfiler package, setting the thresholds at pvalueCutoff = 0.01 and qvalueCutoff = 0.05. GSEA was conducted using GSEA software using with the “c2.cp.kegg.v7.0.symbols.gmt” gene set as a reference. The significance thresholds were set at a normal P-value less than 0.05 and an FDR less than 25%.
Immune Infiltration Analysis
The CIBERSORTX website (https://cibersortx.stanford.edu/) was utilized to calculate the infiltration abundance of 22 different immune cell types. 20 Moreover, the results were further visualized by the ggplot2 and vioplot R packages. The associations between immune infiltrates and clinical outcomes were determined with TIMER 2.0 (http://timer.cistrome.org/). 21
Correlations Between the Hub Genes and Genes Related to Cuproptosis
Ten cuproptosis-related genes were extracted from a recent article. 22 The correlation between the expression of the genes was analyzed using TIMER2.0. Additionally, the imma R package was used to compare the expression of 10 genes related to cuproptosis between the high- and low- expression groups of the hub genes. The data were visualized in a bee swarm diagram by the ggplot2 R package.
Cell Culture
The caki1 and OSRC2 RCC cell lines, sourced from the Chinese Academy of Sciences Cell Bank, were grown in RPMI-1640 medium supplemented with 10% fetal bovine serum (FBS). The cells were maintained at 37 °C in an environment with 5% CO2.
Western Blotting and qPCR
Three siRNA-156(/rG//rG//rU//rG//rA//rA//rA//rC//rU//rC//rU//rA//rU//rG//rA//rC//rA//rU//rU/TT), siRNA-209(/rU//rC//rA//rG//rA//rA//rA//rG//rG//rA//rG//rA//rU//rG//rA//rA//rG//rU//rU/TT), siRNA-306(/rC//rC//rA//rA//rG//rA//rA//rG//rC//rA//rG//rU//rA//rG//rA//rG//rG//rG//rU/TT) and siRNA-NC(/rU//rU//rC//rU//rC//rC//rG//rA//rA//rC//rG//rU//rG//rU//rC//rA//rC//rG//rU/TT) were obtained from General Biol(Anhui). Cell lysates were prepared, and protein concentrations were measured with a BCA Kit (Yeasen Co., Ltd, Shanghai, China). anti-CRYL1 antibody and anti-actin antibody were obtained from Abcam Plc and Proteintech, respectively. qPCR was performed in two steps. The cDNA synthesis kit and RT‒qPCR kit were obtained from Yeasen Biotechnology (Shanghai) Co., Ltd The primers used for CRYL1 were 5′-GTGGTGATCGTTGGCAGTG-3′ (forward) and 5′-TTCCTTATCTGCTGTTGCTCAAT-3′ (reverse). The primers used for actin were 5′-CATGTACGTTGCTATCCAGGC-3′ (forward) and 5′-CTCCTTAATGTCACGCACGAT-3′ (reverse).
Wound Healing Assay
Caki1 and OSRC2 cells were added to 6-well plates to create a confluent monolayer. Linear scratches were made using a 200 µm pipette tip. The migration of cells into the scratched areas was monitored and photographed after 24 h and 48 h.
Transwell Assay
Transwell chambers with Matrigel-coated membranes were used to assess invasion potential. A total of 100000 caki1 cells and 20000 OSRC2 cells were seeded in the upper chamber with supplemented 1% FBS, while the lower chamber contained 20% FBS. After the caki1 cells were incubated for 24 h and the OSRC2 cells were incubated for 12 h, the noninvading cells were removed, and the invading cells were stained, imaged, and quantified.
Immunohistochemistry Analysis
Forty paired paraffin tissue samples of ccRCC were collected from Lishui People's Hospital from May 2012 to May 2022. Hematoxylin and eosin staining were used to screen the optimal tissue. The tissues were incubated with CRYL1 antibody (1 µg/µl) and matched rabbit antibody for approximately 30 min. Ten typical images from each patient were taken under a 20X microscope for analysis.
Cell Clone Experiment
Two hundred cells were seeded in a 6-well plate and cultured for 1-2 weeks. When 50 or more clones were present, 4% paraformaldehyde(20 min) and 0.2% crystal violet (30 min) were applied to fix and stain the clones, respectively.
Cell Apoptosis Detection
After trypsin digestion without EDTA, the tumor cells were collected by centrifugation at 300 × g for 5 min at 4 °C. After two PBS washes, the cells were resuspended in 100 μL of binding buffer (1×). After resuspension, 5 µL of Annexin V-FITC solution and 10 µL of PI staining solution were mixed with the cells, and the mixture was incubated for 10-15 min. Next, 400 µL of binding buffer was added (1×). Subsequently, the cell suspension was tested using a flow cytometer (BD FACSCanto II, USA).
Results
Data Collection and DEG Analysis
The GSE36895, GSE40435, GSE53757, and GSE66272 datasets were screened from in the GEO database. Among them, 23 pairs of samples with successfully matched tumor and normal tissues in the GSE36895 dataset were included. One sample in the GSE66272 dataset was excluded because it was a sarcoma sample. Eventually, 23 paired samples in the GSE36895 dataset, 101 paired samples in the GSE40435 dataset, 72 paired samples in the GSE53757 dataset, and 26 paired samples in the GSE66272 dataset were included. The TCGA validation cohort was composed of 519 samples after removing samples with incomplete clinical information. A total of 2294, 12060, 1987, and 5430 DEGs were identified in the GSE36895, GSE40435, GSE53757, and GSE66272 datasets, respectively (Figure 1b). A total of 408 genes were upregulated in common, along with 528 genes that were downregulated in common (Figure 1b).
WGCNA
A total of 936 shared DEGs across four GEO datasets and three clinical traits (“fustat,” “T,” and “stage”) were used to perform WGCNA (Figure 2a). Seven modules were ultimately identified. According to the “module-trait relationships” heatmap, the turquoise module, composed of 300 genes exhibited the strongest correlation with the “fustat” trait (Figure 2d). Moreover, the correlations between the turquoise module and the clinical traits of “T” (Figure 2e), “fustat” (Figure 2f), and “stage” (Figure 2g) are displayed. Herein, the turquoise module was viewed as the key module.

The coexpression gene network was identified using WGCNA. (a) Clustering dendrogram of the TCGA-KIRC cohort and heatmap of three clinical features. “T” means “T stage,” “stage” means “clinical stage,” and “fustat” means “vital status of sample.” (b) Cluster dendrogram. Modules with different colors represent different gene sets. (c) Clustering of module eigengenes with a 0.20 cutoff height. (d) Heatmap displaying the relationship between modules and clinical features. (e-g) Scatter diagrams showing the correlation between the turquoise module and the clinical traits T (e) and Fustat (f) and stage (g). TCGA: The Cancer Genome Atlas; WGCNA: weighted gene coexpression network analysis.
Hub Gene Identification
For the turquoise module, PPI network construction and LASSO and Cox regression analyses were further conducted to discover robust prognostic genes. Nine clusters and 61 genes were screened out by the MCODE plugin of Cytoscape software (Figure 3a). The scores of the top three clusters were 10.941, 4.5, and 3.778. Since there were too many 61 genes to guide clinical work, LASSO, and random forest analyses were performed for further screening. Nineteen genes were identified by LASSO (Figure 3b), and six genes were identified by random forest analysis. The six overlapping genes identified by LASSO and random forest analyses were considered candidate hub genes. Multivariate Cox regression was performed to obtain further insight into independent prognostic elements within the candidate hub genes and four clinical traits. Finally, age (hazard ratio (HR) = 0.66, P = 0.0132), stage (HR = 5.01, P < 0.001), and CRYL1 expression (HR = 2.01, P < 0.001) were found to be independent prognostic factors (Figure 4a). Moreover, a nomograph diagram was drawn using three independent prognostic variables. (Figure 4b).

MCODE and LASSO analysis. (a) The nine clusters screened by the MCODE plugin of Cytoscape. (b) Sixty-one genes were further selected using LASSO regression. Each curve (right image) corresponds to a gene. These curves depict the trajectory of a gene's coefficient in relation to the L1-norm. The count of nonzero coefficients at the present state defines the effective degrees of freedom for the LASSO. The optimal lambda value was typically chosen based on the corresponding values associated with the left dashed line of the left image.
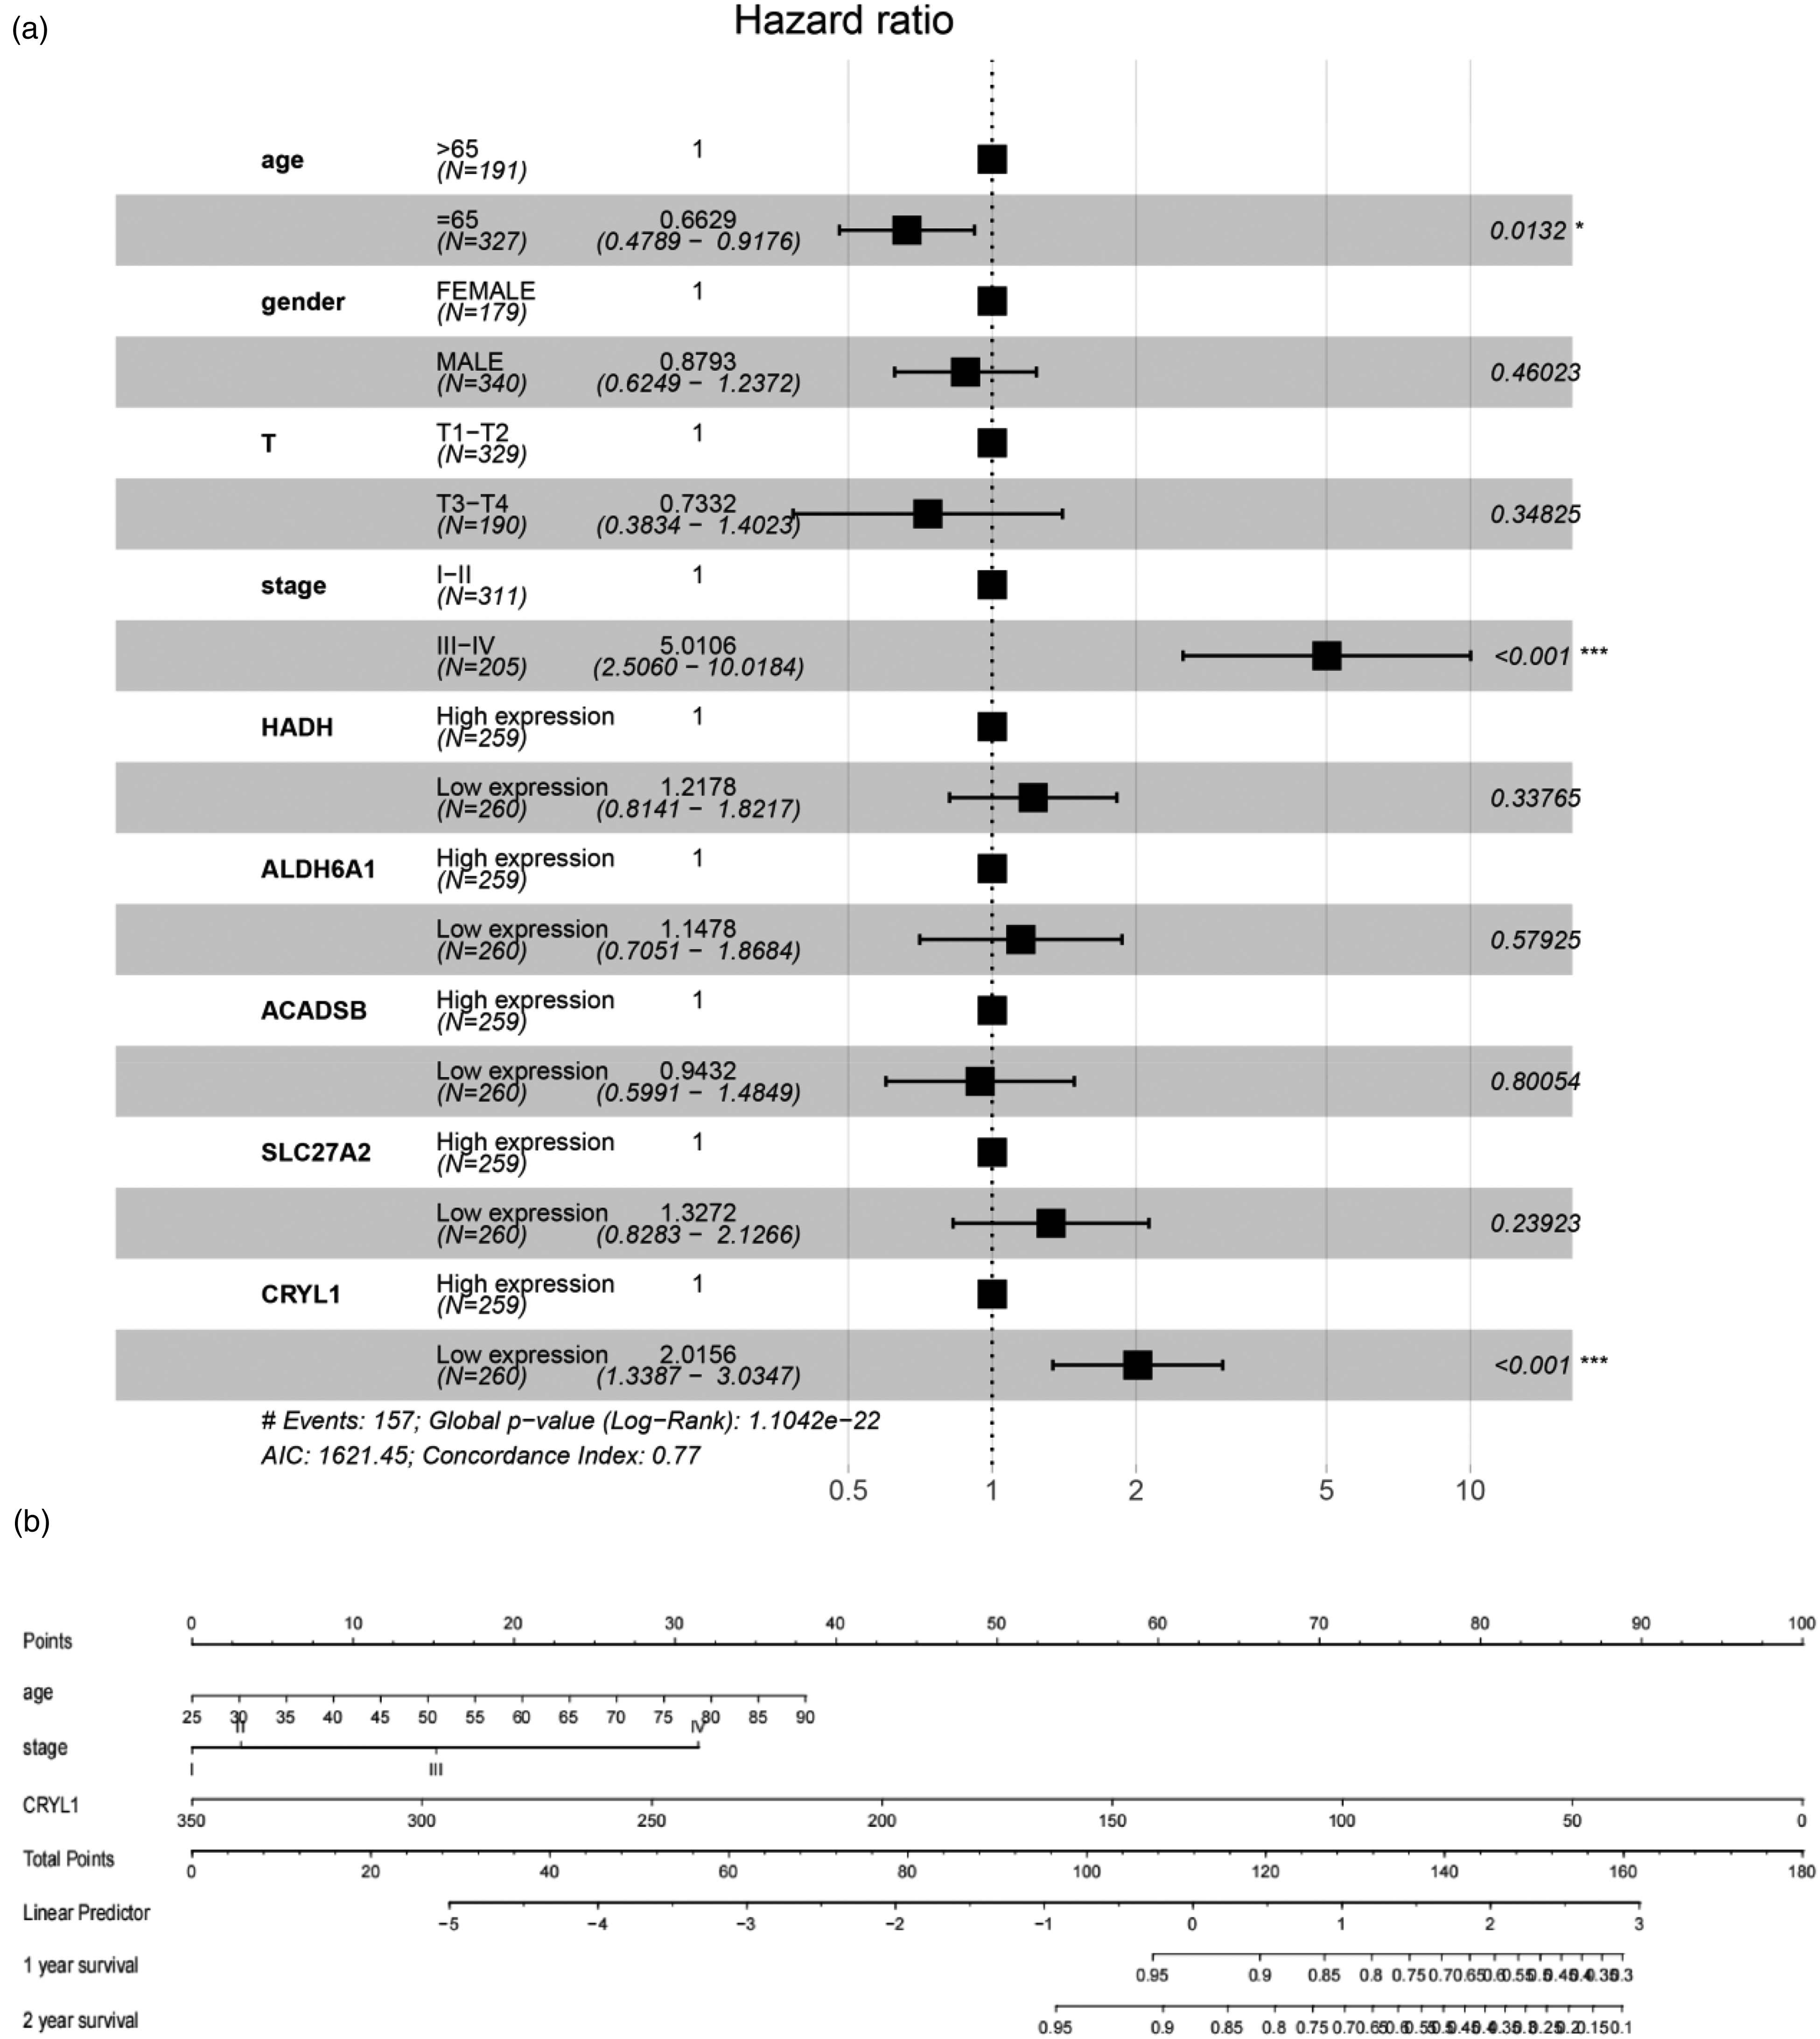
Cox multivariate regression and nomogram plot. (a) Forest plot displaying the Cox multivariate regression analysis of four clinical traits and five candidate hub genes. Age, stage, and CRYL1 were identified as independent prognostic factors for survival. (b) Independent survival prognosis factor nomogram plot for predicting patient death likelihood.
Verification of CRYL1 Expression at the Transcriptional and Posttranscriptional Levels
CRYL1 transcription was verified in paired samples from the TCGA-KIRC cohort and four GEO datasets (Figure 5a). HPA analysis was subsequently conducted to determine expression of CRYL1 at the posttranscriptional level (Figure 5b). Typical immunohistochemical images of normal tissue and tumor tissue (Figure 5b) are displayed. Moreover, the subcellular location of CRYL1 was checked using the HPA database (Figure 5c). CRYL1 was shown to localize mainly to the nucleoplasm, nucleoli and plasma membrane through fluorescence imaging. The quantitative statistics of both the intDen/area (Figure 5d) and %area (Figure 5e) of the immunohistochemistry (IHC) images demonstrated that CRYL1 was more highly expressed in normal tissue than in tumor tissue.
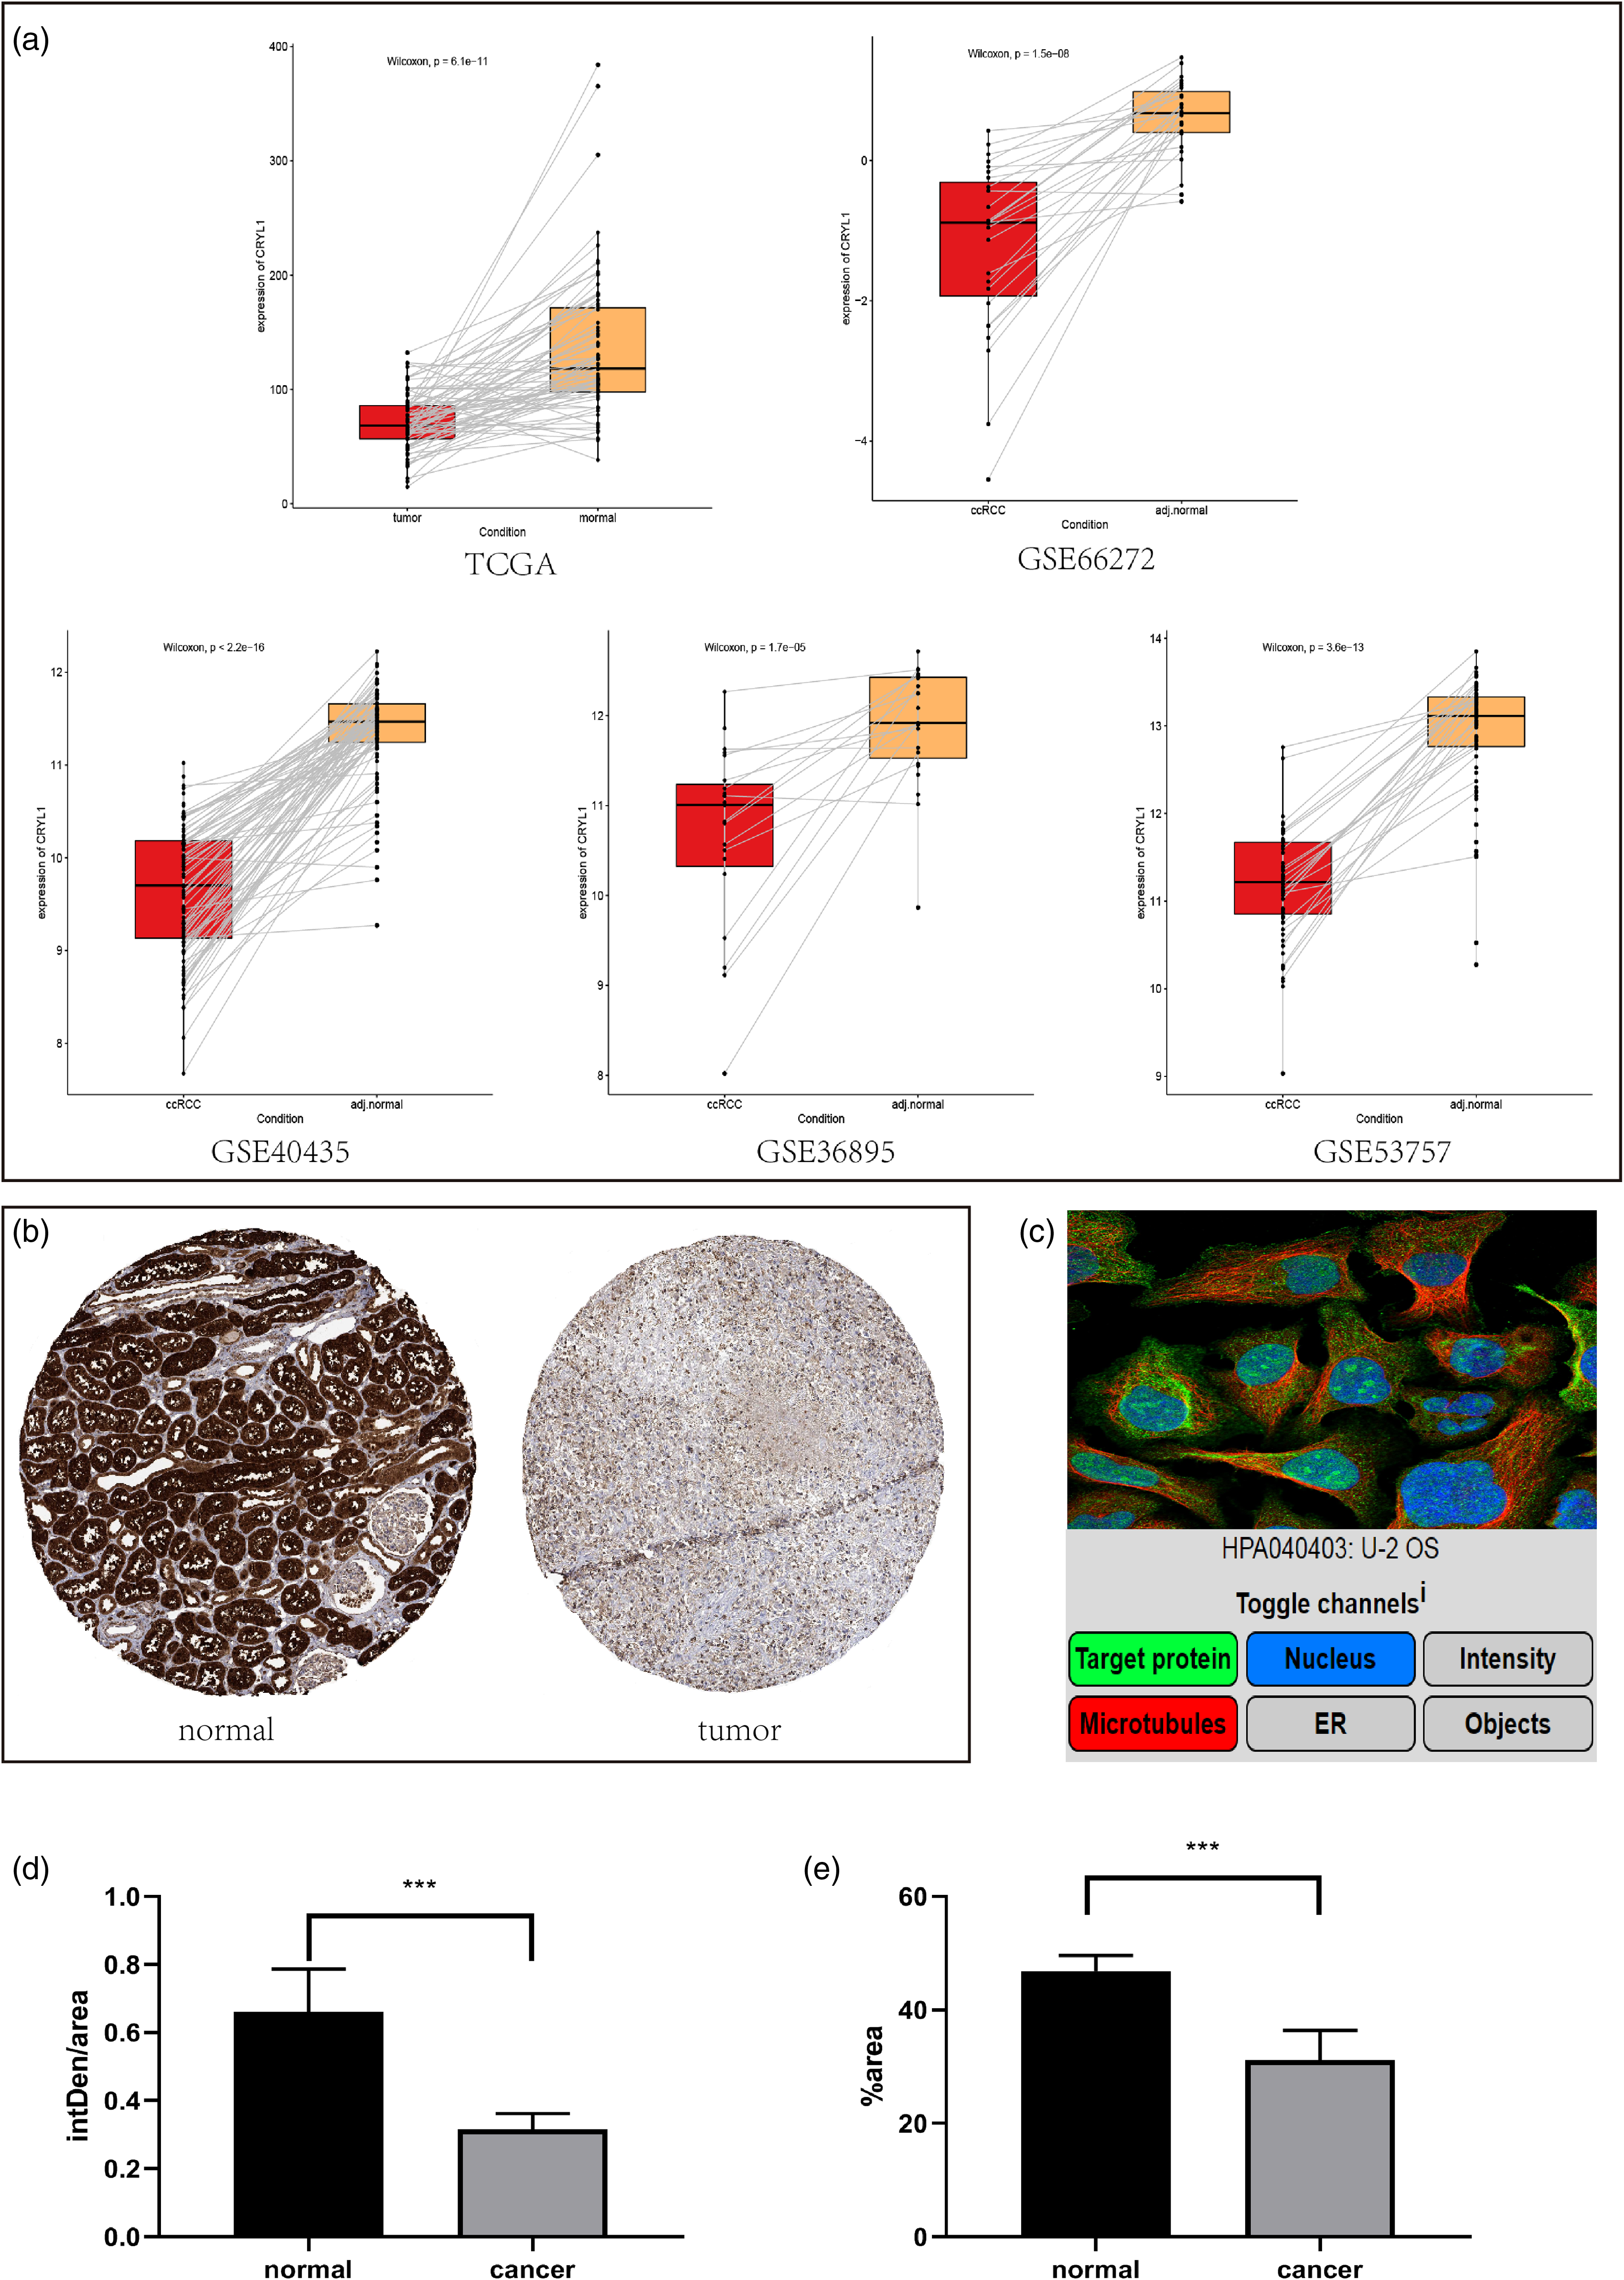
Validation of CRYL1 expression and protein expression based on data from the HPA database. (a) Boxplot displaying the changes in CRYL1 expression in paired samples from the TCGA, GSE66272, GSE40435, GSE36895, and GSE53757 datasets. (b) Typical IHC images of normal tissue and tumor tissue. (c) The subcellular location of CRYL1. CRYL1 was localized mainly to the nucleoplasm, nucleoli, and plasma membrane. (d-e) Quantitative statistics of the IHC images. The intDen/area (d) and %area (e) in the normal group exceeded those in the tumor group. TCGA: The Cancer Genome Atlas; IHC: immunohistochemistry.
Survival Analysis of CRYL1 and Correlation with Clinical Characteristics
Comparisons of OS and DFS between patients in different CRYL1 expression groups were performed using K‒M plotter downloaded from GEPIA. The K‒M curve indicated favorable DFS (Figure 6a) and OS (Figure 6b) in the high-expression group. Box diagrams visualizing the expression of CRYL1 in different tissues (Figure 6c), subtypes (Figure 6d), clinical pathological grades (Figure 6e), stages (Figure 6f), and numbers of metastatic lymph nodes are shown (Figure 6g). In general, patients in the positive prognostic group had higher CRYL1 expression.

Survival and clinicopathological characteristic analysis of patients stratified according to CRYL1 expression. (a,b) Survival analyses were performed using GEPIA. (c-g) Clinicopathological characteristic analyses were conducted through UALCAN.
Immune Infiltration Analysis
Stacked bar plots were generated to display the percentages of 22 immune cell types in both the “ level” group (Figure 7a) and the “low expression level” group (Figure 7b). Generally, macrophages and T cells make up most of the immune cell population. There were marked differences in the infiltration levels of various immune cells, such as memory B cells, follicular helper T cells, plasma cells, activated memory CD4+ T cells, monocytes, regulatory T cells (Tregs), macrophages(M0, M1, M2), activated mast cells, and resting dendritic cells, between the two groups (Figure 7c). Furthermore, decreased infiltration of follicular helper T cells, Tregs, M0 macrophages, or activated memory CD4+ T cells predicted a prolonged OS (Figure 7e-h).

Immune infiltration analysis. (a,b) Stacked bar plots showing the infiltration abundance of 22 kinds of immune cells in diverse CRYL1 expression groups. (c)Violin plot illustrating the distribution of immune cells in the diverse CRYL1 expression groups. (d) Hierarchical cluster heatmap displaying immune infiltration between diverse CRYL1 expression groups. (e-h) Increased infiltration of four kinds of immune cells was associated with improved OS in ccRCC patients: Tregs ((e), HR = 1.26, P = 0.00142), activated memory CD4+ T cells ((f), HR = 1.39, P = 0.00786), follicular helper T cells ((g), HR = 1.4, P = 4.55e-6), and M0 macrophages ((h), HR = 1.17, P = 0.0457). ccRCC: clear cell renal cell carcinoma; HR: hazard ratio; OS: overall survival.
Gene Set Enrichment Analyses and GO Analysis
According to the GO analysis, the DEGs were primarily associated with 20 BPs, 15 CCs, and 20 MFs (Figure 8a). The top three BP terms were external encapsulating structure organization, extracellular matrix organization, and extracellular structure organization. The top three MF terms were extracellular matrix structural constituent, serine-type endopeptidase inhibitor activity, and peptidase inhibitor activity. Volcano plots were constructed for the DEGs among the different CRYL1 expression groups (Figure 8b), and 511 downregulated genes and 557 upregulated genes were found. GSEA demonstrated that DEGs were predominantly linked to the metabolic pathways of sugars, fats, and amino acids (Figure 8c), with enrichment of glycolysis/gluconeogenesis (NE = 2.28, normal-P < 0.001, FDR < 0.001); pyruvate metabolism (NE = 1.97, normal-P < 0.001, FDR < 0.001); fatty acid metabolism (NE = 2.69, normal-P < 0.001, FDR < 0.001); peroxisome (NE = 2.15, normal-p < 0.001, FDR < 0.001); valine, leucine and isoleucine degradation (NE = 2.12, normal-P < 0.001, FDR < 0.001); tryptoph’an metabolism (NE = 2.51, normal-P < 0.001, FDR < 0.001); and arginine and proline metabolism (NE = 1.65, normal-P < 0.001, FDR < 0.001).

Enrichment analysis. (a,b) GO analysis (a) and identification of DEGs (b) in the high- and low-CRYL1 expression groups. (c) The DEGs between the high-CRYL1 expression groups and low-CRYL1 expression groups were enriched in 10 gene sets related to sugar, fatty acid, and amino acid metabolism. DEG: differentially expressed gene.
Association Between Hub Genes and Genes Related to Cuproptosis
Ten cuproptosis-related genes were extracted from a previous article. CRYL1 was positively correlated with PDHB, PDHA1, LIPT1, LISA, GLS, FDX1, MTF1, DLAT, and DLD and a negatively correlated with CDKN2A (Figure 9a). A bee swarm diagram showed that FDX1, DLD, DLAT, LIAS, GLS, LIPT1, MTF1, and DHA1 were positively correlated with CRYL1, while CDKN2A was negatively correlated with CRYL1, and PDHB expression was not significantly related to CRYL1 expression. (Figure 9b).

Correlation analysis between CRYL1 and 10 cuproptosis-related genes. (a) CDKN2A was expressed at lower levels, and FDX1, DLD, DLAT, LIAS, GLS, LIPT1, MTF1, and DHA1 were expressed at higher levels in the “ group of CRYL1.” PDHB expression did not differ among the diverse CRYL1 expression groups. (b) CRYL1 was positively correlated with PDHB, PDHA1, LIPT1, LISA, GLS, FDX1, MTF1, DLAT, and DLD and negatively correlated with CDKN2A.
Silencing Efficiency of CRYL1
siRNA-mediated knockdown of CRYL1 resulted in a discernible reduction in the protein level in both the caki1 and OSRC21 cell lines. Notably, siRNA-306 and siRNA-209 effectively suppressed CRYL1 (Figure 10a-f). Quantitative analysis confirmed the significant decrease in CRYL1 mRNA levels following siRNA-209- and siRNA-306- mediated knockdown, confirming successful gene silencing (Figure 10g-h). Therefore, validation experiments were performed with siRNA-209 and siRNA-306.

Wb and RT‒qPCR validation. (a-f) Efficiency analysis of three siRNAs targeting CRYL1 by WB. (g-H) RT‒qPCR analysis of the efficiency of three siRNAs targeting CRYL1. WB: western blotting.
Wound Healing Cell Clone Experiments and Transwell Assays
After 48 h, the OSRC2 (Figure 11a) and caki1 (Figure 11b) cell lines in the siRNA-209 and siRNA-309 groups demonstrated significantly improved healing compared to that in the siRNA-NC group in the wound healing assay. Cell colony formation assays suggested that the siRNA-209 and siRNA-306 groups had greater numbers of colonies (Figure 12a-d). In the transwell assay (Figure 12e-h), more cells were able to migrate to the lower chamber.

Wound healing assay for OSRC2 and caki1 cells. (a,b) Migration of OSRC2 (a) and caik1 (b) cells in the siRNA-NC, siRNA-209, and siRNA-306 groups. The latter two groups exhibited a high migration rate. (c-f) Statistical analysis of the data on the migration rate of OSCR2 cells at 24 h (c) and 48 h (d), and of caki1 cells at 24 h (e) and 48 h (f).

Cell colony and transwell assays. (a-d) Cell colonies of caki1 (a) and OSRC2 (c) cells in the siRNA-NC, siRNA-209, and siRNA-306 groups. Statistical analysis of the clones for Caki1 (b) and OSRC2 (d) cells. (e-h) Migration of caki1 (e) and OSRC2 (g) cells in the siRNA-NC, siRNA-209, and siRNA-306 groups. (g-h) Quantification of cells that migrated into caki1 (f) or OSRC2 (h) cells.
Flow Cytometry Analysis and IHC Analysis
Flow cytometry analysis (Figure 13a) suggested that the siRNA-209 and siRNA-306 groups had a fewer apoptotic cells than the siRNA-NC group. HE staining revealed disrupted cellular structures in ccRCC without normal renal tubular morphology (Figure 13b), and IHC analysis (Figure 13b-c) revealed that CRYL1 is highly expressed in ccRCC.

Cell apoptosis and IHC analysis. (a) Apoptosis of Caki1 and OSRC2 cells in the siRNA-NC, siRNA-209, and siRNA-306 groups. (b) HE and IHC analysis of ccRCC and adjacent tissue. (c) Expression of CRYL1 in cancer and adjacent tissues. IntDen: integrated density. ccRCC: clear cell renal cell carcinoma; IHC: immunohistochemistry.
Discussion
With the advancement and widespread adoption of sequencing technologies, high-throughput data have undergone exponential growth. Concurrently, in the era of precision oncology, the identification of novel molecular features influencing disease progression and predicting renal cancer prognosis has been emphasized. 23 Consequently, excellent bioinformatics studies based on high-throughput data have been continuously emerging in recent years. For instance, Junjie Tian conducted an analysis of transcriptome data, identified a novel renal cancer marker, POLD1, and experimentally validated its oncogenic biological behaviors. Additionally, POLD1 might contribute to the tumor immune-suppressive microenvironment and diminish the sensitivity of tumors to ferroptosis, providing a novel understanding of the mechanisms underlying renal cancer development. 24 Similarly, Kunpeng Luo established a metabolic reprogramming assessment model using various machine learning algorithms, demonstrating its superior efficacy compared to traditional prognostic indicators. Moreover, based on these findings, a potential targeted drug was identified, offering new perspectives for the future treatment and prognosis prediction of renal cancer. 25 In conclusion, high-throughput data provide vast medical information, and the comprehensive exploration of existing data represents an economical and effective scientific research approach in medicine.
In this study, leveraging renal cancer data from TCGA and GEO databases, coupled with various computational methods including WGCNA and LASSO, CRYL1 was identified as a potential independent prognostic marker for ccRCC. Currently, there is limited understanding of the role of CRYL1 in ccRCC, and identifying of CRYL1 may lead to new insights into the occurrence and progression of ccRCC. Furthermore, through wound healing assays, transwell assays, cell clone experiments, and flow cytometry analysis, it was clearly demonstrated that the downregulation of CRYL1 could enhance the proliferation and migration capabilities of tumor cells while reducing the percentage of apoptotic cells. IHC was used to validate the low expression of CRYL1 in renal cancer.
Metabolic reprogramming is highly prevalent in tumors and involves altering the balance of energy intake, energy synthesis, and metabolic mechanisms to promote tumor growth or progression. This mechanism often involves changes in processes such as glucose metabolism, fatty acid metabolism, lipid metabolism, and energy redox processes. 26 Recent studies indicate that renal cancer may be a metabolic disease that leads to alterations in the metabolism of glucose, lipids, and amino acid, and potentially influences various metabolic pathways, such as HIF-2α inhibitors and indoleamine 2,3-dioxygenase (IDO) inhibitors. 27 In-depth research into the mechanisms of metabolic reprogramming in renal cancer and associated genes may unveil new biomarkers, tumor detection methods, therapeutic targets, and possibilities for new drug development. In the present study, the GSEA results indicated that DEGs related to CRYL1 were significantly related to fatty acid metabolism, glycolysis, peroxisomes, gluconeogenesis, pyruvate metabolism, and metabolic processes involving multiple amino acids. According to the GSEA results, the DEGs were enriched in the metabolism of sugar, fat and several kinds of amino acids. On the other hand, copper-dependent death (cuproptosis) represents a novel cell death mode that targets the TCA cycle. 22 Cuproptosis-related genes can be potential prognostic biomarkers and can offer fresh insights into ccRCC treatment. 28 Cuproptosis is caused by copper attaching to lipoylated elements in the TCA cycle, leading to the clumping of lipoylated proteins and the loss of iron-sulfur cluster proteins. This ultimately results in proteotoxic stress and cell death. Cuproptosis involved 10 related genes (seven positive regulatory genes and three negative regulatory genes) and two pathways (the LIAS pathway and the PDH complex). The LIAS pathway comprises four positively regulated genes (FDX1, LIAS, LIPT1, and DLD), and the PDH complex comprises three positively regulated genes (DLAT, PDHA1, and PDHB) and three negatively regulated genes (MTF1, GLS, and CDKN2A). 22 In our study, we found that CRYL1 is positively correlated with FDX1 and the LIAS pathway, which are important molecules involved in cuproptosis. These findings can guide us toward potential directions for subsequent experimental validation of CRYL1. However, it is crucial to note that this correlation merely signifies an association and does not imply a causal relationship. A large amount of research is still needed for verification.
Tumor immune infiltration and immunotherapy are new directions for tumor occurrence, development and treatment. Immune checkpoint inhibitors have been applied for treating advanced ccRCC as primary or secondary therapies, and encouraging outcomes have been achieved.29,30 In the present study, CRYL1 exhibited a relationship with immune cell infiltration in ccRCC. CD8+ T cells, M1 macrophages, M2 macrophages, and resting memory CD4+ T cells were the top four immune cell types according to infiltration abundance in both groups and exhibited distinct CRYL1 expression levels. This outcome mirrors the findings of a prior study in which T cells and myeloid cells were found to be the predominant immune cells in RCC. 31 The infiltration levels of 11 immune cells differed between the two CRYL1 expression groups. Four of the 11 immune cell types (Tregs, follicular helper T cells, M0 macrophages and activated memory CD4+ T cells) are associated with improved OS. In general, these results also provide a direction for further investigation into the molecular mechanisms through which CRYL1 influences renal cancer prognosis by altering the immune microenvironment.
In addition, there is an intricate relationship between metabolic reprogramming and the immune microenvironment. 32 Recent studies have revealed that TP53-mediated metabolic alterations are associated with the tumor microenvironment regulation and tumor progression. 25 This research classified liver cancer into two subtypes based on the TP53 mutation status, and these metabolic subtypes exhibited distinct immune-inflammatory microenvironments. 25 In the present study, the correlations between CRYL1 and metabolism and immune response were identified. The subsequent direction of research involves joint analysis and experimental validation of the involvement of CRYL1 in the immune response and metabolic reprogramming. This may contribute to a deeper understanding of the roles of metabolic reprogramming and the immune microenvironment in cancer.
This present study has several limitations, such as the need for extensive experimental research to elucidate the relationships between CRYL1 and immune response and between CRYL1 and cuproptosis. However, further experimental validation is needed to investigate the expression of CRYL1 in clinical samples and its correlation with clinical pathological features and prognosis.
Conclusion
The antioncogene CRYL1 was identified in ccRCC through multidimensional analysis. It has a robust ability to predict clinicopathological characteristics and survival status. The potential underlying mechanisms could involve altering immune cell infiltration or relying on cuproptosis.
Footnotes
Acknowledgments
Not applicable.
Author Contributions
PENG LI designed the study; JUNJIE YE performed the analysis procedures; QIANGQIANG XU contributed to the writing of the manuscript; KEN LIU conducted the cell assay and IHC. All authors reviewed the manuscript.
Availability of Data and Material
Competing Interests
The authors declare no conflict of interest.
Declaration of Conflicting Interests
The authors declared no potential conflicts of interest with respect to the research, authorship, and/or publication of this article.
Ethics Approval and Consent to Participate
This study has been approved by the Ethics Committee of Lishui People's Hospital(LLW-FO-403).
Funding
The authors disclosed receipt of the following financial support for the research, authorship, and/or publication of this article: This research was supported by the Lishui Welfare Technology Application Research Project (No. 2023GYX60/No. 2020GYX22), Zhejiang Medical Association Clinical Research Fund Project (No. 2022ZYC-A107).