
Abstract
Introduction
This study aimed first to quantify the impact of varying concentrations of iodine contrast agents on electron density (ED) values of ED maps through phantom experiments and evaluate the differences in dose calculations; Second, to validate that utilizing ED maps for photon dose calculation can minimize the uncertainties introduced by the iodine contrast agents by using actual patients’ data.
Methods
A phantom with iodine inserts of varying concentrations was scanned using a spectral CT to acquire post-contrast and non-contrast CT images and the corresponding ED maps. The data of 22 patients with pelvic tumors were selected retrospectively for clinical validation. Treatment plans were transplanted to non-contrast and post-contrast ED maps, and the dose distributions were then recalculated. The differences in dose-volume histogram (DVH) parameters between the plans based on non-contrast and post-contrast ED maps were compared. Besides, gamma analysis was performed to evaluate the discrepancies in dose distributions between these two plans.
Results
For the phantom experiment, under clinical organ perfusion concentrations (≤5.0 mg/ml), the maximum increase in HU values reached 145.76, whereas the ED values showed only a 1.54% increase. Compared to the non-contrast images, the maximum dose difference of the post-contrast CT image was 2.3%, while the post-contrast ED map was only 0.2%. For comparison of treatment plans based on patients’ non-contrast and post-contrast ED maps, only the bladder's D50% showed a statistically significant difference, but the difference in value remained clinically negligible. The remaining showed no statistically significant differences.
Conclusion
The influence of iodine contrast agents on the ED values is minimal. Dose calculations based on ED maps can significantly reduce the errors introduced by contrast agents. This approach would allow us to depend solely on a single post-contrast scan for radiotherapy simulation, thereby minimizing imaging radiation exposure and improving simulation efficiency.
Introduction
Iodine contrast agents have been widely used in CT radiotherapy simulation for decades since intravascular iodine can improve soft tissue visualization, helping identify anatomical structures more clearly.1–3 This assists in contouring target volumes and surrounding organs at risk (OARs). However, the introduction of contrast agents in CT images can lead to inaccuracy in subsequent dose calculation, as the contrast is present in the planning CT images but not for the patients in subsequent fractionated treatment. Iodine's high element number (Z = 53) can result in different photoelectric absorption interactions and increase Hounsfield unit (HU) values in CT images.
In most treatment planning systems (TPS), absorbed dose calculations rely on the conversion of HU values from CT images to electron density (ED) for photon therapy or proton stopping-power ratio (SPR) for proton therapy, by developing HU-ED or HU-SPR calibration curves. However, if contrast agents are left unaddressed, the increased HU values can introduce inaccuracies in dose calculations.4,5 This occurs because the presence of contrast agents disrupts the accurate mapping of HU-ED and HU-SPR calibration curves, potentially compromising the precision of both photon and proton therapy planning.
Several studies have examined the effects of contrast agent administration on dose calculation accuracy. It has been reported that the presence of contrast agents leads to 1%–2% uncertainty in photon dose calculations.6–8 And for proton therapy, the use of contrast agents has been shown to introduce range errors of up to 10 mm in proton beam delivery. 9 To minimize the error caused by this, two simulation CT scans are performed in standard clinical practice, one with contrast administration and one without it. So, post-contrast CT images can be used for structures delineation, whereas non-contrast CT images can be used for treatment planning.
However, this increases the patient's imaging dose and introduces position uncertainty from patient motion between two scans. Therefore, this additional scan is sometimes omitted when dose effects are anticipated to be limited, or the local HU values in regions with high iodine uptake are manually replaced with values of the surrounding tissue.
The Philips Spectral CT 7500 scanner (Philips Healthcare, Best, The Netherlands) can simultaneously acquire energy-sensitive data via its novel dual-layer detectors without special acquisition protocols. The top layer detector, constructed from yttrium-based material, absorbs lower energy photons from the x-ray beam, whereas the bottom layer detector, fabricated from gadolinium oxysulfide (GOS), detects higher energy photons. This enables the calculation of high- and low-energy attenuation coefficients.10,11 Hence, the spectral CT systems can produce a series of quantitative datasets, enabling the reconstruction of various quantitative images such as ED maps.12,13
Using ED maps for dose calculation would eliminate the need for HU-ED calibration in photon treatment planning. Additionally, this approach has the advantage that, unlike HU values, ED values are marginally affected by iodine concentration. Even at an extremely high iodine concentration of 20 mg/ml in the clinical setting, the resulting variation in ED value is only approximately 5%, while organ perfusion generally does not surpass 2–5 mg/ml.14,15 Therefore, using ED maps synthesized from spectral CT for treatment planning can eliminate the uncertainties and potential systematic errors introduced by contrast agents in conventional CT. Atez et al 16 explored whether using ED maps could mitigate the dose calculation inaccuracies induced by iodine contrast agents in abdominal tumors, as opposed to relying on traditional CT images obtained from non-contrast scans. Their findings revealed that dose distributions based on post-contrast ED maps closely resemble those calculated from non-contrast ED maps.
However, the feasibility of utilizing ED maps for dose calculations in the presence of contrast agents as an alternative to non-contrast CT images remains insufficiently explored at the current stage. This study aimed first to quantify the impact of varying concentrations of iodine contrast agents on ED values of ED maps through phantom experiments and to evaluate the differences in dose calculations compared to non-contrast CT images; Second, to validate that using ED maps for photon dose calculation can minimize the uncertainties introduced by the presence of iodine contrast agents with actual pelvic patients data.
Materials and Methods
Phantom Configuration
The MECT phantom model 1472 (Sun Nuclear Corporation, Melbourne, FL, USA) with various iodine inserts was used to perform the phantom experiment. To control the related variables, the solid water and high equivalency (HE) iodine inserts (0.2, 0.5, 1.0, 2.0, 5.0, 10.0, 15.0, and 20.0 mg/ml iodine) were always placed in the middle of the phantom and replaced with a different concentration in each scan. The solid water insert was used to simulate non-contrast state. Detailed reference information and arrangements for the inserts are shown in Table 1 and Figure 1. Therefore, in the phantom experiment, a total of 8 post-contrast CT images with different iodine concentrations and their corresponding post-contrast ED maps were acquired and reconstructed, along with 1 non-contrast CT image and its corresponding non-contrast ED map. These data were used to systematically analyze the impact of iodine contrast agent concentration on CT images and ED maps, as well as to evaluate the differences in dose calculations using CT images and ED maps in the presence of varying concentrations of iodine compared to the scenario without iodine.
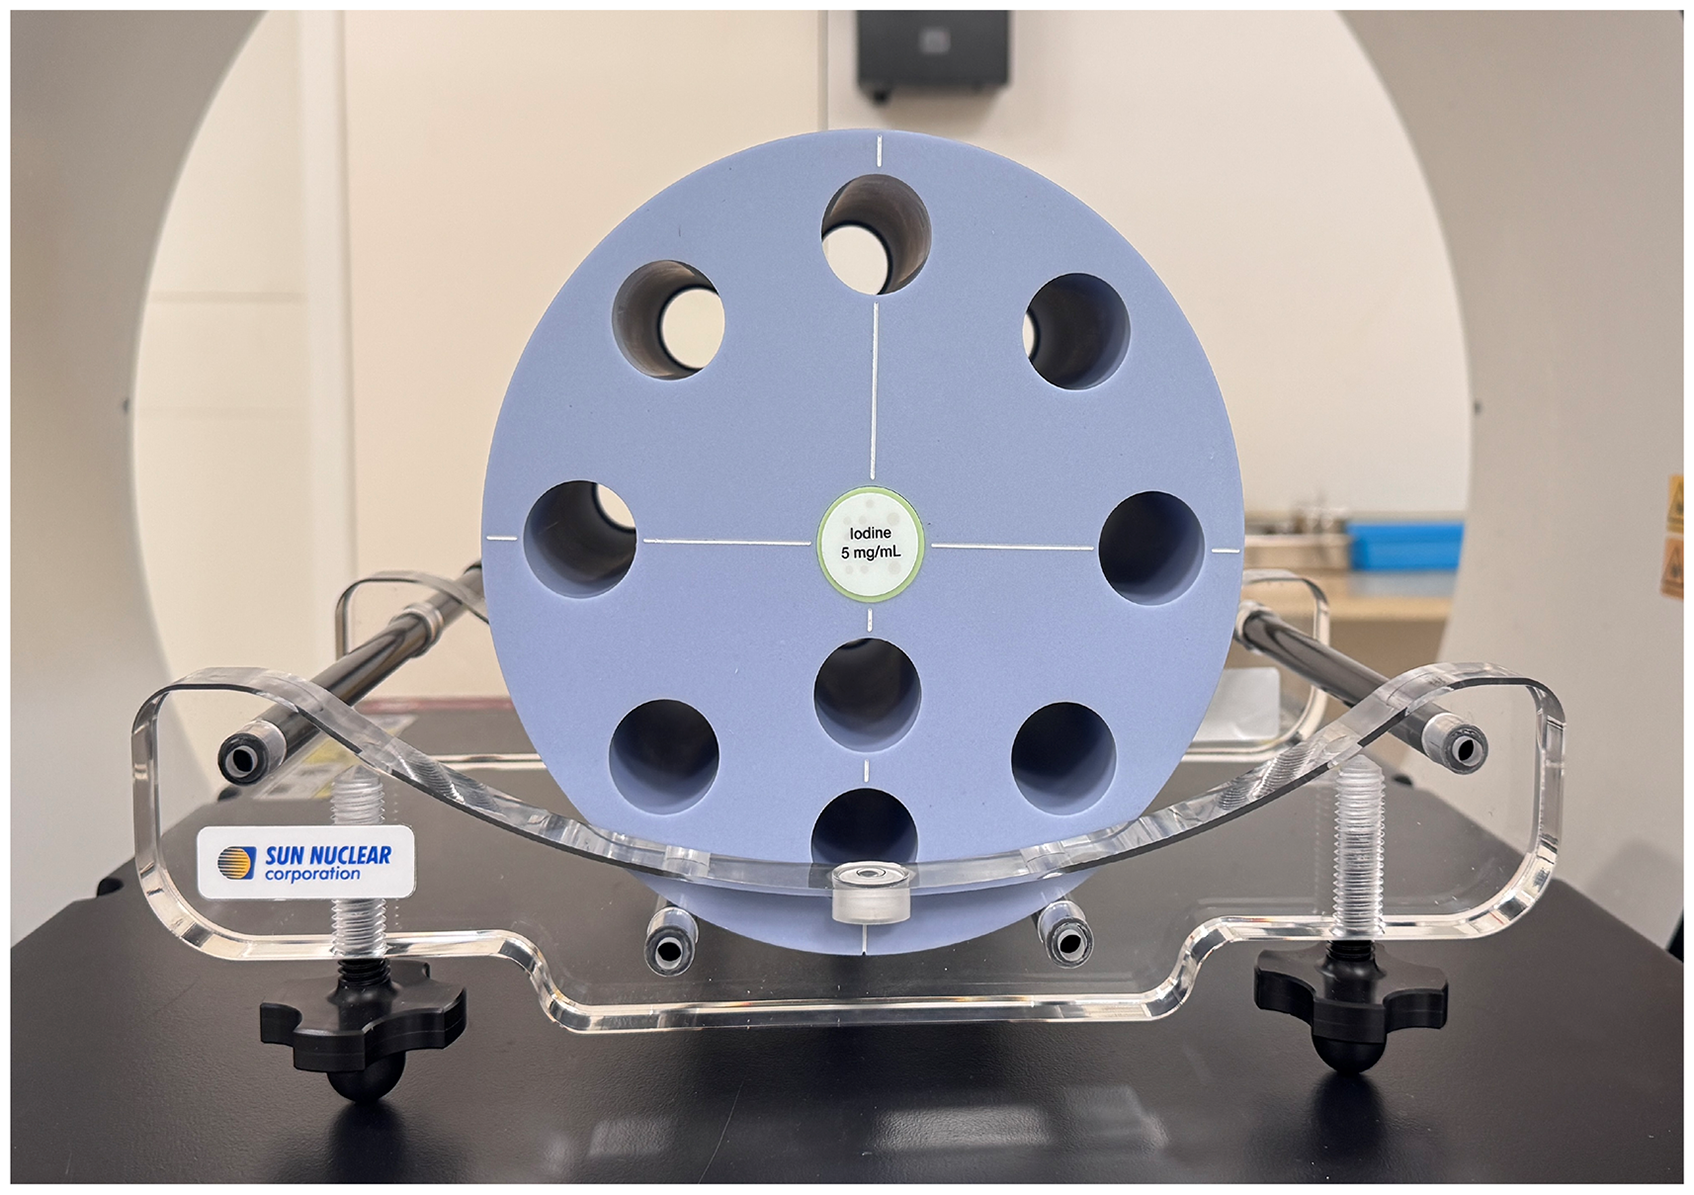
Configuration of MECT Phantom Model 1472.
Detailed Reference Information on HE Iodine and Solid Water Inserts of MECT Phantom Model 1472.

Scanning and Measurement
The phantom was scanned using a clinical pelvic scanning protocol, and the corresponding ED maps were reconstructed. The scan parameters were 120 kVp, 300 mAs, 23.2 mGy CTDIvol, 1 pitch, 128 × 0.625 mm collimation, 500 mm FOV, and 5 mm slice thickness. To ensure accurate imaging results, air calibration was performed on the CT scanner prior to scanning. To assess the influence of the iodine contrast agent on HU values and ED values, a circular region of interest (ROI) was defined in the iodine insert, with a diameter equal to 75% of the insert diameter, and HU values and ED values were measured for 10 consecutive slices based on it. It should be noted that the scanner's representation of ED value was the relative ED value, which was defined as the ED value of a substance relative to that of water (EDwater = 3.343 × 10²³m−3) and expressed as a percentage.
To compare the differences in dose calculation, a spherical ROI of the same diameter was defined at the iodine insert center, aligned with the phantom's surface lead markers.
Based on each acquired CT image and ED map, a 10 cm × 10 cm field was set for photon dose calculation in Eclipse TPS version 15.6 (Varian Medical System, Palo Alto, CA, USA), using 6 MV beam with the isocenter placed at the geometric center of the spherical ROI. The beam was planned to deliver 100 monitor units.
Patient Selection and Image Acquisition
In addition to the phantom experiment, we also conducted clinical evaluations based on actual patient data. In this study, 22 female patients (aged 35-72 years) with pelvic tumors were randomly selected for retrospective analysis. The techniques used in the treatment plans include fixed-field intensity modulated radiation therapy (FF-IMRT) and volumetric modulated arc therapy (VMAT). All patients underwent two simulation scans using Philips Spectral CT 7500 according to clinical standards: one before and one after the administration of the iodine contrast agent. The contrast agent was injected at 450 mgI/kg, and the flow rate was 1.9 ml/s. Scanning was performed with a delay of 55–60 s after the administration to ensure optimal contrast enhancement for imaging. The non-contrast and post-contrast ED maps were reconstructed based on the spectral base image (SBI) datasets acquired from these two scans.
Treatment Planning and Dose Recalculation
For these patients, the prescribed dose of external beam planning was 4500 cGy with 25 fractions. All selected treatment plans were meticulously designed and optimized using the Eclipse TPS version 15.6 and delivered by the Halcyon 2.0 and Truebeam linear accelerators. Dose calculation and planning optimization were performed using the Anisotropic Analytical Algorithm (AAA) and the Photon Optimizer (PO), respectively.
To achieve more accurate dose recalculation and reasonable dose comparison, we deformably registered the non-contrast ED maps and post-contrast ED maps with the RT-Mind WS V0.5.1 (MedMind Technology Co., Ltd, Beijing, China) software. Additionally, it should be noted that there is no need to register the non-contrast ED maps and CT images, as they were inherently homologous and acquired simultaneously.
We transplanted the original treatment plans based on conventional CT images to the non-contrast and post-contrast ED maps with the same plan parameters and recalculated the dose distribution. The transplanted plans based on non-contrast and post-contrast ED maps were referred to as ED plans and post-contrast ED (PED) plans, respectively.
Comparing Dosimetry Between non- and post-Contrast Treatment Plans
Additionally, these three types of treatment plans’ RT dose files were exported in DICOM format, and we utilized MEPHYSTO Navigator software (PTW, Freiburg, Germany) to perform 3D gamma analysis for comparing the differences in dose distribution between the three types of plans. The gamma analysis was conducted in absolute dose mode, with the criteria set at 1%/1 mm, 2%/2 mm, and 3%/2 mm according to the recommendation of the AAPM TG218 report for VMAT and FF-IMRT. 17 A threshold of 10% of the maximum dose was applied, meaning only dose points exceeding 10% of the maximum dose value were included in the calculation. All DVH parameters were analyzed by the SPSS software V29.0 using paired T-test analysis, and P < .05 was regarded as statistically significant.
Results
The Variations of HU and ED Values Based on the Phantom Measurements
Table 2 illustrates the effects of iodine at varying concentrations on HU and ED values. As the concentration of the iodine increased, its impact on HU values became more significant, while its influence on ED values remained minimal. At the maximum iodine concentration (20 mg/ml), the difference in HU values between the solid water insert and the iodine insert exceeded 500, whereas the difference in ED values was only 4.74%.
Differences (Mean ± std) in HU and ED Values Between Different Iodine Inserts and the Solid Water Insert.

Dosimetric Comparison of the Phantom Experiment
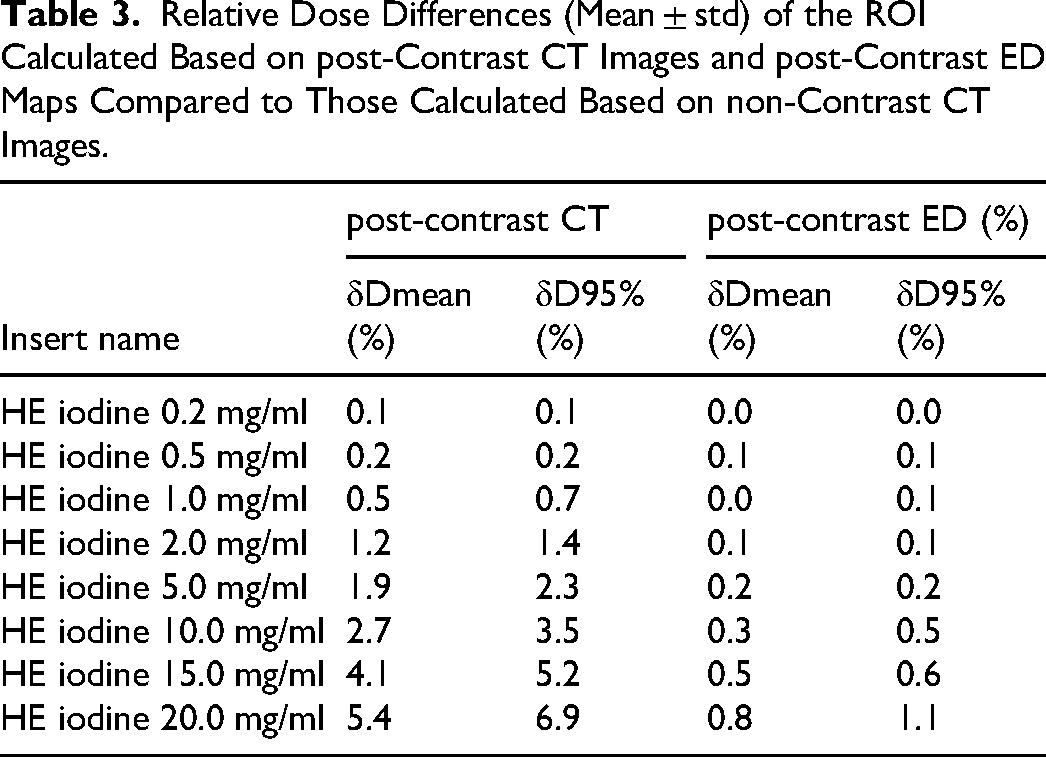
Dose calculations were performed for the ROIs based on each acquired CT image and ED map to investigate the impact of varying concentrations of iodine contrast agents on dose calculation accuracy in these two imaging modalities. Figure 2 shows the dose distribution example of the phantom experiment. Table 3 summarizes the relative dose difference of ROI calculated based on post-contrast CT images and ED maps compared to that calculated based on non-contrast CT images. The maximum relative difference of dose calculation based on post-contrast CT image was as high as 6.9%, while the maximum relative difference for post-contrast ED map was only 1.1%. For clinical organ perfusion concentrations, the relative difference of dose calculation based on post-contrast ED was ≤ 0.2%. Figure 3 presents DVHs comparisons of the ROI based on non-contrast CT images, post-contrast CT images and ED maps under several typical iodine concentrations.

Dose Distribution and ROI Example for the Phantom with an Iodine Inert (HE Iodine 5.0 mg/ml).

Comparison of DVHs for ROIs Calculated Using Non-Contrast, Post-Contrast CT Images and Post-Contrast ED Maps of the Phantom (A) HE Iodine 0.5 mg/ml Insert, (B) HE Iodine 2.0 mg/ml insert, (C) HE Iodine 5.0 mg/ml Insert, (D) HE Iodine 20.0 mg/ml Insert.
Relative Dose Differences (Mean ± std) of the ROI Calculated Based on post-Contrast CT Images and post-Contrast ED Maps Compared to Those Calculated Based on non-Contrast CT Images.
Dosimetry Comparison of PTV and OARs
The DVH parameters of PTV and OARs between PED plans and ED plans are listed in Table 4, and the absolute dose differences are visualized as boxplots in Figure 4. In general, the bladder's D50% showed a statistically significant difference between these two plans, but the difference in value remained minor. The remaining DVH parameters showed no statistically significant differences. Figure 5 shows the dose distributions and DVHs of the ED and PED plans for patient 7. The difference between the ED and PED plans was observed to be minimal.

Boxplots of the Absolute Dose Differences for the PED Plans Compared to the ED Plans. Abbreviations: PED, post-contrast electron density; ED, electron density; PTV, planning target volume; SI, small intestine; SC, spinal cord; FHL, femoral head left; FHR, femoral head right; BM, bone marrow.

Comparison Between the PED and ED Plans for the Example Patient (Patient 7). Typical DVHs from the PED Plans (Square) and the ED Plans (Triangle) are Displayed. Abbreviations: DVHs, Dose-Volume Histograms; PED, post-contrast electron density; ED, electron density.
DVH Parameters Comparison for PTV and OARs Between PED Plans and ED Plans (Mean ± std).

Abbreviations: ES, effect sizes; 95%CI, 95% confidence interval.
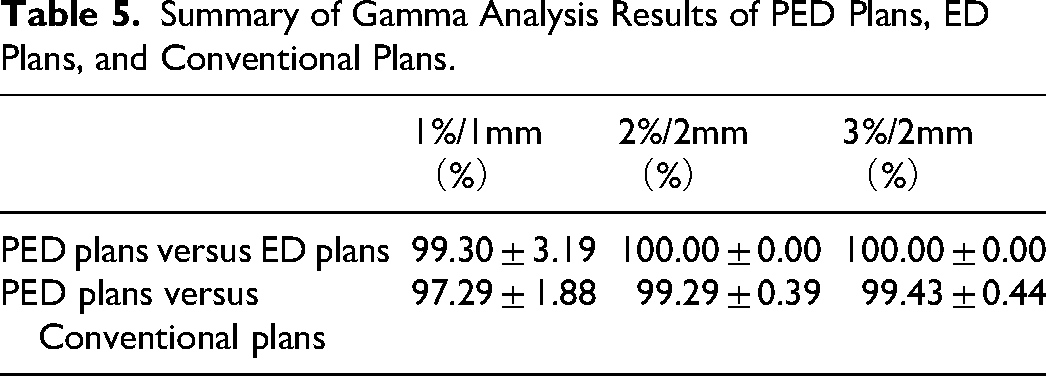
Table 5 summarizes the gamma analysis results between PED plans versus ED plans, and conventional plans. Even under the most stringent criterion of 1%/1 mm, the gamma passing rates for PED plans compared to both still exceeded 95%.
Summary of Gamma Analysis Results of PED Plans, ED Plans, and Conventional Plans.
Discussion
Ensuring the quantitative accuracy of ED values derived from ED maps is the essential first step toward making such a paradigm shift in photon dose calculation. Several studies have reported high validity in ED determination based on spectral CT systems. 15 18–20
The results of the phantom experiment in this study indicated that the effect of iodine contrast agents on electron density (ED) values was limited. Even at an extremely high iodine concentration of 20 mg/ml, the contrast agent induced only a 4.74% variation in ED values, which was consistent with the results previously reported by Hua et al 15 From the results of dose calculation, the DVH parameters based on post-contrast ED maps were closer to those based on non-contrast CT images, with a maximum relative dose difference of merely 1.1%. At clinically relevant organ perfusion concentrations (≤5 mg/ml), the dose difference introduced by the contrast agent is only 0.2% or less. Based on our knowledge and experience, such dosimetric differences are unlikely to have practical effects.17,21
The differences in DVH parameters between PED and ED plans in the pelvic treatment site are minimal. The maximum absolute percentage deviation between the two types of plans was only 0.06%. The results of gamma analysis indicated that even under the 1%/1 mm criterion, the gamma passing rate was still higher than 99.0% for PED and ED plans. These findings provide preliminary evidence for the feasibility of using post-contrast ED maps for treatment planning and dose calculation.
Though some studies have suggested that the presence of iodine contrast agents has little influence on photon dose calculation in some treatment sites and the resulting dose differences were clinically acceptable,22–25 this remains a contentious issue. In clinical practice, a conservative approach involving dual scans is predominantly adopted to avoid potential errors. Previous studies have reported the feasibility of using virtual non-contrast (VNC) images synthesized from spectral CT as a substitute for actual non-contrast CT images in dose calculations. In post-contrast spectral CT scans, the attenuation characteristics of each voxel can be analyzed using two distinct x-ray energy spectra (typically low and high energy). This allows for the quantification of the contrast agent fraction within each voxel. Once the contrast agent content is determined, the remaining information on the image can be used to create the VNC image.26,27
Yamada et al 28 employed phantom experiments based on a dual-source CT scanner to evaluate the feasibility of using VNC images to improve dose calculation accuracy in radiotherapy. Results showed that dose distributions based on VNC images closely matched those from actual non-contrast images, with gamma passing rates exceeding 90%. Wei et al 29 investigated the performance of VNC images in treatment planning based on clinical patient data. Their results demonstrated that the gamma passing rates for treatment plans based on VNC images and non-contrast CT images were at least 94% under the 1%/1 mm criterion and most DVH parameter differences were less than 1% between the VNC and TNC plans.
However, VNC images are essentially CT images with pixel values in HU and thus require the establishment of specific HU-ED calibration curves for accurate photon dose calculations. The use of ED maps offers a significant advantage by eliminating the HU-ED calibration process from CT simulation, unlike traditional approaches, where dose calculation accuracy relies heavily on strict adherence to calibration settings—often limiting scanning parameters such as tube potential, radiation exposure, and reconstruction filters, etc14,15 This allows radiotherapy workflow to optimize image quality for individual patients without compromising the precision of dose calculations, thereby reducing the potential risks and errors. 14
However, there are still challenges in the broad application of ED maps in radiotherapy, especially in the quality control of the quantitative accuracy of ED images. Although AAPM has published report TG299, 30 it does not specify the unified precision threshold that ED maps need to meet, which remains for further study.
This study has several limitations that should be acknowledged. First, the actual patients’ data were from one center, and the sample size was limited. Second, whether similar results would be observed in other anatomical regions (eg, thoracic or head & neck) remains to be studied, as differences in tissue composition and contrast agent administration protocols. Finally, the evaluation was conducted solely in the context of photon therapy; the method's performance in proton therapy requires further investigation.
Conclusion
In conclusion, we have demonstrated that, within the scope of clinical applications, the influence of iodine contrast agents on the ED values from ED maps is minimal. Dose calculations based on ED maps can significantly reduce the errors introduced by contrast agents. This approach would allow us to depend solely on a single post-contrast scan for radiation therapy simulation and dose calculation, thereby minimizing imaging radiation exposure and improving simulation efficiency.
Footnotes
Abbreviation
Ethics Statement
This study was conducted in accordance with the Declaration of Helsinki (as revised in 2013) and was approved by the institutional ethics board of the Peking Union Medical College Hospital (No. I-25PJ1348).
Consent Statement
All patients provided written informed consent prior to enrollment in the study, authorizing the research use and publication of their clinical data.
Funding
The authors disclosed receipt of the following financial support for the research, authorship, and/or publication of this article: This work was supported by the China National Key R&D Program during the 14th Five-year Plan Period [Grant No.2022YFC2404606], and National High Level Hospital Clinical Research Funding [Grant No.2022-PUMCH-B-116].
Conflict of Interest Statement for all Authors
Authors Mingming Nie and Ning Guo are employed by Philips Clinical Science, Beijing, China. The remaining authors declare that the research was conducted without any commercial or financial relationships that could be construed as a potential conflict of interest.
Data Availability Statement for This Work
The datasets generated during and/or analyzed during the current study are available from the corresponding author on reasonable request.