
Abstract
Simulations of clinical proton radiotherapy treatment plans using general purpose Monte Carlo codes have been proven to be a valuable tool for basic research and clinical studies. They have been used to benchmark dose calculation methods, to study radiobiological effects, and to develop new technologies such as in vivo range verification methods. Advancements in the availability of computational power have made it feasible to perform such simulations on large sets of patient data, resulting in a need for automated and consistent simulations. A framework called MCAUTO was developed for this purpose. Both passive scattering and pencil beam scanning delivery are supported. The code handles the data exchange between the treatment planning system and the Monte Carlo system, which requires not only transfer of plan and imaging information but also translation of institutional procedures, such as output factor definitions. Simulations are performed on a high-performance computing infrastructure. The simulation methods were designed to use the full capabilities of Monte Carlo physics models, while also ensuring consistency in the approximations that are common to both pencil beam and Monte Carlo dose calculations. Although some methods need to be tailored to institutional planning systems and procedures, the described procedures show a general road map that can be easily translated to other systems.
Introduction
Monte Carlo simulations using general purpose toolkits such as Geant4 1 allow detailed tracking of proton interactions with matter in the energy range used for cancer radiotherapy. The increased availability of computational power has made it possible to perform simulations of complete proton therapy treatment plans with high statistical precision. These simulations have been proven to be a valuable tool for research and development. Applications include improved dose calculation, out-of-field dose estimation, modeling of radiobiology, and the study and detection of nuclear interactions in the patient for in vivo beam monitoring.
General purpose simulation codes are considered a “gold standard,” as they aim to provide a complete simulation of all interactions with matter. Therefore, these codes are used for research studies when a complete model of the complex radiation fields is needed. Although not usually considered a direct replacement for clinical algorithms, optimized methods for clinical application are benchmarked against general purpose codes. 2
The Monte Carlo simulation of clinical proton therapy treatment plans is a complex process. 3 –6 An accurate description of the treatment plan, patient anatomy, and beam delivery system is required. Simulations need to consider the transport of protons through the treatment head in the patient-specific configuration, through field-specific hardware such as apertures and range compensators, and the beam delivery to the patient anatomy obtained from computed tomography (CT) images. A unique aspect of proton therapy simulations is the high accuracy that is required for clinically relevant results, mainly the dose delivered and the range of the proton beams. Monte Carlo simulations are based on the fundamental description of individual particle trajectories and interactions. Macroscopic quantities such as the deposited dose follow from the simulation of the interactions of many protons. Clinical calculation methods, on the other hand, normally use an actual ground truth based on experimental data as a reference model. It is needed that the Monte Carlo results closely match a clinical algorithm in such reference conditions to avoid introducing a systematic bias. The uncertainties that exist in the physics models describing the transport and interaction of the protons can however exceed the maximum acceptable difference. 7 Therefore, taking into account this limitation, simulation methods need to be designed such that the uncertainties in the models and parameters are canceled out or compensated by empirical adjustments.
In addition to dose calculation, the simulation of proton–nuclear interactions is receiving increasing interest because of the application to in vivo range verification. The main range verification methods under development use either coincident γ rays from the annihilation of positrons, for which the production of positron emitters in the patient is of relevance, or prompt γ rays emitted directly during the decay of excited nuclear reaction products. The required accuracy for these applications may be well beyond the capabilities of current nuclear reaction models. General Monte Carlo methods can be used with specifically measured and optimized cross sections in such cases.
To routinely use Monte Carlo simulations of clinical proton therapy treatment plans, consistent methods, automation, and integration with the clinical treatment planning system are desired. 8,9 The purpose of this work is to describe the development of a simulation framework to provide fully automatic Monte Carlo simulation of clinical proton therapy treatments using both passive scattering and pencil beam scanning delivery. We systematically consider the relevant models and uncertainties to provide a consistent set of methods that can be applied to studies involving large sets of patient data.
In the second section, we describe the set of Monte Carlo simulation methods that were developed, as well as the various sources of uncertainty in absolute range and dosimetry and how these were dealt with. Then, in the third section, we briefly discuss the implementation of these methods in our clinic. We show 2 examples of clinical applications in the fourth section, in which we used the framework to perform simulations of the delivered dose and the occurrence of specific nuclear reactions in patients with head and neck cancer. Finally, in the fifth section we conclude the article.
Simulation Methods
The Monte Carlo simulation methods were developed to fully automate the simulation of proton treatments designed using clinical treatment planning systems. Simulations to calibrate different models were performed once for the full range of relevant energies and stored for use in the clinical simulations.
Simulation Processes
The Monte Carlo simulation of a clinical treatment plan was divided into several processes. Before describing the methods in detail, in this section, we first provide an overview of all processes involved.
Input data
The simulation starts with a series of processes that generate input data. A schematic overview of these processes is given in Figure 1. First, data were obtained from the clinical treatment planning system. Both the CT scan and the contours of the patient anatomy were transferred. Computed tomography images were then preprocessed to optimize dose calculation accuracy, as is described later. For all beams used in the treatment plan, we transferred the beam geometry such as the isocenter, gantry angle, couch angle, and beam weight.

Processes to obtain the input data for a Monte Carlo simulation.
For passively scattered beams, the associated aperture and range compensator were obtained, and the configuration of the treatment head was determined based on the prescribed range, modulation, and field size. Also, the applicable geometric models of the treatment head were added to the input data.
In the case of a scanned proton beam, we transferred the list of pencil beam spots and the specifications of optional hardware such as a range shifter or aperture. The list of pencil beam spots was combined with the commissioned characteristics of the spot scanning system to determine the physical properties of each spot.
Beam simulations
The simulation input data were transferred to a high-performance computing infrastructure on which the Monte Carlo simulations were performed. Different simulation methods were developed for passively scattered beams and beams delivered using pencil beam scanning, as shown in Figure 2. For a passively scattered proton beam, separate Monte Carlo simulations were performed to determine the phase space at the end of the treatment head and to determine the absolute output factor. In the case of pencil beam scanning, the pencil beam geometry and output were modeled using analytical models, and Monte Carlo simulations were used to model the beam transport through the patient and the patient-specific hardware.

Processes involved in the Monte Carlo simulation on a high-performance computing infrastructure. Also shown are main parts of the input data that are used in each process.
On the computer cluster, the dose delivered to the patient anatomy and other quantities of interest were simulated for all beams, and the results were combined and normalized. The phase space information at the end of the treatment head was also saved to facilitate simulations in which multiple patient dose calculations are performed, for example, based on different CT images. Finally, we converted the results of the simulations to the standard DICOM RT format.
Passively Scattered Beams
Passively scattered proton beams are formed from a single pencil beam entering the treatment head, which is broadened, modulated, and shaped by a number of devices to create a spread-out Bragg peak (SOBP). The treatment heads at the Francis H. Burr Proton Therapy Center, as shown in Figure 3, feature a double scattering system, with the most important components being the range modulator, first and second scatterer, snout, and the patient-specific aperture and range compensator. Although the initial pencil beam is well defined and its properties can easily be parametrized, the phase space of particles entering the patient depends in many complex ways on the configuration of the treatment head. For this reason, the entire treatment head was included in the Monte Carlo simulation.

Model of the universal treatment head at the Francis H. Burr Proton Therapy Center, which can be configured for passively scattered delivery and pencil beam scanning.
Treatment head simulation
The Monte Carlo models of the treatment heads were initially developed by Paganetti et al 3 and have recently been redesigned to match with even higher accuracy the manufacturer’s blueprints. All components were modeled based on blueprints provided by Ion Beam Applications SA (IBA, Louvain-la-Neuve, Belgium). The time dependencies of the dynamic range modulation wheel were incorporated, as well as clinical parameters such as the beam current modulation. 10 For the materials in the treatment head, we used the recommended values for the mean excitation energies from the International Commission on Radiation Units and Measurements (ICRU) 11 in the determination of the proton stopping powers.
To reduce the computational cost of the treatment head simulation, a variance reduction method was used. A reduced number of protons was simulated at treatment head entrance, and 8-fold particle splits were performed downstream of the second scatterer and upstream of the aperture. This method is described in further detail by Ramos-Méndez et al. 12
Output factor calculation
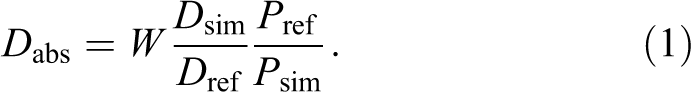
In our clinic, each beam is prescribed a beam weight, which is defined as the dose that would be delivered by the said beam to water in the high-dose region, with the center of the SOBP located exactly at isocenter. The output factor, defined as the relationship between the beam weight and the number of monitor units to be delivered, depends on the configuration of the scatterers in the treatment head. Also, in the case of small fields, such as those used in radiosurgery, the field size needs to be considered because of effects of the aperture edge. The output factor may be determined experimentally for each treatment field, which was the practice at our facility during the first years of operation. Nowadays, the characteristics of the beam line are very well understood, and the output factor is usually derived using an analytic model. 13,14
For the Monte Carlo simulation, one could use these analytic models and simulate the delivered monitor units through simulation of the ionization chambers. 15 However, except for the specific application of validating clinical output factor calculations, it is generally not desired to introduce the approximations of the clinical output factor determination methods only in the Monte Carlo dose calculation method because of the resulting bias when comparing dose calculation methods. Instead, we used a Monte Carlo-based field-specific output factor calibration, similar to the procedure used to determine the output factor experimentally. A separate Monte Carlo simulation was performed, in which the treatment head was configured as for the delivery of the field to the patient. The beam was impinged on a simulated water phantom, which was positioned according to the definition of the beam weight, that is, the center of the SOBP was at isocenter, and the dose averaged over the high-dose region was scored. Combined with the simulated number of protons, this calibration establishes the relationship between the simulated dose in the patient and the absolute dose. Based on the simulated dose D sim, the beam weight W, the SOBP dose in the output factor simulation D ref, the number of protons simulated P sim, and the number of protons simulated for the output factor simulation P ref, the absolute dose D abs is given by:
Proton entrance energy
A clinical proton beam is normally prescribed a range in water. Proton therapy systems can deliver beams to a water phantom with a submillimeter reproducibility of the range. 14 Instead of a secondary parameter such as range, Monte Carlo simulations require the energy and momentum direction of the initial protons to be specified. The simulated range of the beam in water is a result of interactions of the protons with the treatment head, and most importantly, the simulated interactions in water. However, the relationship between proton energy and range in water is not known within the accuracy that we aim to achieve for our simulations. Tables such as Janni 16 and ICRU 11 can differ by >1% for clinical proton energies. These tables have been calculated using the Bethe–Bloch equation, and the differences are a result of the uncertainty in parameters used in this equation, such as the mean excitation energy of water. These uncertainties need to be considered to ensure the Monte Carlo simulations reproduce the experimentally determined range of the beam.
To obtain an exact match of the simulated proton range with the requested range, the proton entrance energy was determined such that the Monte Carlo simulation reproduces the requested range in water R. The mean excitation energy of water was fixed at 75 eV. We obtained the water-equivalent thickness R th> of the combination of scatters, ionization chambers, and the range modulator step used for the longest range. Then, using the proton entrance energy as a function of range in water e w (r), derived through Monte Carlo simulations, the total water equivalent thickness was used to determine the proton entrance energy E = ew (R + R th ).
Energy loss in range compensator
For passively scattered proton therapy, field-specific range compensators made of plastics or wax are used to conform the field to the distal edge of the tumor. Therefore, the simulated energy loss of protons in the range compensator also needs to match the experimentally determined values. The range compensators used at our institute are made of poly(methyl methacrylate) (PMMA) with an experimentally established proton stopping power of 1.15 relative to water. The material to simulate the range compensator was configured to use the mean excitation energy of PMMA from ICRU, 11 and we tuned the mass density to reproduce the desired proton stopping power at 100 MeV.
Pencil Beam Scanning
The simulation of magnetically scanned proton beams is significantly different as compared to passively scattered beams. Practical clinical systems feature a discrete set of deliverable pencil beam energies, the properties of which are characterized experimentally at isocenter. Incorporating the geometry and components of the treatment head in the Monte Carlo simulations is not generally necessary. 17,18,19 Because of the limited interactions of the pencil beam with matter before reaching the patient, experimentally determined characteristics of the pencil beams were well reproduced by analytically modeling the beam phase space. Some facilities do use small passive devices, such as ridge filters, to optimize the energy spectrum of the pencil beam. In such cases, it may be advantageous to incorporate the treatment head in the simulation model to obtain the most accurate results. 20
Spot energy and output
For pencil beam scanning, experimental Bragg peak measurements of the deliverable pencil beams were directly matched to Monte Carlo simulations by determining the parameters that result in the best agreement, as described in more detail by Grassberger et al. 19 The energy of the beams needs to be chosen such that the range in water agrees with high accuracy. In addition, the energy spread is of importance to reproduce the depth–dose curve. The treatment planning system used at our institute defines pencil beams in absolute units of the number of incident protons, based on Faraday cup measurements. If treatment planning is based on monitor units, these need to be converted to an absolute number of incident protons. Small corrections to the absolute number of protons remain necessary to obtain the best possible agreement with simulations.
Spot geometry
Pencil beam spots at the exit of the treatment head were geometrically modeled as Gaussian and with a Gaussian energy spread. More complex mathematical descriptions can be used if needed, depending on the characteristics of the pencil beam scanning system. From the macroscopic properties of the pencil beam, individual protons were generated for the Monte Carlo simulation by randomly sampling these distributions.
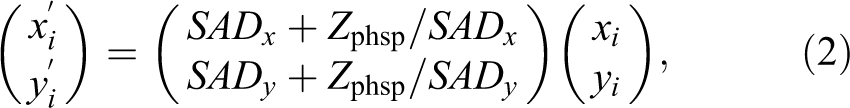
The positions of pencil beam spots are defined relative to isocenter. Knowing the location of the scanning magnets and the position of the treatment head relative to isocenter, they can be transformed to position and momentum direction at the treatment head exit. If SAD denotes the source-axis distance of the scanning magnet and Zphsp the distance of the treatment head exit from isocenter, the transformations for position (xi , yi ) and momentum direction (ui , vi ) for spot i are

Hardware simulation
Additional hardware may be used for certain treatments with the pencil beam scanning modality. For example, an aperture may reduce the lateral penumbra, 18 or a range shifter can be used to obtain proton ranges below the minimum proton energy that can be delivered. For these cases, we implemented a Monte Carlo simulation process between the phase space generation and the patient dose calculation, in which the proton beam was transported through the relevant hardware. A new phase space downstream of the hardware was then generated for patient dose calculation.
Dose Calculation
After the phase space upstream of the patient had been determined, the dose calculation in the patient anatomy was performed. The patient was modeled based on the CT scan using a voxelized geometry. 21 For a clinical Monte Carlo simulation, it is important to develop a consistent model of the stopping power of the patient’s tissue. The stopping power of the tissue in general is subject to uncertainty, 22 which leads to an uncertainty in the proton range. In order to facilitate comparisons between Monte Carlo-simulated dose distributions and a clinical planning system, the modeled stopping powers need to fully agree.
Patient-specific CT calibration
Similar to our clinical protocol, a preprocessing method was applied to the CT images to improve range accuracy. First, any objects not present during the actual treatment, such as the CT scanner couch, were removed from the images. This was done using the outer contour of the patient and immobilization hardware as created by the treatment planner. The CT numbers in the areas outside this contour were replaced by the CT number of air. Further, to account for systematic differences in the CT numbers due to factors such as patient size, a linear patient-specific calibration of the CT numbers was applied. This calibration was also carried out by the treatment planner. A recalibrated CT number H air for air, nominally defined as −1000 Hounsfield units (HU), was determined by taking the average of several sample voxels outside the patient, which were manually selected. For water, which is nominally at 0 HU, H water was derived by subtracting a predefined CT number difference from surrogate tissues that have a consistent X-ray attenuation slightly higher as compared to water, such as the brain, eye, cerebrospinal fluid, and muscles. The original CT numbers of the scan CT o were then renormalized to obtain the recalibrated CT scan CT c:

Elemental composition and density of tissues
Pencil beam dose calculations for proton therapy are based on a relationship between the CT number and the proton stopping power relative to water, obtained using the stoichiometric calibration method. 23 Calibrations are performed specifically for a CT scanner, in which the relative proton stopping powers are normally assumed constant for therapeutic energies.
For the Monte Carlo simulation of particle transport through the patient anatomy, a model of a physical material was created for each value of the CT number. The materials were described in terms of their basic properties: the physical density and elemental composition. The Monte Carlo code then derives the proton stopping power and many other simulation parameters from these material properties. We used the tissue materials according to the model of Schneider et al. 24
Although the proton stopping power of the tissue materials is not an input parameter of the Monte Carlo code, it remains the most important property in proton therapy. If the stopping power determined by the Monte Carlo code does not match exactly the stopping power for clinical dose calculation, an unbiased comparison of the methods is not possible. We therefore matched the stopping powers by slightly adjusting the mass densities of the materials in the Monte Carlo simulation, which also serves as a way of incorporating CT scanner-specific calibrations. The density ρ i for the Monte Carlo simulation of tissues with CT number i was set as:

in which Si is the mass stopping power of the tissue from the Monte Carlo code, Sw is the mass stopping power of water used by the code, ρ w is the density of water, and Pi is the proton stopping power relative to water obtained using the stoichiometric calibration.
Dose to water conversion
Doses in radiotherapy are conventionally reported as the water-equivalent dose, or dose to water, instead of the dose that is delivered to the medium. Therefore, it is necessary to convert the physical dose deposition as calculated using the Monte Carlo method to dose to water. Based on previous work, 25 we implemented an on-the-fly conversion of dose to medium Dm to dose to water Dw , using the following relationship:

in which Sw is the mass stopping power of the particle (proton or electron) in water, and Sm is the mass stopping power of the medium. The stopping powers were precalculated for simulation performance. For neutral particles that do not have a stopping power, we assumed the same conversion factors as for 100 MeV protons. This is a reasonable as their contribution to the dose is small (<1%). 26
Systematic uncertainties and validation
The simulation methods were designed to cancel out systematic uncertainties in the Monte Carlo simulations, such that dose distributions in water agree with pencil beam dose calculations, which are based on experimental measurements in water. The stopping powers of all patient tissue materials assigned to the CT numbers were defined relative to the stopping power of water, while the uncertainty in the stopping power of water was accounted for by tuning the initial properties of the beam.
To validate the systematic agreement, we compared the principal characteristics of pencil beam dose calculation and Monte Carlo simulations to experimental measurements in water. In the case of passively scattered beams, it is impractical to test every possible combination of range, modulation, and field size. Similar to our clinical quality assurance protocol, 14 we selected a representative set of 14 fields that span the entire range of delivery options. For pencil beam scanning, all deliverable energies were simulated. We found the beam ranges agreed with prescription parameters within 1 mm, and the error in absolute dose to the high-dose area was below 0.5%. The error in the modulation width of passively scattered fields was below 3 mm, which does not have a significant impact on dose calculations. 27
In addition to these validations specific to MCAUTO, our Monte Carlo models of the treatment head and the physics models of Geant4 have been validated through quantitative comparisons with experimental data, as described by Testa et al. 28 These validations showed good agreement between experimental data and the multiple Coulomb scattering model of Geant4, which is based on the established Molière theory. 29 The nuclear reaction models also showed sufficient accuracy for dose calculation purposes.
Statistical uncertainties
For routine Monte Carlo simulations of complete treatment plans, it is impractical to simulate as many histories as protons used to deliver the physical dose. Therefore, statistical uncertainties have to be considered. For dose calculation, a number of histories 4 to 5 orders of magnitude below the number of protons will yield accurate results inside the treatment field. Quantities resulting from rare events, such as dose deposited far outside the treatment field, require a larger number of histories to be simulated. By default, we simulated about 108 protons reaching the patient.
Proton–Nuclear Interactions
The simulation of proton–nuclear interactions in patient treatment plans is of interest because of the use of secondary prompt and delayed γ rays for in vivo range verification. Although the general nuclear reaction models incorporated in Monte Carlo codes are useful to obtain a complete approximation of radiation from secondary particles, it is oftentimes also needed to simulate the production of prompt γ rays or positron emitters from specific nuclear reactions. In this case, the accuracy of the phenomenological nuclear models may be insufficient. 30 –32 Also, a very large number of histories needs to be simulated to obtain a reasonable statistical precision for relatively rare events.
Instead, if the production rate and location of such secondary particles are the quantities of interest, these can be determined from cross-section data based on the fluence and energy spectrum of the primary particles, by accumulating for each primary particle track the small possibility of the occurrence of the nuclear reaction. Similar to dose calculation, these quantities can then be determined by simulating only a small subset of the actual protons delivered to the patient. Also, custom cross-section data can be used and optimized based on experimental data. The production p of secondaries from a reaction was determined during each simulation step in the volume of interest using:

in which σ(E) is the cross section, which is dependent on the proton energy E, L is the length of the simulation step, N A is the Avogadro constant, ρ is the mass density of the target element in the volume, A r is the relative atomic mass of the target element, and V is the size of the simulation volume.
Software Implementation
Our software implementation MCAUTO automates all simulation processes. The user is only required to provide the identifier of the treatment plan. All parameters are set to appropriate values for a routine calculation, but these may also be customized to change various aspects of the simulation.
Treatment Planning System Interface
Passively scattered proton therapy treatment plans at our institute are created using the XiO (Elekta AB, Stockholm, Sweden) treatment planning system. The patient CT scan, contours, beam parameters, and hardware were automatically obtained from the database of this system. For pencil beam scanning plans, we currently use XiO in combination with the in-house Astroid system. 33
TOPAS Monte Carlo Application
The Monte Carlo simulations were performed using TOPAS(TOPAS MC Inc., Oakland, CA), 34 which is a Monte Carlo application designed for proton therapy, based on the established Geant4 toolkit. 1 The results in this article were obtained using TOPAS 1.0 beta 8 and Geant4 9.6p02. The TOPAS software includes features tailored to radiotherapy and proton therapy simulations. Models of the proton treatment heads, patient geometry, and simulations parameters are specified in a human-readable format.
The Geant4 physics models were selected based on the applicability and accuracy in the therapeutic proton energy range, as well as validation studies. 35 We used a combination of Geant4 physics builders listed in Table 1. Range cuts for all particles were set to 0.05 mm, which means that any particles, such as secondary electrons, with an estimated range below this threshold are not transported, and their energy is deposited locally. The dimension of 0.05 mm was selected as being much smaller than a CT voxel. The dose calculation grid may be configured as desired and is independent of the CT geometry.
Geant4 Physics Builders Used for Monte Carlo Dose Calculation.

Cluster Computation
Due to the high computational demand of Monte Carlo simulations, MCAUTO was designed to make use of a high-performance computing cluster. Since independent particle histories are simulated, the simulations can be split in many parallel tasks to be performed on separate computer nodes. The clusters at our institute use the Load Sharing Facility(IBM, Armonk, NY) software to distribute computational tasks over the available resources, for which MCAUTO was designed to provide the necessary inputs. Through dependency conditions on the various computational jobs, all processes are performed in the right sequence. Simulations of a typical treatment plan were completed in about an hour when divided in 1000 parallel calculations.
Applications
In this section, we illustrate 2 different applications of MCAUTO, and we show some typical results of the Monte Carlo simulations. The MCAUTO software has also been recently applied in studies of site-specific range margins, 36 biologically optimized treatment plans, 37 and 4-dimensional dose calculations for patients with lung cancer. 38
Dose Calculation
An important application of general purpose Monte Carlo codes is to benchmark clinical dose calculation methods. 39 –41 Here, we show a comparison between MCAUTO simulations and pencil beam dose calculations for patients with head and neck cancer. The pencil beam algorithm by Hong et al 42 is currently used in our clinic. Ten clinical proton treatment plans with a total of 114 proton fields were simulated. These patients were treated with passively scattered proton therapy. Different sets of proton fields were alternated on different treatment days. We selected this tumor site because of the presence of bony anatomy and interfaces between lower- and higher-density tissues, which means the Monte Carlo method may have an advantage over pencil beam dose calculations.
The analysis of dose–volume parameters for the treatment plans of all 10 patients is presented in Table 2. For the primary clinical target volume (CTV), listed are the mean dose (Dmean) and the minimum dose received by 5% and 95% of the volume (D5, D95). The maximum dose to the brain stem, spinal cord, retina, and chiasm was also determined, as well as the mean dose to the parotid glands.
Dosimetric Analysis of Head and Neck Treatment Plans.a
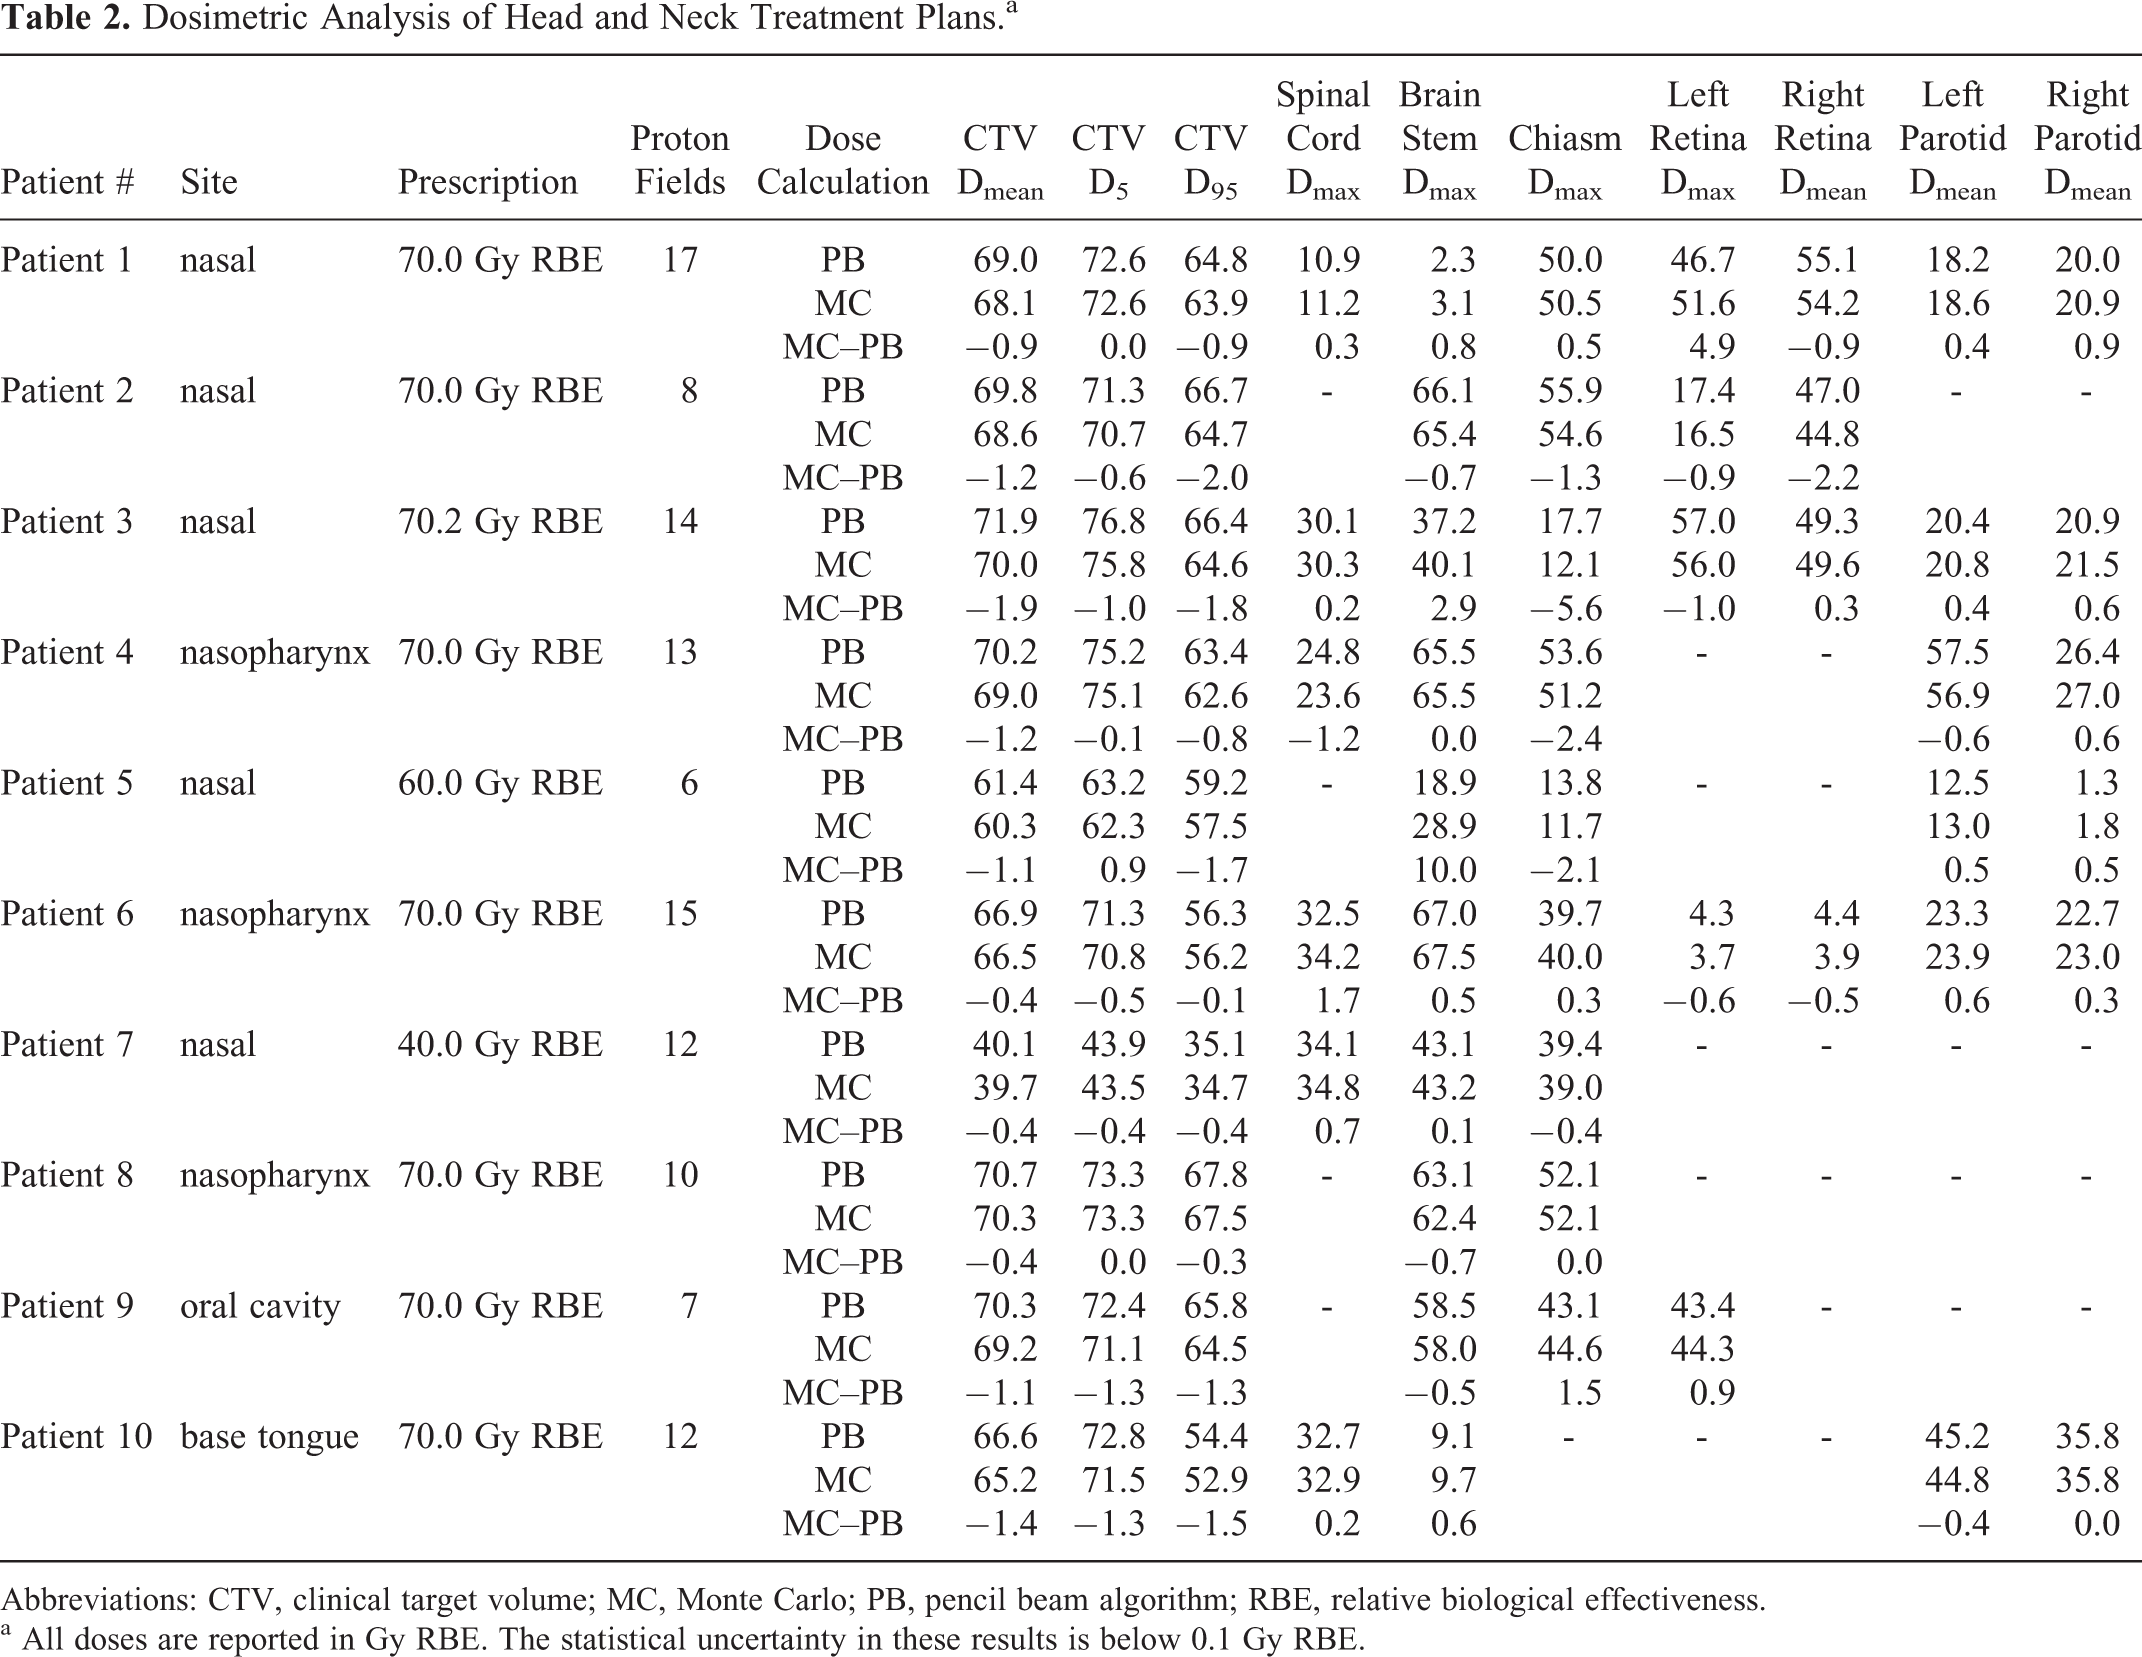
Abbreviations: CTV, clinical target volume; MC, Monte Carlo; PB, pencil beam algorithm; RBE, relative biological effectiveness.
a All doses are reported in Gy RBE. The statistical uncertainty in these results is below 0.1 Gy RBE.
Overall, we found a good agreement between the pencil beam and the Monte Carlo dose calculations. The mean CTV dose was slightly lower in the Monte Carlo simulations, with the difference being between 0 and 2 Gy relative biological effectiveness (RBE). This is because of the more accurate calculation of the proton scattering when the beam traverses inhomogeneous bony anatomy. The Monte Carlo simulations also showed a lower homogeneity of the dose delivered to the target. The largest differences were observed for beams with bone–tissue interfaces oriented parallel to the beam direction. As an example, depicted in Figure 4 is an axial slice of the dose calculation for patient 1. In this case, several fields passed through bone–tissue and bone–air interfaces, resulting in hot and cold spots in the target because of multiple Coulomb scattering. The pencil beam dose calculation algorithm does not reproduce these local dose differences because it only considers the integrated radiological depth for scatter calculations. 42 In Figure 5, we show the dose–volume histograms for the CTV and critical organs of this patient. Similar differences were seen in the CTV coverage for the other 9 patients.

Axial slice of the pencil beam and Monte Carlo dose calculation for patient 1. Doses above 1 Gy relative biological effectiveness (RBE) are shown as a color wash overlaid on the planning CT scan.

Dose–volume histograms of the treatment plan for patient 1, comparing the pencil beam dose calculation (solid lines) with Monte Carlo simulation (dashed lines).
The differences in the doses to organs at risk were more dependent on the specific patient anatomy. In most cases, the maximum dose to the brain stem, spinal cord, retina, and chiasm differed by less than 2 Gy RBE. The mean dose to the parotid glands differed by <1 Gy RBE. A number of outliers were however seen, which were mostly due to range degradation of fields stopping near organs at risk. For example, the maximum dose to the brain stem of patient 5 was 10 Gy RBE higher in the Monte Carlo dose calculation. The range degradation of one of the beams is shown in Figure 6.

Axial slice of the pencil beam and Monte Carlo dose calculation of a single anterior–posterior field for patient 5. Doses above 1 Gy relative biological effectiveness (RBE) are shown as a color wash overlaid on the planning CT scan.
In Vivo Proton Range Verification
Although proton beams deliver dose mainly through electromagnetic interactions, detailed studies of proton-induced nuclear reactions during proton therapy are becoming of increasing importance because of the use of secondary γ rays to facilitate in vivo verification of the beam delivery to the patient. As described in the Proton–nuclear interactions, we implemented a method to evaluate the emission of secondary particles from specific reactions based on custom cross-section libraries. As an example, shown in Figure 7 is a comparison of the deposited dose and the emission of 6.13 MeV prompt γ rays from the 16O(p, p’γ 6.13) 16O reaction at a 90° angle with the primary proton beam direction. This nuclear reaction simulation was based on differential cross sections that were experimentally determined. 43 These simulations can be further extended to include γ ray attenuation and detection.
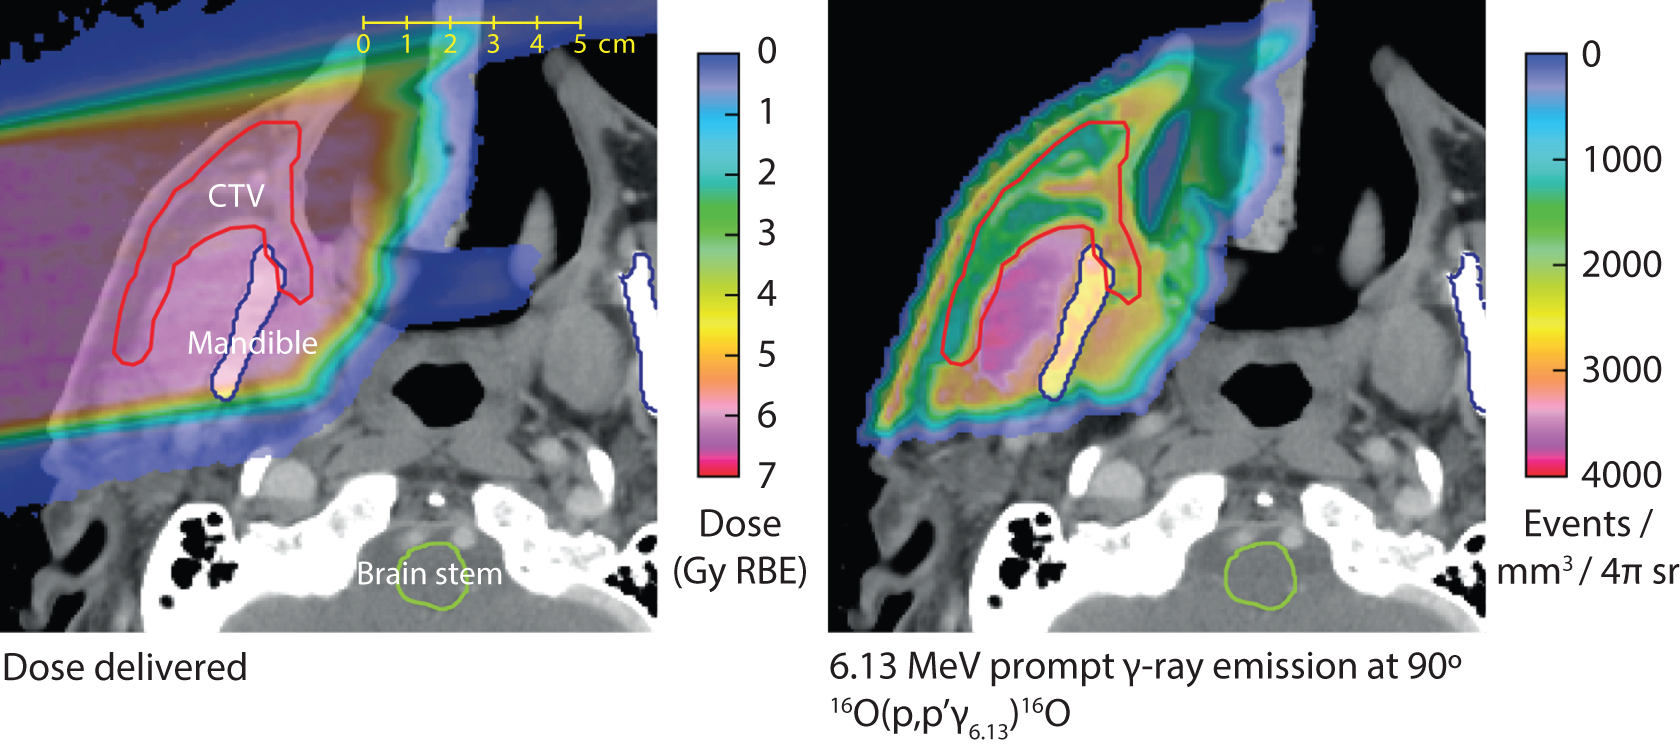
Monte Carlo dose calculation and simulation of a specific proton-induced nuclear interaction, resulting in 6.13 MeV prompt γ ray emission, for a single proton field. The prompt γ ray simulation is based on experimentally determined differential cross sections.
Discussion and Conclusions
We have described a set of methods for routine Monte Carlo simulation of clinical proton therapy treatment plans. To take full advantage of the Monte Carlo method for accuracy of clinical proton therapy simulations, we found it is of prime importance to study carefully how uncertainties in the physics models relate to the main quantities of clinical relevance, such as the range of the proton beam, the dose deposited to water, and the prescription dose. Our methods were designed to ensure consistency in the approximations that are common to both Monte Carlo and clinical pencil beam dose calculation methods, such as the stopping powers of patient tissues. We matched the clinical prescriptions with high accuracy, even if fundamental parameters in the physics models are not known with the same accuracy.
We developed a framework that automates simulations in a consistent manner. Treatment plans, CT scans, and associated data were acquired from the treatment planning system and converted to input files for the TOPAS Monte Carlo application. Simulations were performed on a high-performance computing cluster. The results were normalized to absolute units and can be exchanged through DICOM RT.
The primary goal of these methods and their implementation is to enable the routine use of clinical Monte Carlo simulations for proton therapy research. For example, for clinical trials, it becomes feasible to retrospectively recalculate dose distributions for large groups of patients and to provide the best possible estimate of the delivered dose to correlate with outcome parameters. Improved dose calculation methods for clinical use can also be benchmarked against a validated Monte Carlo code. Patient-specific simulations of proton–nuclear interactions enable in vivo range verification methods to be evaluated in realistic clinical scenarios.
A comparison was shown between Monte Carlo dose calculations generated using MCAUTO and clinical calculations performed using a pencil beam algorithm. 42 In this evaluation of 10 treatment plans for patients with head and neck cancer, we found good agreement between pencil beam and Monte Carlo dose calculations. Compared to the clinical dose calculation, the main differences we identified in the Monte Carlo simulation were a lower homogeneity of the dose delivered to the target and increased range degradation around the end-of-range of the beams. Both are a result of the more accurate simulation of proton scattering around interfaces between low- and high-density tissues in the beam path, which represents the most important benefit of Monte Carlo proton dose calculation. It is anticipated that clinical Monte Carlo dose calculations can facilitate a reduction in the currently used margins. 22
We have also shown a nuclear reaction simulation in which the general Monte Carlo models were combined with specifically optimized cross sections based on experimental data, which provide an accuracy that cannot be achieved with phenomenological nuclear reaction models. Large-scale simulations of proton–nuclear interactions are expected to be of increasing importance as potentially clinically applicable in vivo range verification methods are being proposed and studied experimentally. For example, Monte Carlo methods are very suitable to evaluate the robustness of different methods in the presence of inhomogeneities in the patient anatomy and the uncertainties in tissue composition.
Our work also serves as an example of complete integration of the TOPAS Monte Carlo application, clinical treatment planning systems, and computing infrastructure. Although the modeling of the treatment head geometry and the interface to the treatment planning system are specific to our institute, TOPAS will facilitate development of such integrated infrastructure at other proton therapy centers.
Footnotes
Acknowledgments
The authors would like to thank Tom Madden and Hanne Kooy, PhD, for providing the implementation of the pencil beam dose calculation algorithm. We would like to thank Joseph Perl and the TOPAS collaboration for their assistance with the TOPAS implementation.
Declaration of Conflicting Interests
The author(s) declared no potential conflicts of interest with respect to the research, authorship, and/or publication of this article.
Funding
The author(s) disclosed receipt of the following financial support for the research, authorship, and/or publication of this article: US Department of Health and Human Services, National Institutes of Health, National Cancer Institute C06-CA059267.