
Abstract
Introduction
This study sought to develop a predictive model using CT-based habitat radiomics to forecast pathological complete response (pCR) and progression-free survival (PFS) in esophageal squamous cell carcinoma (ESCC) patients receiving standardized neoadjuvant chemoradiotherapy (nCRT) followed by curative surgery.
Methods
We retrospectively analyzed baseline CT imaging data from 228 ESCC patients in a prospective cohort database. Patients were randomly divided into training and validation sets (7:3 ratio). Whole-tumor and habitat-derived radiomic features were extracted from pretreatment CT scans. For pCR prediction, habitat signatures were developed using Logistic Regression (LR), RandomForest (RF), and XGBoost models, optimized via grid search. PFS prediction employed Cox proportional hazards modeling with selected features. Model performance was assessed using the area under the receiver operating characteristic curve (AUC), Hosmer-Lemeshow calibration curves, and decision curve analysis.
Results
The habitat models retained 10 features for pCR prediction and 12 for PFS prediction. For pCR, the habitat-derived RF model demonstrated superior performance (training AUC: 0.821; validation AUC: 0.826), outperforming both other habitat models and the whole-tumor radiomics model (training AUC: 0.645). Similarly, the habitat-based RF model for PFS achieved higher AUCs (training: 0.759, 95% CI: 0.627-0.889; validation: 0.810, 95% CI: 0.653-0.966) compared to whole-tumor radiomics (training: 0.623; validation: 0.519).
Conclusion
Our analyses indicated a trend where habitat radiomics might outperform whole-tumor radiomics in predicting pCR and PFS for resectable ESCC after nCRT. While this merits further investigation, current evidence is insufficient to confirm its clinical utility for personalized treatment guidance.
Keywords
Introduction
Esophageal cancer (EC), a leading gastrointestinal malignancy with substantial global morbidity and mortality, ranks as the seventh most common cancer and sixth leading cause of cancer deaths worldwide. 1 Its principal subtypes – esophageal squamous cell carcinoma (ESCC) and esophageal adenocarcinoma (EAC) – exhibit distinct epidemiological patterns, with ESCC predominating in Asian populations. 2 Due to the subtle symptoms of early-stage EC, most patients are diagnosed at an advanced stage, resulting in poor prognosis with a five-year survival rate of less than 20%. 3 Following landmark trials (CROSS, NEOCRTEC5010), neoadjuvant chemoradiotherapy (nCRT) with subsequent esophagectomy has become standard care for locally advanced ESCC.4–6 However, this approach carries significant surgical morbidity, functional compromise, and quality-of-life impairment. 7 Consequently, organ-preserving strategies have emerged, with evidence suggesting active surveillance after clinical complete response (cCR) to nCRT yields comparable survival to esophagectomy while improving quality metrics. 8 This paradigm shift underscores the critical need for individualized predictive models to accurately stratify therapeutic response and prognosis, enabling tailored treatment selection.
Radiomics, a burgeoning methods by extracting high-dimensional quantitative features from medical images to characterize treatment response, tumor heterogeneity and microenvironment.9,10 This non-invasive, high-throughput approach provides comprehensive spatial information beyond conventional imaging. While demonstrating promise in EC treatment response prediction,11,12 most existing studies focus on extracting features from the entire tumor region, neglecting the tumor heterogeneity.13–16 most radiomic studies analyze whole-tumor regions, overlooking intratumoral heterogeneity – a critical determinant of therapeutic outcomes. However, Sub-region radiomics overcomes this by partitioning tumors into biologically distinct habitats, which provides a more accurate representation of their spatial heterogeneity and a realistic restoration of their intrinsic characteristics. This methodology has shown superior prognostic performance in multiple malignancies (such as in non-small cell lung cancer,17,18colorectal cancer19,20 and ovarian carcinoma 21 ) compared to whole-tumor analysis. However, quantitative heterogeneity analysis within tumors has not been explored in the context of nCRT for ESCC.
Therefore, we conducted this study to develop and validate a sub-region radiomics-based model for predicting pathological complete response (pCR) and survival in ESCC. Utilizing a prospective cohort database, we extracted radiomic features, applied machine learning for feature selection/model construction, and evaluated performance in prognostication. This approach aims to provide a non-invasive decision-support tool for personalized post-nCRT management, ultimately enhancing quality of life and clinical outcomes.
Materials and Methods
Data Sets
This retrospective analysis utilized a prospectively maintained database. We included 228 consecutive patients with locally advanced ESCC treated with nCRT followed by esophagectomy between June 2019 and April 2024. The study had been approved by the Ethics Committee of Ruijin hospital, Shanghai Jiao Tong University School of Medicine (approved ID: 24-210). And written informed consent was obtained from all participants. The consent was for participation in the clinical study and the use of their medical data for research purposes, as detailed in the approved informed consent form. This study was conducted according to the Declaration of Helsinki and Good Clinical Practice. The major inclusion criteria were as follows: (1) pathologically conformed ESCC; (2) patients treated with standardized nCRT followed by curative esophagectomy; (3) availability of complete clinical-pathological records; (4) pre-treatment contrast-enhanced CT imaging. And the exclusion criteria for the study: (1) declined neoadjuvant chemoradiotherapy; (2) Distant metastasis identified after nCRT; (3) Contraindication to or refusal of surgery. The enrolled ESCC patients were randomly allocated into a training set (159 patients) and a testing set (69 patients) in a 7:3 ratio. Figure 1 details the patient selection process.

The Flow Chart of Patient Selection.
Clinical and Pathological Features Analysis
All patients underwent radical esophagectomy with lymph node dissection 4-6 weeks post-nCRT. Radiotherapy was delivered via intensity-modulated radiotherapy (IMRT) using 6 MV X-rays, with a total dose of 41.4 Gy in 1.8 Gy daily fractions. Patient positioning utilized skin markers and vertebral anatomical landmarks. Target volume delineation and organ-at-risk constraints followed established protocols. Concurrent chemotherapy consisted of weekly carboplatin (AUC 2 mg/mL/min) and paclitaxel or nab-paclitaxel (50 mg/m²). The clinical and pathological features related to prognosis were also identified. All pathological features were analyzed by 2 pathologists experienced in ESCC diagnosis.
Image Acquisition
Tumor Segmentation
Region of interest (ROI) delineation was performed on pretreatment CTs using the Eclipse treatment planning system (Varian Medical Systems). Two board-certified radiologists independently annotated VOIs, with discordances adjudicated by a senior radiologist (>10 years experienced). This curated dataset served as ground truth for subsequent automated segmentation model development.
Data Preprocessing
The CT images were obtained using a 128-row CT scanner in the axial, coronal and sagittal planes (Philips iCT 128, Philips Medical System, The Netherlands) with 120 kV voltage, 300-400 mA current, 3 mm slice thickness, and 512 × 512 matrix. Standardized preprocessing included: (1)HU normalization: [−50, 650] window (width:700, level:300); (2)Isotropic resampling: 1 × 1 × 1 mm3 voxel spacing; (3) Intensity discretization: 25-bin fixed width.
Habitat-Based Radiomics Signature
Habitat Generation
Comprehensive Radiomic Feature Extraction: This process involved extracting detailed local features from each voxel in the dataset using a 5 × 5 × 5 moving window. These features encompass a variety of measurements and attributes, including intensity, texture, and other statistical properties, which are crucial for understanding the intricate details of the dataset. Such detailed insights enable more precise modeling and analysis.
In this study, 19 radiomic features were extracted from each voxel, offering a multidimensional characterization of each subregion. These features included a range of shape descriptors, textural features, and first-order statistical attributes. The specific features extracted were: firstorder_Entropy, firstorder_MeanAbsoluteDeviation, firstorder_Median, glcm_DifferenceAverage, glcm_DifferenceEntropy, glcm_DifferenceVariance, glcm_Imc1, glcm_Imc2, glcm_InverseVariance, glcm_JointEnergy, glcm_JointEntropy, glcm_SumEntropy, glrlm_LongRunEmphasis, glrlm_RunEntropy, glrlm_RunVariance, glszm_SizeZoneNonUniformityNormalized, glszm_SmallAreaHighGrayLevelEmphasis, ngtdm_Contrast, and ngtdm_Strength.
In-depth Clustering Analysis: The K-means algorithm was utilized to analyze the multidimensional feature space derived from the radiomic features. The algorithm was applied with varying numbers of cluster centers, ranging from 3 to 9, to categorize distinct habitat regions within the tumor. The performance of the clustering was evaluated using the Calinski-Harabasz score, ensuring the selection of the most statistically significant clustering arrangement.
The K-means algorithm functions by partitioning data into K distinct clusters. It iteratively updates the centroids of these clusters to minimize the sum of squares within each cluster. The central component of the K-means algorithm is the objective function, which is optimized to achieve effective clustering.

J is the objective function. N is the number of data points. K is the number of clusters. wik is a binary indicator (1 if data point i is in cluster k, 0 otherwise). xi is the ith data point. μk is the centroid of cluster k. ∥ xi − μk ∥ 2 is the squared Euclidean distance between data point i and centroid k.
Habitat Region Synthesis
Following the clustering analysis, subregions with identical cluster IDs were amalgamated. This synthesis resulted in the formation of comprehensive habitat regions, each representing a unique microenvironmental characteristic within the tumor.
Feature Extraction
We performed comprehensive feature extraction across distinct tumor compartments, including intratumoral and peritumoral regions. All CT volumes underwent multiscale image transformations: Wavelet decomposition (8 directional filters) and Laplacian of Gaussian (LoG) filtering (σ = 0.5-3.0 mm). From both native and transformed images, IBSI-compliant features (pyradiomics v3.0.1) were computed across three domains: geometry, intensity, and texture. Geometric features define the tumor's shape, intensity features measure the voxel brightness levels, and texture features, utilizing advanced techniques such as GLCM (Gray Level Co-occurrence Matrix), GLRLM (Gray Level Run Length Matrix), GLSZM (Gray Level Size Zone Matrix), and NGTDM (Neighborhood Gray Tone Difference Matrix), elucidate spatial patterns.
For habitat analysis, we extracted radiomic features from specific subregions within the tumor. Due to the unsupervised nature of our clustering, we employed the K-Nearest Neighbors (KNN) method to label unclustered areas, ensuring consistency across the delineated habitat regions. Feature extraction was conducted using the pyradiomics tool (version 3.0.1), strictly following the Imaging Biomarker Standardization Initiative (IBSI) guidelines.
We further enhanced this model by integrating radiomic features based on habitat. We fused characteristics from different regions as follows:

This formula represents the fusion of features from the
Feature Selection
Statistical Analysis
The study began by applying Z-score normalization to standardize the scales of measurement, ensuring unbiased feature comparison. We then performed t-tests with a significance threshold of P < .05 to identify statistically significant features. This focused approach enabled us to concentrate on the features with true predictive power, thereby improving the accuracy of our research.
Correlation Analysis
To address feature redundancy, we evaluated feature repeatability and reliability using Pearson's correlation, with a focus on correlations greater than 0.9. Highly correlated feature pairs were pruned, with one feature removed from each pair through a careful elimination process. The final selection of the top 32 features per sample was made using the mRMR algorithm, which optimally balances relevance and redundancy, thus preventing overfitting and emphasizing the most impactful features.
Lasso Regression
Lasso regression played a crucial role in our feature selection framework by shrinking the coefficients of non-essential features to zero. The optimal regularization parameter (λ) was determined using 10-fold cross-validation to ensure only the most relevant features were retained.
Signature Building
pCR Prediction
Habitat Signature
We developed the habitat signature using models such as Logistic Regression (LR), RandomForest, and XGBoost, optimized through a Grid-Search algorithm. In the training phase, 10-fold cross-validation was employed to determine the model parameters that provided the best median performance for model construction.
Radiomics Signature
The radiomics signature utilized a feature extraction and selection protocol analogous to that employed in the habitat analysis, ensuring consistency in methodology and analytic rigor.
PFS Prediction
Clinical Signature
For the clinical model, multivariable analysis was conducted with statistically significant features. The approach to machine learning algorithms and parameter tuning was aligned with that used in the habitat analysis to maintain methodological consistency.
Combined Model
This model integrates insights from both the Radiomics, Habitat and Clinical Signatures, presented through a Nomogram for enhanced interpretability and application.
Similar to the pCR prediction approach, we employed the Cox proportional hazards model to predict progression-free survival (PFS) using selected features. For the trained model, we utilized X-tile software to identify optimal cut-off points, which facilitated the stratification of patients into high- and low-risk groups. Survival outcomes between these groups were assessed using Kaplan-Meier curves, with differences in survival significance evaluated through the log-rank test.
Statistical Analysis
In our study, we assessed the normality of clinical features using the Shapiro-Wilk test. Continuous variables were evaluated for significance using the t-test or the Mann-Whitney U test, depending on their distribution. Categorical variables were analyzed using Chi-square (χ²) tests. TRIPOD checklist were used to improve the quality of our reporting. 22 All data analyses were conducted using Python 3.7.12. For statistical analysis, Statsmodels version 0.13.2 was utilized. Post hoc power analysis was performed using R packages pmsampsize (v1.1) and powerMediation (v0.3.3).
Results
Clinical Features of Patients
The clinical and pathological characteristics of the patients were listed in Table 1. A total of 228 patients were enrolled for establishing pCR predicting model, including 159 in the training cohort and 69 in the validation cohort. The median age was 66 (range:44-76 years) and 66 (39-79 years), respectively. The majority of the patients were male:86.2% and 81.2%, respectively. There were no significant differences in age, sex, tumor length, tumor location, smoking history, drinking history and co-morbidity between the two groups (P > .05, Table 1). For the PFS model, 198 patients were enrolled, with 141 in the training cohort and 57 in the validation cohort (excluding 30 patients who underwent surgery within 3 months). The median follow-up time for this cohort was 17 months (95% CI: 15-19 months).
Baseline Characteristics Between Training Cohort and Validation Cohort.

Clinical Model for pCR
we performed univariate logistic regression analysis to reveal potential factors for predicting pCR after nCRT, but none of the clinical factors had statistically differences (all P > .05, Supplemental Table 1), we thus could not establish clinical models for predicting pCR.
Different Number of Clusters
We evaluated the effect of altering the number of clustering centers from 3 to 10 on the effectiveness of our analysis. For CT data, based on the Calinski-Harabasz (CH) score, silhouette coefficient (SC), and Davies-Bouldin (DB) score, we observed superior performance at three clustering centers. The optimal number of clusters was determined to be three based on the Calinski–Harabasz score (Figure 2A). Consequently, we determined that three clustering centers provided the optimal delineation of subregions in our habitat analysis for CT data. Figure 2B shows the volume and proportion of each habitat and the voxel values on different sequences. For the sub- region proportion, habitat 2 was the most predominant (46.6%), followed by habitats 1 (39.23%) and 3 (14.17%).

The Methods for Identifying Number of Clustering Centers: (A): Calinski–Harabasz Score Plot; (2): the Optimal Number of Clusters.
Performance of Different Models for pCR
In our study, we extracted a total of 1834 radiomic features, categorized into shape, first-order, and texture types. For the Habitat model, we extracted features from three distinct regions, totaling 5502 features, with each region contributing 1834 features.
After feature reduction and LASSO selection, 3 features and 10 features were retained in the conventional radiomics model and habitat models for predicting pCR (Figure 3G and H).
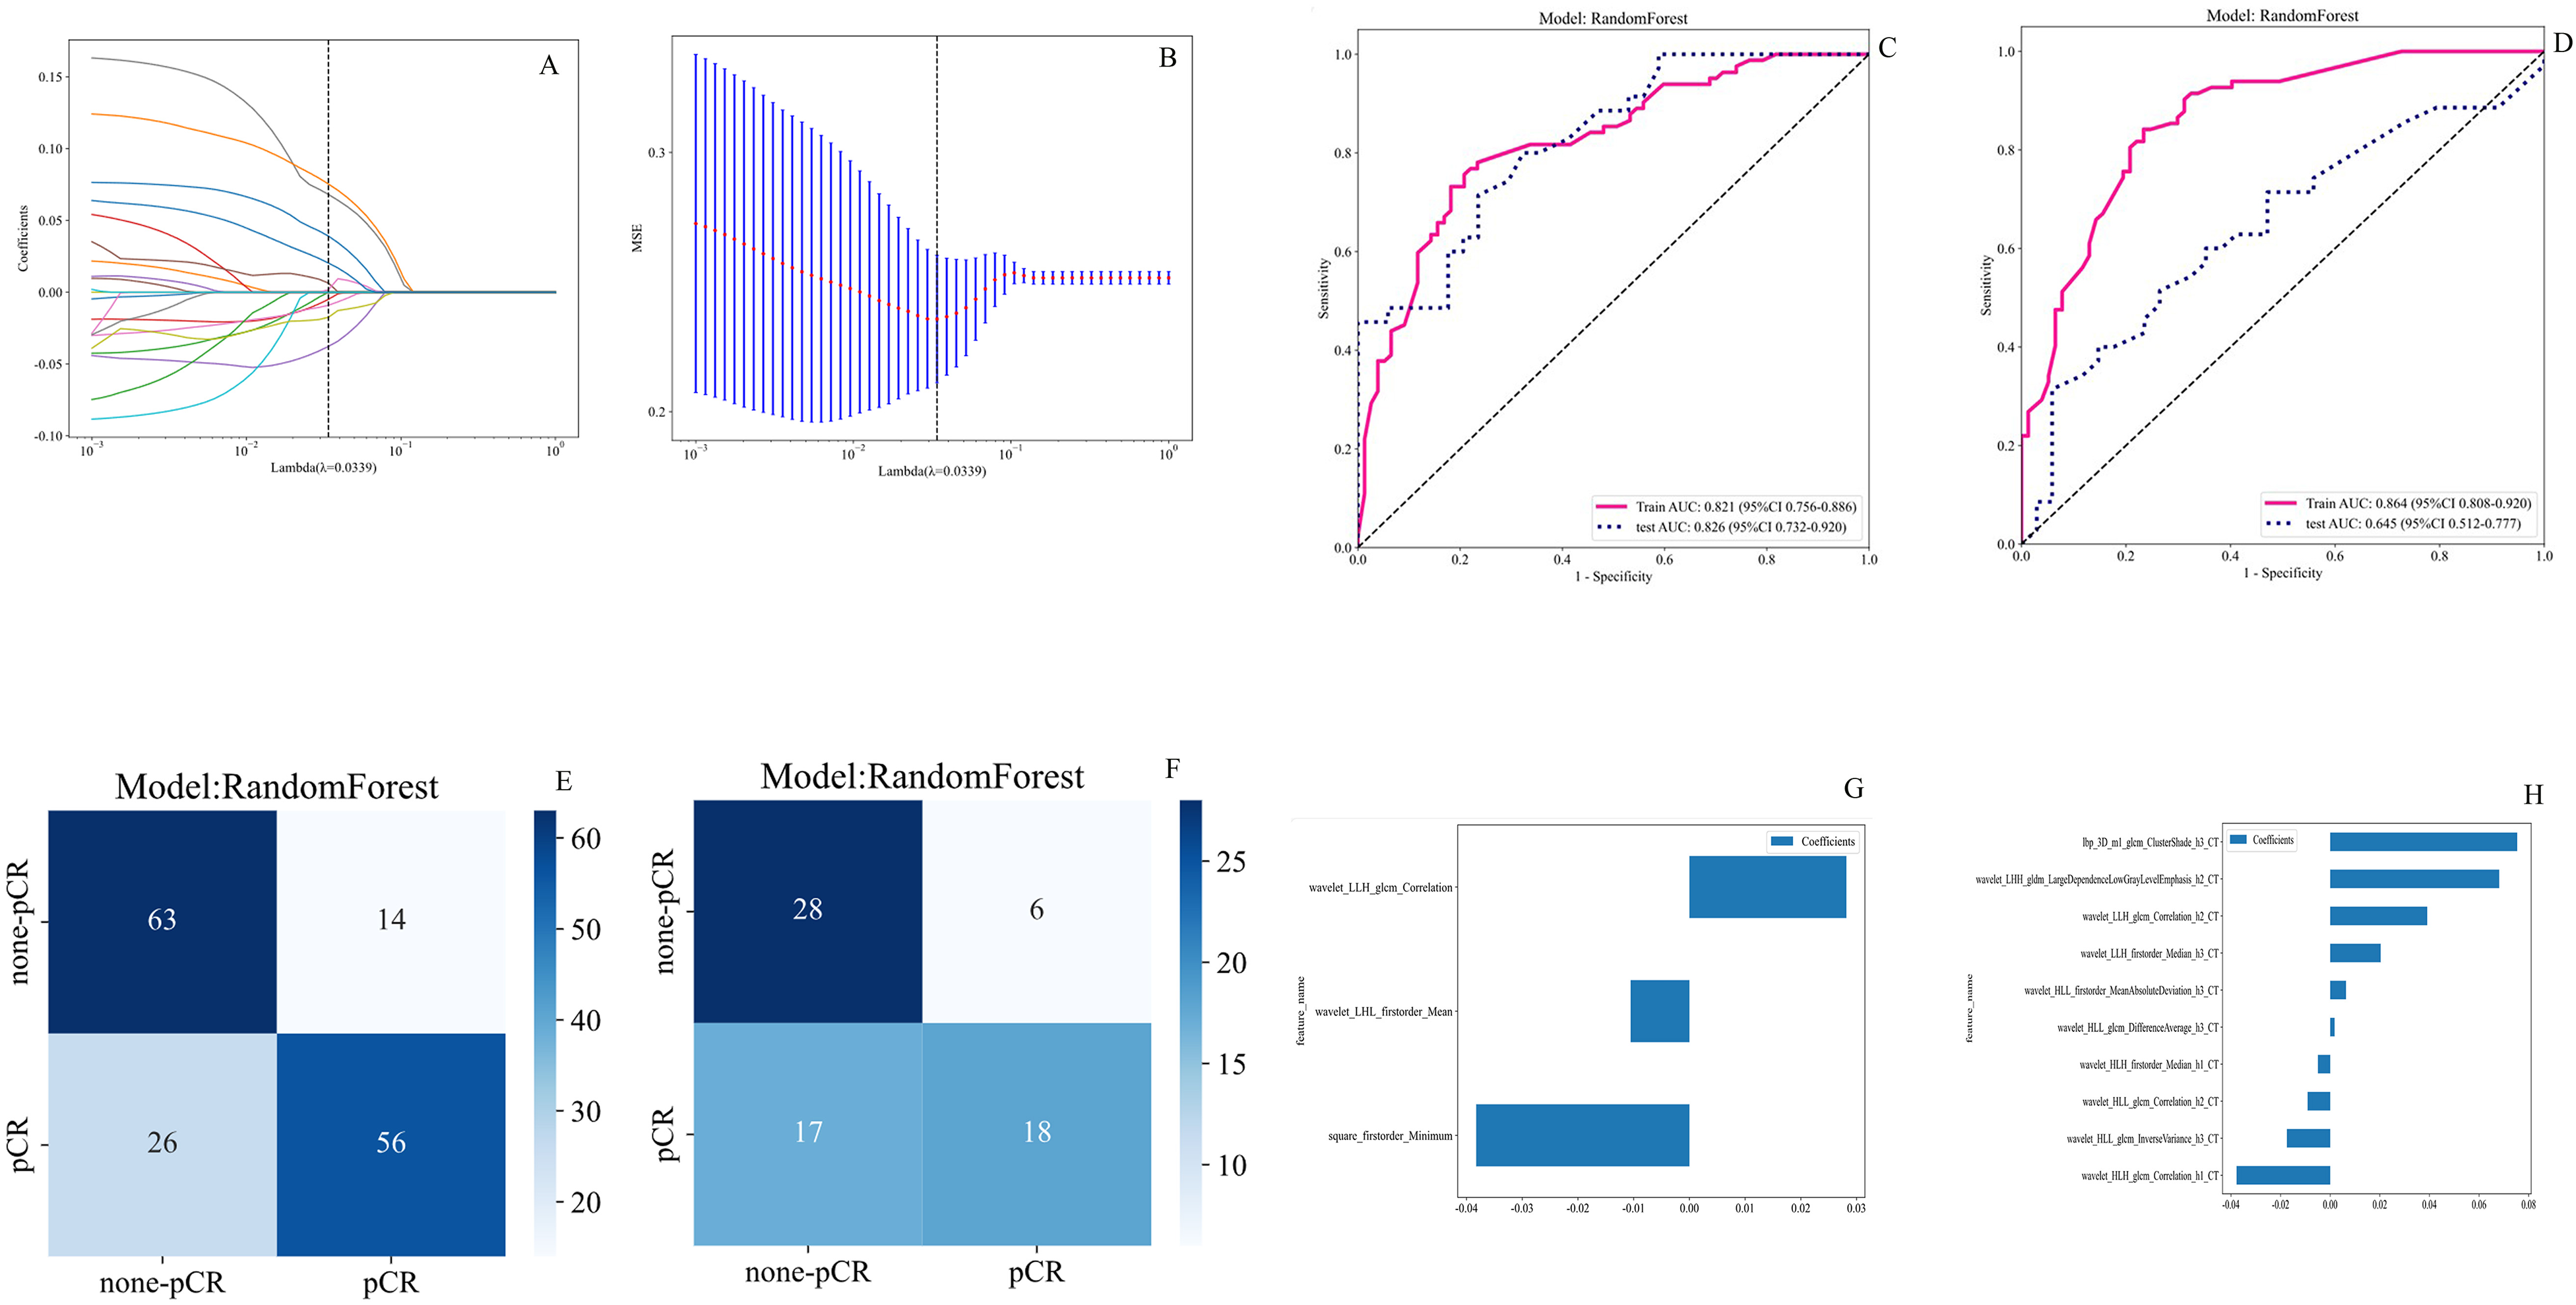
Radiomic Features Associated with pCR Were Selected Using LASSO Regression Models. (A): Coefficients Curves of Radiomic Features. the Vertical Axis Represents the Radiomic Features’ Coefficients and the Horizontal Axis is λ; (B): the Cross-Validation Curve. the Vertical Axis is the Mean Square Error, and the Horizontal Axis is Lambda (λ). (C): AUC Curve of Habitat and Whole Tumor-Based for Predicting pCR in the Training set; (D): AUC Curve of Habitat and Whole Tumor-Based for Predicting pCR in the Validation set; E: Confusion Matrix for Habitat-Radiomics Model in the Training set; (F) Confusion Matrix for Habitat-Radiomics Model in the Validation set; (G): Identification of Three Radiomics Features That Exhibited non-Zero Coefficients in Radiomics Model; (G): Identification of ten Radiomics Features That Exhibited non-Zero Coefficients in Habitat-Based Model.
According to the results of 10-fold cross-validation, the optimal machine learning algorithms to build signatures for radiomics pCR model and habitat pCR model were both RF. Table 2 and Figure 3 show the performance of the different models for predicting pCR (Lambda = 0.0339). Among the three machine learning algorithms, Random Forest (RF) machine learning achieved the most promising performance for habitat-derived radiomic model and whole tumor radiomics model in the train and test set (Table 2). In the training cohort, the AUCs of the whole tumor radiomics model and habitat model were 0.864 (0.808-0.920, Figure 3C) and 0.821 (0.756-0.886, Figure 3C), respectively. In the validation cohort, the AUCs were 0.645 (0.512-0.777) and 0.826 (0.732-0.920, Figure 3D), respectively. The prediction performance of the habitat model was higher than those of the radiomics model based on the AUCs of the validation cohort, considered to be the optimal model.
Habitat or Whole Tumor-Based pCR Model Performance of Different Machine Learning Algorithms in the Training and Testing Sets.

Clinical Model for PFS
Univariate Cox regression analyses were performed on clinical characteristics including cT stage, cN stage, tumor length, tumor location, smoking status, drinking status, BMI, sex and age, and demonstrated that tumor length and BMI significantly influenced patient prognosis (P < .05, Supplemental Table 2). And multivariate cox-regression analysis indicated that tumor length and BMI remained the two significant factors associated with PFS. Based on these findings, a clinical model was established (Figure 4A and D). The clinical model exhibited C-index values of 0.662 (95% CI: 0.522-0.801) and 0.514 (95% CI: 0.223-0.805), respectively.

The Performance of Conventional Radiomics Model, Clinical Model, Habitats-Based Model and Combined Model in the Training and the Validation Cohorts. the AUC, DCA and Calibration Curves of Different Models in the Training Cohort (A, B, C) and the Validation Cohort (D, E, F). AUC, Area Under the Receiver Operating Characteristic Curve; DCA, Decision Curve Analysis.
Performance of Different Models for Predicting PFS
The habitat-based Rad-score was integrated with the clinical model to develop a combined clinical-radiomics model for predicting PFS. Then, the performance of clinical model, the radiomics model, habitats model and combined model (clinical with habitat-radiomics) in the training cohort and validation cohort is summarized in Supplemental Table 3. Figure 4A and D display the ROC curves and corresponding AUC results of the four different prediction models for predicting PFS in ESCC patients after standardized nCRT. The evaluation is performed on both the training and validation cohorts. Habitat-based model archived the most promising performance when compared to other three models in the validation set (AUC 0.81, 95%CI: 0.653-0.966). The calibration curves of the four prediction models, depicted in Figure 4B and E, show the performance of these models in relation to perfect fitting, across both the training and validation groups. The model fit of the validation group is slightly inferior when compared to the training set. Figure 4C and F illustrate the decision curves of the four prediction models in the training and validation sets, respectively. The utilization of these habitat-based prediction models yields a higher overall net benefit in predicting PFS for patients undergoing nCRT in ESCC, as compared to other three models and non-intervention patients, which had been validated by using DeLong test for comparing the different models.
Rad-Score Construction
A total of 7 and 12 features together with their corresponding coefficients for whole tumor radiomics and habitat-based radiomics, and the Rad-score formula was constructed based on their coefficients. The optimal cutoff value for Rad-score diagnosis of PFS in the training cohort was determined to be 1.48 for habitat-based radiomics. The Rad-score was calculated as follows:
HR(t) = h(t) + 0.0149 × wavelet_HLL_ngtdm_Contrast_h2_CT − 0.0798 × wavelet_HLH_glcm_Idn_h2_CT + 0.0905 × wavelet_HHL_glcm_Idn_h2_CT + 0.0386 × log_sigma_2_0_mm_3D_firstorder_Skewness_h3_CT + 0.1507 × lbp_3D_k_glcm_ClusterShade_h3_CT + 0.1671 × log_sigma_3_0_mm_3D_firstorder_Skewness_h3_CT + 0.2513 × log_sigma_3_0_mm_3D_firstorder_Maximum_h3_CT + 0.3278 × exponential_glszm_ZoneEntropy_h2_CT + 0.2166 × squareroot_ngtdm_Busyness_h1_CT + 0.3171 × lbp_3D_m1_glcm_ClusterShade_h3_CT + 0.3363 × wavelet_LLH_glszm_GrayLevelNonUniformityNormalized_h1_CT + 0.4425 × lbp_3D_m1_firstorder_InterquartileRange_h2_CT
The patients were then divided into high-risk and low-risk groups as follows: the high-risk group consisted of 50 cases in the training cohort and 13 cases in the validation cohort, while the low-risk group consisted of 91 cases in the training cohort and 44 cases in the validation cohort. The log-rank tests indicated the 1-year PFS of the high-risk group was significantly lower than low-risk group in the training and validation cohort (P < .05, Figure 5A and B). similarly, the patients were then divided into high-risk and low-risk groups based on whole tumor radiomics model. However, the log-rank tests indicated the 1-year PFS of the high-risk group was significantly lower than low-risk group in the training cohort (Figure 5C), but not in the validation cohort (P = .27, Figure 5D). Our result suggested that habitat-derived radiomic features could provide more precise predictions for PFS of resectable ESCC after nCRT when compared to whole tumor radiomics-model.
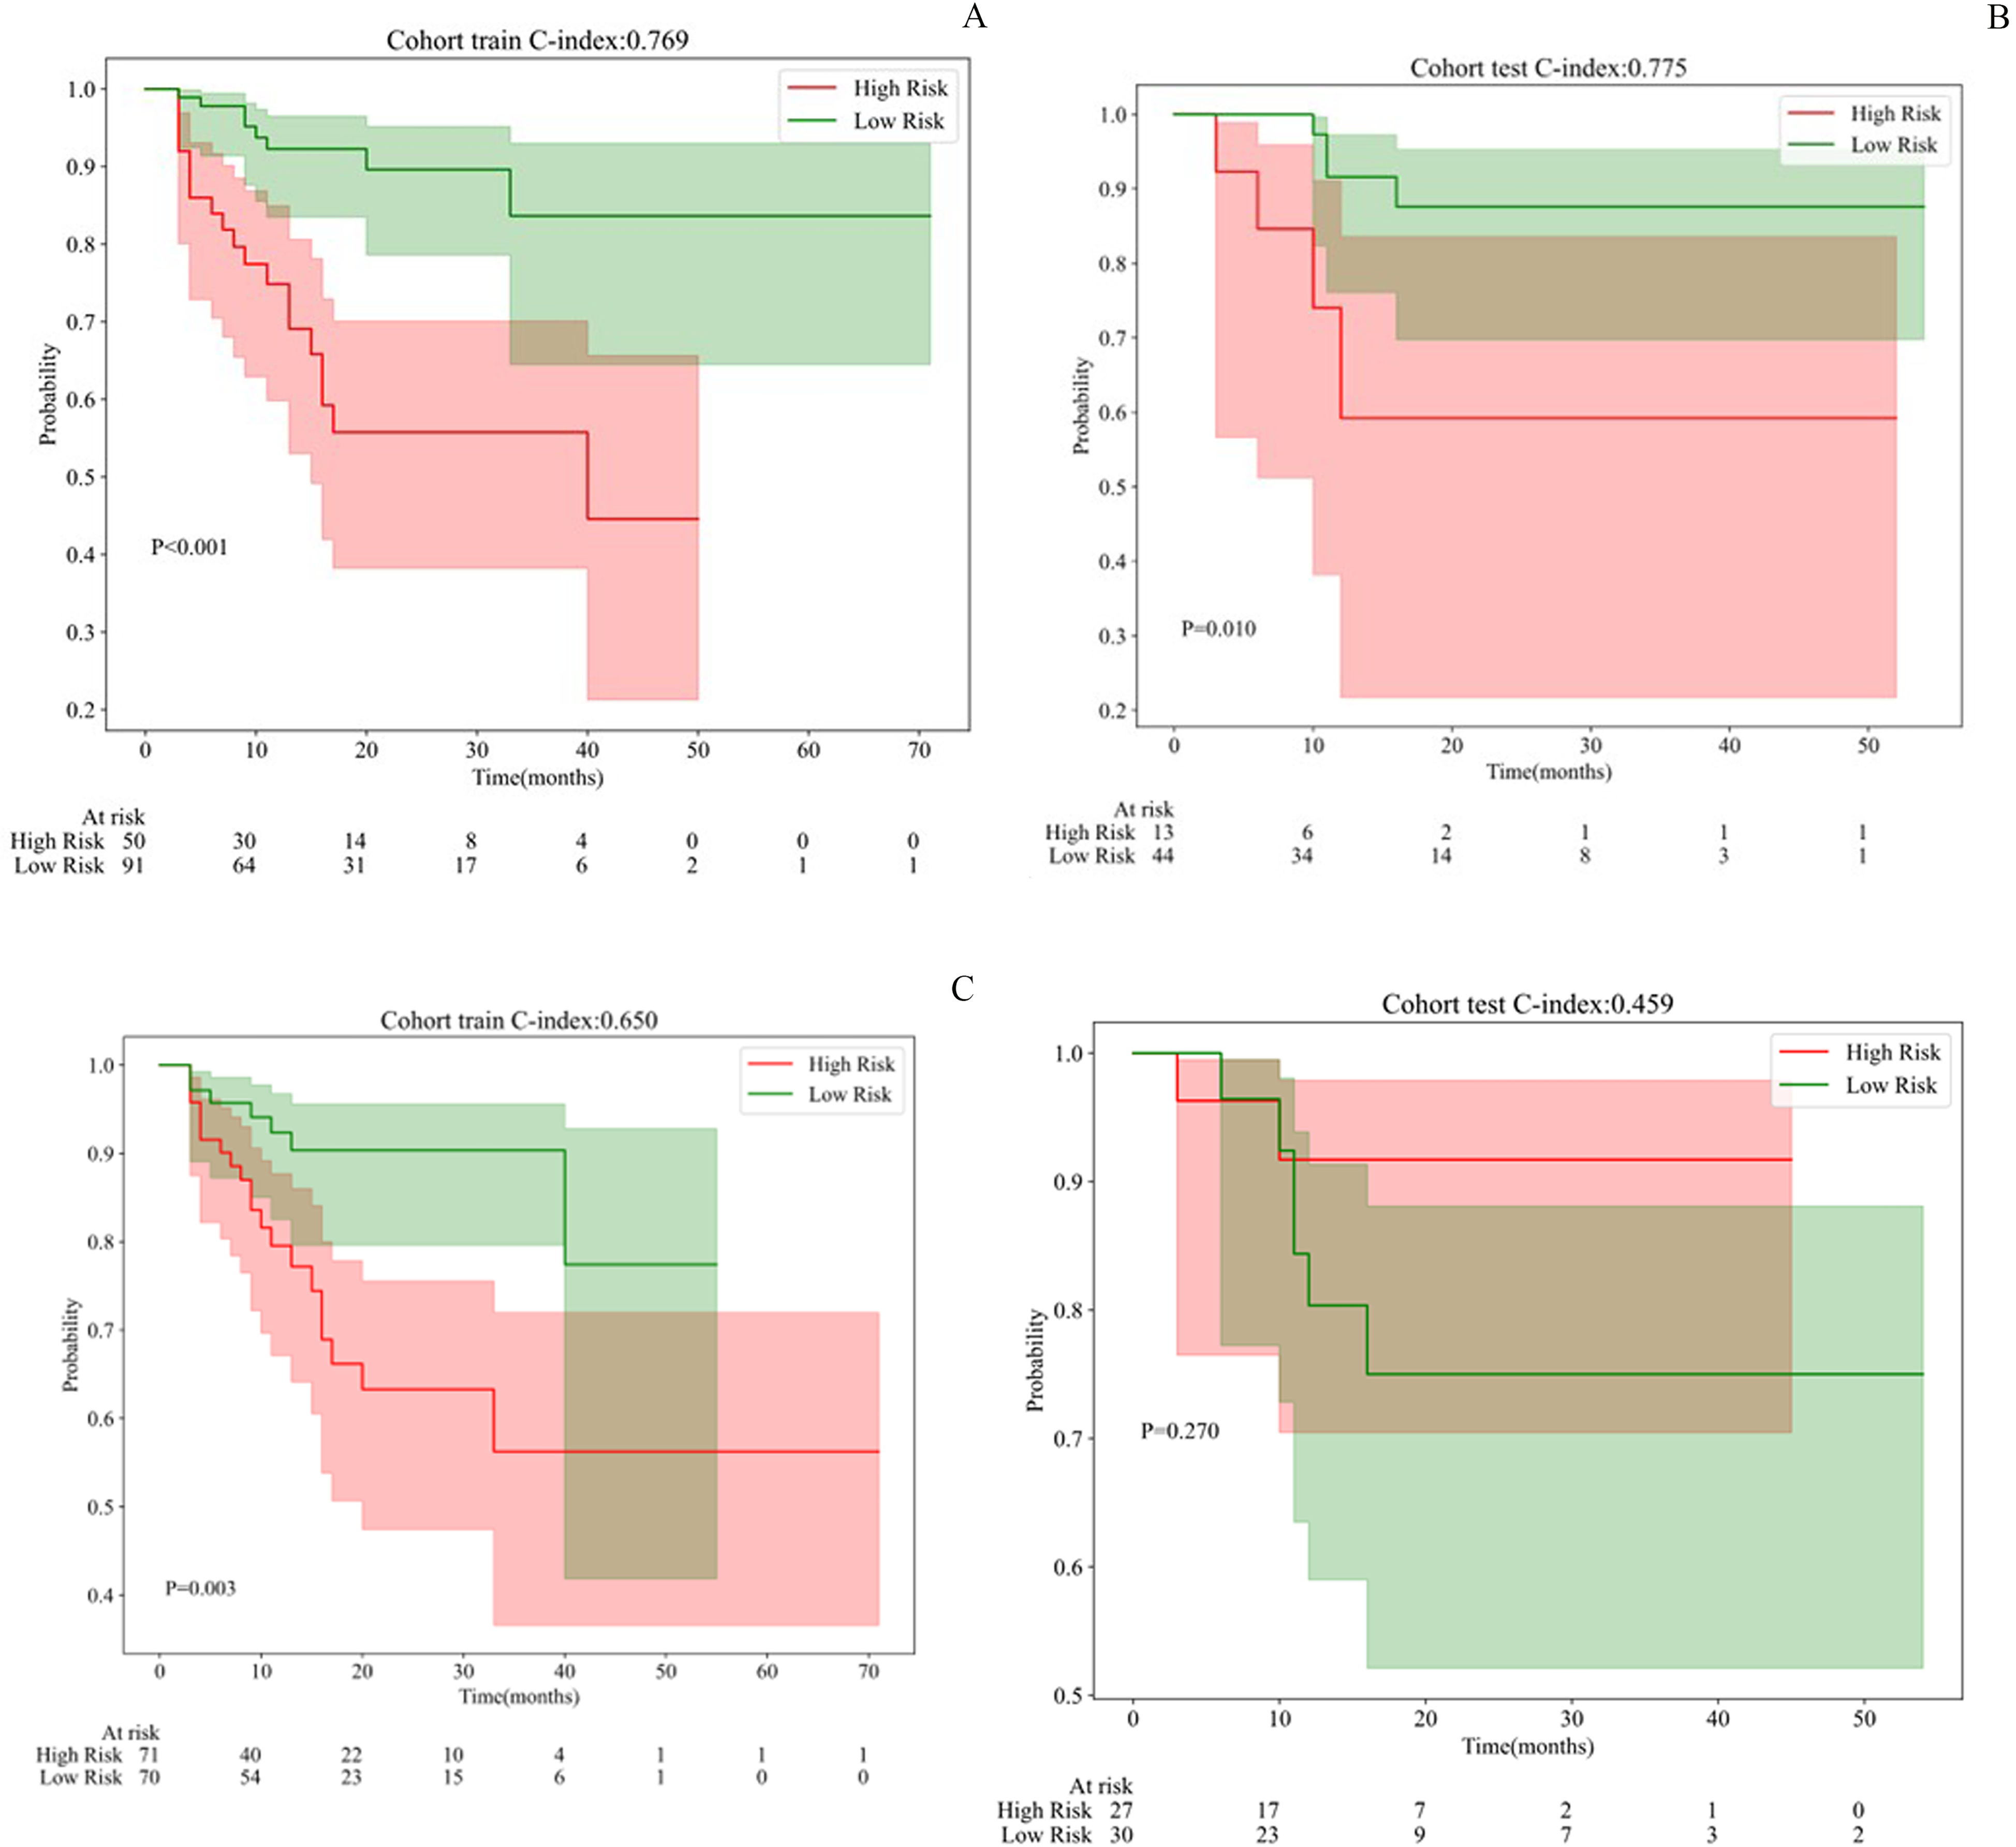
K-M Survival Analysis According to Rad-Score of Habitat-Based and Whole-Tumor Based Models: (A): Survival Comparison Between Habitat-Based High-Risk and low-Risk in Testing set; (B): Survival Comparison Between Habitat-Based High-Risk and low-Risk in Validation set;(C) Survival Comparison Between Whole Tumor-Based High-Risk and low-Risk in Testing set; (D) Survival Comparison Between Whole Tumor-Based High-Risk and low-Risk in Validation set.
Sample Size Assessment
Our study enrolled 228 patients (159 in training, 69 in validation) for radiomics model development. Post hoc analysis revealed that while the conventional radiomics model (3 features) met sample size requirements with an Events per Variable (EPV) ratio of 22.7 (68 pCR + events/3 features), the habitat model (10 features) was underpowered with EPV = 6.8 (68/10), falling below the recommended threshold of EPV ≥ 10. Sensitivity analysis showed current EPV = 6.8 may inflate AUC by 1.9-5.6% versus EPV ≥ 10 scenarios. True performance likely lies between 0.78-0.81. As a result, the model maintained discrimination (AUC > 0.75) until event count dropped below 34 (50% of observed), confirming robustness within current constraints. This suggests reported findings are biologically plausible, though validation in EPV ≥ 10 cohorts remained essential.
Discussion
Esophageal cancer is a common malignancy of the digestive tract. Due to the insidious onset of esophageal cancer, patients are commonly presented with an advanced stage by the time of diagnosis. Currently, the combined treatment regimen of neoadjuvant chemoradiotherapy followed by surgery is the recommended treatment approach for locally advanced ESCC patients. Approximately 40% of ESCC patients achieved pathological complete response after nCRT, while radical surgery is associated with a high incidence of complications.4,23 Additionally, the alterations in the gastrointestinal physiological structure significantly impacted the patient's quality of life. 7 As a result, Noordman BJ et al firstly proposed an organ-preserving strategy: for patients who achieve clinical complete response (cCR) after neoadjuvant chemoradiotherapy, active surveillance may lead to survival outcomes that are not inferior to those of standard esophageal cancer radical surgery, while also improving quality of life and reducing treatment costs. 8 As a result, accurately assessing the clinical complete response (cCR) after nCRT is an urgent need for individualized watch-and-wait strategy for locally advanced ESCC.
Previous research has developed radiomic models to predict treatment response and prognosis in esophageal cancer, though with notable limitations. Hou et al. 12 constructed a model using 5 radiomic features from pretreatment enhanced CT scans in 49 patients, reporting AUCs of 0.686/0.727 and accuracies of 0.891/0.972. Yang et al 15 developed three CT-based logistic regression models for pCR prediction in 55 ESCC patients, achieving training AUCs of 0.84-0.86 and testing AUCs of 0.71-0.79. Fan L. et al 24 developed a nomogram model using CT-based delta-radiomics features and clinical factors showed a good classification performance in the training dataset (AUCαbin = 0.933 and AUCemp = 0.941) and in the validation set (AUCs of 0.958 and 0.962). More recently, Luo et al 25 proposed a radiomic signature (Rad-score) with training AUC = 0.812 (95% CI: 0.742-0.869; P < .001) and validation AUC = 0.744 (95% CI: 0.632-0.851; P = .003) across 226 ESCC patients. However, this study had critical limitations: heterogeneous nCRT regimens and reliance on barium esophagogram (rather than pathological assessment) for treatment response evaluation, precluding external validation. While conventional and deep-learning radiomics demonstrate predictive potential, their whole-tumor approaches fail to characterize spatial tumor heterogeneity. Habitat-based radiomics 26 addresses this gap by quantifying heterogeneity more reflective of tumor aggressiveness. Supporting this, Xie et al 27 pioneered sub-regional radiomics for survival prediction in definitively treated esophageal cancer (training AUC = 0.811, 95% CI: 0.670-0.952; validation AUC = 0.805, 95% CI: 0.638-0.973). Nevertheless, the utility of sub-regional radiomics for predicting post-nCRT/surgical response remains unexplored. Understanding tumor spatial heterogeneity is thus critical for developing effective treatments. Patients ineligible for surgery cannot undergo tumor resection for pathological heterogeneity assessment. Artificial Intelligence radiomics addresses this by quantifying imaging data to extract accurate, objective biomarkers. Tumor subregional analysis better captures spatial heterogeneity and reflects true tumor characteristics.
To our knowledge, this represents the largest radiomics study derived from a prospective database where all ESCC patients received uniform neoadjuvant therapy: radiotherapy (41.4Gy/23Fx) with concurrent paclitaxel/nab-paclitaxel and carboplatin. We sought to analyze tumor microstructure using imaging and investigate the spatial manifestations of tumor heterogeneity. Furthermore, we introduced a habitat model to analyze internal tumor heterogeneity for predicting pCR in ESCC patients undergoing nCRT. Leveraging intra-tumoral heterogeneity features, we developed a precision model for pathological complete response (pCR) prediction in 228 patients. K-means clustering identified three spatially distinct tumor habitats, underscoring the value of habitat-based analysis in capturing ESCC heterogeneity. These sub-regions reflected distinct tumor biological behaviors. Our ten-feature pCR model incorporated eight wavelet-derived radiomics features, confirming wavelet decomposition's critical role in radiomic analysis. Consistent with prior research.27,28 these features quantified multi-scale heterogeneity linked to ESCC prognosis. Among three machine learning algorithms, Random Forest (RF) outperformed others in both habitat-derived and whole-tumor models. The radiomics-based RF model achieved exceptional discrimination: training AUC = 0.864 (95%CI:0.808-0.920) and validation AUC = 0.826 (0.732-0.920) – surpassing previous benchmarks. This enhanced performance likely stems from our cohort's unique treatment homogeneity: standardized nCRT followed by surgery and protocolized follow-up minimized treatment-related outcome variability.
While this study did not identify significant clinical predictors of pathological complete response (pCR) following neoadjuvant chemoradiotherapy (nCRT), we determined that tumor length and body mass index (BMI) were independent clinical predictors of progression-free survival (PFS) in esophageal squamous cell carcinoma (ESCC) patients. This finding contrasts with existing literature: Xu et al 29 identified diabetes, tumor volume, tumor length, tumor location, clinical stage (TNM), and radiotherapy response as significant prognostic factors for ESCC survival. Lee et al 30 reported an association between low BMI and poor radiotherapy outcomes in ESCC. Furthermore, Chen et al 31 in a cohort of 1340 ESCC patients receiving immune checkpoint inhibitors, found pretreatment levels of hemoglobin (Hb), BMI, albumin (ALB), prognostic nutritional index (PNI), prealbumin (PAB), and transferrin (TRF) correlated with survival. These discrepancies highlight the ongoing controversy surrounding clinical predictors of survival outcomes in ESCC, underscoring the need for non-invasive predictive methods. Consequently, we developed four predictive models: a clinical model, a 12-feature habitat-based PFS model, a 7-feature whole-tumor radiomics model, and a combined clinical-radiomics model. Our results demonstrated that the habitat-based model achieved the most promising performance in the validation set (AUC = 0.81, 95% CI: 0.653-0.966), outperforming the other three models. Subsequent verification confirmed that the radiomics score (Rad-score) from the habitat-based model effectively stratified patients into high-risk and low-risk groups in both the training and test sets. The PFS habitat model, constructed using subregional radiomics features, plays a crucial role in predicting the efficacy of nCRT for ESCC patients. This model can provide additional tumor information, and additional adjuvant treatment was recommended for ESCC with high risk according to Rad-score. However, the absence of external validation currently limits the broader applicability of this qualitative habitat-based model, necessitating further research.
A key strength of this study is its retrospective design utilizing a prospective cohort database, where all ESCC patients received a standardized nCRT (neoadjuvant chemoradiotherapy) regimen followed by esophagectomy. The established predictive model demonstrates potential for practical application and straightforward validation in other centers employing similar standardized nCRT protocols for ESCC. However, several limitations warrant consideration. First, this was a single-center retrospective analysis with a relatively small sample size. In addition, the distribution of GEJ tumors was significantly imbalanced, with the validation group having no GEJ tumors, which might be a potential cause of heterogeneity. Second, the analysis lacks external validation. Consequently, future external validation studies from other institutions, incorporating larger cohorts and standardized nCRT regimens, are strongly recommended. Third, the radiomics features analyzed were derived exclusively from enhanced CT images; plain CT images were not evaluated. Fourth, according to the pmsampsize package calculations, the habitat model would require 233 training samples to achieve adequate power (EPV ≥ 10) given the observed pCR + rate of 43%. Further large sample size was still needed to investigate the predict role of habitat model in ESCC patients. Finally, the follow-up period was short; therefore, the model's predictive value for long-term progression-free survival in this patient population requires further observation in extended studies.
Conclusion
In conclusion, this study demonstrated that habitat-based radiomics signature may provide more precise predictions for pCR and survival of resectable ESCC after standardized nCRT and surgery in comparison with other three radiomics models, which might improve precise treatment for ESCC patients. Additionally, further studies were clearly needed to be validated in external cohorts.
Supplemental Material
sj-docx-1-tct-10.1177_15330338251386930 - Supplemental material for Retrospective Analysis of CT-based Habitat Analysis for Predicting pCR and Survival of ESCC Treated by Neoadjuvant Chemoradiotherapy and Esophagectomy
Supplemental material, sj-docx-1-tct-10.1177_15330338251386930 for Retrospective Analysis of CT-based Habitat Analysis for Predicting pCR and Survival of ESCC Treated by Neoadjuvant Chemoradiotherapy and Esophagectomy by Shujun Zhang, Wei-Xiang Qi, Feng Wang, Yibin Zhang, Jiayi Chen and Shengguang Zhao in Technology in Cancer Research & Treatment
Supplemental Material
sj-docx-2-tct-10.1177_15330338251386930 - Supplemental material for Retrospective Analysis of CT-based Habitat Analysis for Predicting pCR and Survival of ESCC Treated by Neoadjuvant Chemoradiotherapy and Esophagectomy
Supplemental material, sj-docx-2-tct-10.1177_15330338251386930 for Retrospective Analysis of CT-based Habitat Analysis for Predicting pCR and Survival of ESCC Treated by Neoadjuvant Chemoradiotherapy and Esophagectomy by Shujun Zhang, Wei-Xiang Qi, Feng Wang, Yibin Zhang, Jiayi Chen and Shengguang Zhao in Technology in Cancer Research & Treatment
Supplemental Material
sj-docx-3-tct-10.1177_15330338251386930 - Supplemental material for Retrospective Analysis of CT-based Habitat Analysis for Predicting pCR and Survival of ESCC Treated by Neoadjuvant Chemoradiotherapy and Esophagectomy
Supplemental material, sj-docx-3-tct-10.1177_15330338251386930 for Retrospective Analysis of CT-based Habitat Analysis for Predicting pCR and Survival of ESCC Treated by Neoadjuvant Chemoradiotherapy and Esophagectomy by Shujun Zhang, Wei-Xiang Qi, Feng Wang, Yibin Zhang, Jiayi Chen and Shengguang Zhao in Technology in Cancer Research & Treatment
Footnotes
Acknowledgements
None.
Ethics Approval
This study was approved by the Ethics Committee of Ruijin hospital, Shanghai Jiao Tong University School of Medicine (approved ID: 24-210), and written informed consent was obtained from all participants. The consent was for participation in the clinical study and the use of their medical data for research purposes, as detailed in the approved informed consent form. This study was conducted according to the Declaration of Helsinki and Good Clinical Practice.
Funding
The authors disclosed receipt of the following financial support for the research, authorship, and/or publication of this article: This study was supported in part by the National Science Foundation of China (No. 82102819), Beijing Science and Technology Innovation Medical Development Foundation (grant number KC2021-JX-0170-9), Clinical Research Special Project of Shanghai Municipal Health Commission Health Industry (202340226) and Shanghai Science and Technology Innovation Action Plan Medical Innovation Research Project (23Y11904700). The funding agency plays no role in the design or execution of the study.
Declaration of Conflicting Interests
The authors declared no potential conflicts of interest with respect to the research, authorship, and/or publication of this article.
Availability of Data and Materials
The individual de-identified participant data used and/or analyzed in the current study are available from the corresponding author on reasonable request.
Supplemental material
Supplemental material for this article is available online.
References
Supplementary Material
Please find the following supplemental material available below.
For Open Access articles published under a Creative Commons License, all supplemental material carries the same license as the article it is associated with.
For non-Open Access articles published, all supplemental material carries a non-exclusive license, and permission requests for re-use of supplemental material or any part of supplemental material shall be sent directly to the copyright owner as specified in the copyright notice associated with the article.