
Abstract
Introduction
To evaluate the predictive efficacy of enhanced Computed Tomograph(CT) radiomics combined with clinical features for assessing treatment response to neoadjuvant chemotherapy plus immunotherapy in esophageal squamous cell carcinoma (ESCC) patients.
Methods
We retrospectively analyzed 189 pathologically confirmed esophageal squamous cell carcinoma patients (treated between January 2020 and October 2024) who underwent neoadjuvant chemoimmunotherapy. Patients were stratified into remission and non-remission groups based on pathological response and randomly divided into training (n = 114) and testing (n = 75) sets (6:4 ratio). Clinical predictors were identified using logistic regression to construct a clinical model. Radiomic features were extracted from manually delineated tumor regions on contrast-enhanced CT scans, and a radiomics model was developed. A combined model integrating clinical variables and radiomics probabilities was then built and presented as a nomogram. Model performance was assessed using receiver operating characteristic (ROC) curves (AUC, Area Under the Curve) comparison via Delong test), calibration curves, and decision curve analysis (DCA).
Results
Multivariable analysis identified treatment cycle number as a significant clinical predictor. Ten radiomic features were selected for the final model. In the training set, the clinical model achieved an AUC of 0.705 (95% CI 0.607-0.802), while the radiomics and combined models showed superior performance with AUCs of 0.905 (95% CI 0.843-0.967) and 0.914 (95% CI 0.857-0.970), respectively. Similar trends were observed in the testing set, where the combined model (AUC 0.859, 95% CI 0.768-0.950) outperformed both the radiomics (AUC 0.815) and clinical (AUC 0.644) models.
Conclusion
The enhanced CT radiomics model has better predictive efficacy for remission with neoadjuvant chemotherapy combined with immunotherapy in esophageal squamous cell carcinoma patients, and the combined model has greater predictive value.
Keywords
Introduction
Esophageal squamous cell carcinoma (ESCC) is one of the major malignancies of the digestive system and is characterized by strong invasiveness and high mortality rate.1,2 Early symptoms are usually asymptomatic, and most patients are already in the late stages when symptoms become apparent. For patients with locally advanced ESCC, comprehensive treatment based on surgery is the preferred therapeutic approach. 3 Compared with surgery alone, neoadjuvant chemotherapy followed by surgery can improve the prognosis of patients. Immunotherapy, as a systemic treatment, may have a synergistic effect with chemotherapy. Currently, neoadjuvant chemotherapy combined with immunotherapy is widely used in the treatment of advanced ESCC.4–6
Although neoadjuvant chemotherapy combined with immunotherapy can reduce tumor size, lower tumor staging, and improve 5-year survival rate, some patients are insensitive to treatment and suffer unnecessary harm due to toxic reactions,7,8 which is unfavorable for patient prognosis.Therefore, early prediction of the pathological remission status of ESCC patients receiving neoadjuvant chemotherapy combined with immunotherapy may help identify patients who are more likely to benefit from treatment and avoid unnecessary toxicity.
An increasing number of studies have demonstrated that Computed Tomograph(CT) has high value in predicting the response to neoadjuvant therapy, but most of these studies focus on neoadjuvant chemotherapy or neoadjuvant radiotherapy alone,9,10 and there are few studies exploring the potential of CT radiomics in predicting the response of cancer esophageal patients to neoadjuvant chemotherapy combined with immunotherapy. Moreover, the Response Evaluation Criteria for Solid Tumors (RECIST) 11 have been used to determine the efficacy of ESCC treatment in previous studies, but in recent years, studies have used pathological assessment after neoadjuvant therapy to determine its efficacy. Therefore, in this study, we extracted enhanced CT radiomics features before neoadjuvant chemotherapy combined with immunotherapy and combined them with clinical features to construct a model to evaluate its value in predicting the efficacy of neoadjuvant chemotherapy combined with immunotherapy for ESCC.
Materials and Methods
Patient Materials
A retrospective analysis was conducted on the clinical and imaging data of 189 pathologically confirmed ESCC patients from the main hospital(tertiary hospital) and from its affiliated branch(secondary hospital) between January 2020 and October 2024. The inclusion criteria were as follows: (1) all patients were pathologically confirmed to have ESCC; (2)patients received 1-4 cycles of platinum-based neoadjuvant chemotherapy combined with immunotherapy (PD-1 inhibitors, etc), with pretreatment contrast-enhanced CT scans.; (3) there was no previous history of malignant tumors; and (4) all patients did not receive any preoperative tumor-related treatment, such as radiotherapy or chemotherapy, prior to the first treatment. The exclusion criteria were as follows: (1) patients lacked clinical and imaging data; (2) patients had undergone preoperative ESCC treatment before enhanced CT examination; (3) patients had distant metastases combined with other malignant tumors; (4) patients did not undergo surgical treatment after neoadjuvant chemotherapy combined with immunotherapy; and (5) the quality of the CT images could not satisfy the analysis of the imaging histology. The tumor regression grade (TRG) was calculated using the National Comprehensive Cancer Network (NCCN) guidelines for pathological assessment criteria after neoadjuvant therapy. 12 According to the NCCN Guidelines, pathologic complete response (TRG 0) and near-complete response (TRG 1) are classified as major pathologic responses based on their established prognostic significance. Patient outcomes were classified according to the assessment of pathological remission status after surgery: the remission group had a better pathological remission response (TRG 0-1), and the non-remission group had a worse pathological remission response (TRG 2-3). This classification has been used in some trials.13,14 Patients were randomly divided into training sets and testing sets at a ratio of 6:4.
CT Image Acquisition
The scanning parameters were as follows: peak voltage of 120 kVp, automatic exposure control (CARE Dose 4D), rotation time of 0.5 s, collimator of 128 × 0.6 mm, pitch of 1.2, layer thickness of 5 mm, layer spacing of 5 mm, and a matrix of 512 × 512 mm. All subjects were placed on the examination bed in the supine position, and the body was scanned from the supraclavicular region to the lesser curvature of the stomach. The contrast agent iohexol (350 mg I/mL) was injected through the right anterior elbow vein using a high-pressure syringe at an injection rate of 3 mL/s, and the arterial and venous phases were scanned with delays of 25 s and 55 s, respectively, after the injection.
ROI Segmentation
We imported the enhanced CT images in Digital Imaging and Communications in Medicine(DICOM) format into ITK-SNAP(version 3.8.0, http://www.itksnap.org) image segmentation software and manually outlined the tumor region of interest (ROI). This was performed independently by two doctors with 10 years (Radiologist A) and 5 years (Radiologist B) of diagnostic radiology experience, and the lesions were outlined to avoid hemorrhage, necrosis and margins as much as possible. Any disagreements were discussed and agreed upon by the two radiologists.The two radiologists who delineated the lesions were blinded to all patient information prior to assessment.
Intra- and Interobserver Agreement
We randomly selected 30 patients for inter- and intraobserver agreement analysis. The lesions were outlined separately by radiologists A and B to determine interobserver agreement. After one month, radiologist A reoutlined the lesions to determine intraobserver agreement. The agreement of the ROI was assessed by calculating the intra/interclass correlation coefficient (ICC) for each feature. An ICC greater than 0.9 was considered to indicate good agreement. Radiomics features with poor reproducibility (ICC ≤ 0.9) were discarded before statistical assessment.
Radiomics Feature Extraction
The study workflow is shown in Figure 1. We used the PyRadiomics package in Python 3.11 to extract radiomic features, including shape features, first-order features, the gray level co-occurrence matrix (GLCM), the gray level run length matrix (GLRLM), the gray level size zone matrix (GLSZM), the gray level dependence matrix (GLDM), and the neighborhood gray tone difference matrix (NGTDM). High-throughput features, including log-sigma and wavelet transplantation algorithms, were obtained from filtering the image using different filtering methods. All radiomics features were separately normalized using Z score standardization to eliminate the unit limits of each feature. Independent samples t tests and Spearman correlation analysis were further used to select potentially important features. The minimum redundancy maximum relevance (mRMR) algorithm was subsequently used for optimal feature selection to derive the final features for modeling.
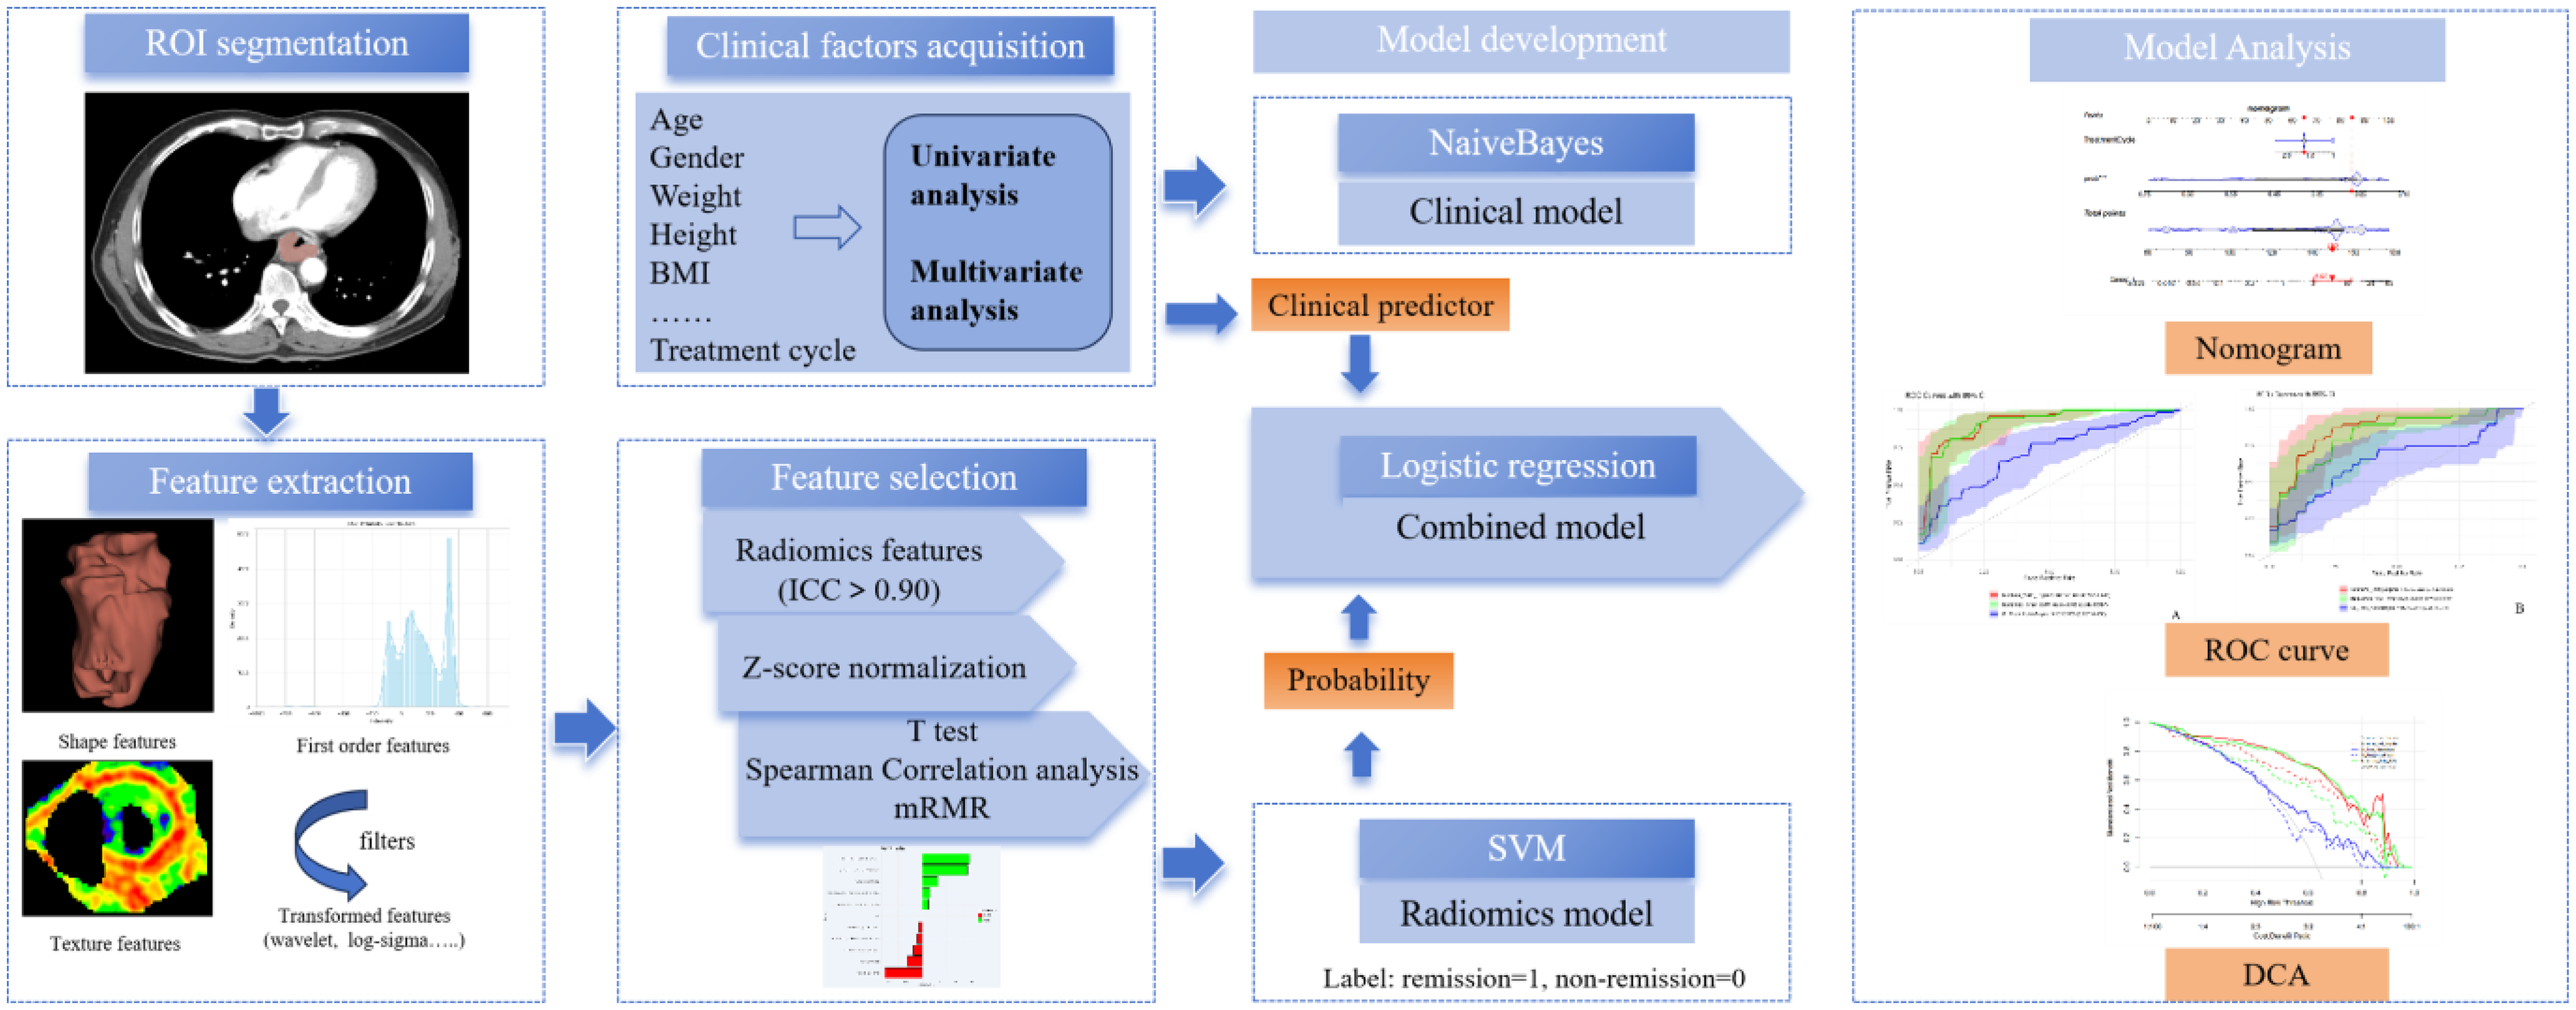
Workflow of the Study. Lable: For Model Training, Remission Cases were Labeled as 1 and Non-remission Cases as 0. The Predicted Probability Output by the SVM Model Reflects the Likelihood of Remission.
Clinical Feature Evaluation
Univariate and multivariate regression analyses were used to screen out clinical predictors, including age, sex, height, weight, body mass index(BMI), tumor location, presence or absence of invasion of the periesophageal fat space, mediastinal lymph node metastasis, tumor enhancement pattern, and number of treatment cycles. The location of the tumor, the presence or absence of invasion of the periesophageal fat space, the presence or absence of mediastinal lymph node metastases, and the pattern of tumor enhancement were determined from the independent analysis of the imaging images by Radiologists A and B, respectively.The two radiologists reached a consensus on any differences through discussion, and they were blinded to all patient information prior to assessment.
Statistical Analysis
Statistical analyses were performed using SPSS (version 22.0) and R software (version 4.3.1; https://www.posit.co/about/trademark/). All predictor variables and outcomes were checked for missing values. No missing data were identified in the final analytic cohort, as confirmed by manual validation and electronic data audits. Continuous variables were analyzed using the independent samples t test or Mann‒Whitney U test, and categorical variables were analyzed via the chi‒square test or Fisher's exact probability method. Clinical independent predictors were analyzed using univariate and multivariate logistic regression. The diagnostic efficacy of the model was evaluated using the area under the curve (AUC), accuracy, sensitivity(SEN), specificity(SPE), positive predictive value(PPV), negative predictive value(NPV), recall, and F1 score. The optimal diagnostic threshold was determined through ROC curve analysis by maximizing Youden's index (J = sensitivity + specificity−1). The calibration ability of the model was assessed using calibration curves and a Hosmer-Lemeshow test was performed. Decision curve analysis (DCA) was used to calculate the range of thresholds to evaluate the clinical application value of the model. The Delong test was used to compare the differences in AUC values between models. Differences were considered statistically significant at P < 0.05. The reporting of this study adheres to the Transparent Reporting of a multivariable prediction model for Individual Prognosis Or Diagnosis (TRIPOD) guidelines. 15
Results
Clinical Baseline
A total of 189 patients (70 in the remission group and 119 in the non-remission group) were included in this study, with 114 patients in the training set and 75 patients in the testing set. The results revealed significant differences in age and treatment cycle in the training set (P = 0.041, P = 0.013) and BMI and treatment cycle in the testing set (P = 0.016, P = 0.023), whereas there were no significant differences in the remaining clinical variables. The clinical features of the two datasets are displayed in Table 1.
Clinical Features of Training and Test Cohorts.

Radiomics Feature Selection
A total of 1218 radiomic features were extracted from all 189 ESCC images, and 10 radiomic features were ultimately retained after feature filtering, including one second-order texture feature, one first-order statistical feature after wavelet transformation, and eight texture features after log-sigma and wavelet transformation, as shown in Figure 2. The radiomic features extracted in this study comprehensively characterize tumor biology across multiple dimensions. Wavelet.HHL_firstorder_RootMeanSquared reflects overall signal intensity variations, with higher values indicating hypercellular or calcified regions and lower values suggesting necrosis. Wavelet.HLH_glszm_SmallAreaEmphasis quantifies small homogeneous zones, where high values correlate with microvascular proliferation or hypoxia. Wavelet.HHH_glcm_Imc2 measures architectural complexity, distinguishing high-grade (chaotic) from low-grade (ordered) tumors. Log.sigma.5.0.mm.3D_gldm_HighGrayLevelEmphasis identifies angiogenic or stem-cell-rich regions, while log.sigma.2.0.mm.3D_glcm_MaximumProbability reveals growth patterns (expansive vs infiltrative). Wavelet.HHL_glrlm_RunEntropy and HighGrayLevelRunEmphasis assess margin irregularity and proliferative activity, respectively. Wavelet.LHH_glcm_InverseVariance evaluates local homogeneity, disrupted by invasion or preserved in fibrosis. Original_glcm_lmc1 detects structural regularity, predictive of molecular subtypes, and wavelet.HLH_glcm_Id discriminates recurrence from radiation necrosis.16–20

The Radiomics Features Retained after Feature Selection.
Model Construction
When univariate regression analyses were performed, age and the number of treatment cycles were considered predictors (P = 0.006 and 0.038, respectively), and multivariate regression analyses revealed that the number of treatment cycles (odds ratio(OR) = 0.333, 95% CI: 0.147-0.754, P = 0.008) was an independent clinical predictor and was used to construct the clinical model. Based on the final 10 radiomic features, a support vector machine (SVM) was used to construct the radiomics model. For model training, remission cases were labeled as 1 and non-remission cases as 0. The predicted probability output by the SVM model reflects the likelihood of remission.The number of treatment cycles was included as a clinical feature and combined with the output probabilities from the radiomics model. A multivariate logistic regression analysis was performed to construct a combined model, which was subsequently visualized as a nomogram to provide an intuitive representation of the predictive outcomes, as shown in Figure 3. This study employed various machine learning algorithms including Support Vector Machine (SVM), Logistic Regression (LR), Random Forest (RF), XGBoost, Decision Tree (DT), Naïve Bayes (NB), and LASSO to develop predictive models. Systematic comparison revealed that while complex algorithms such as RF and XGBoost demonstrated good performance on training datasets, they exhibited significant overfitting on independent validation sets. In contrast, simpler algorithms including DT, NB and LASSO showed suboptimal overall predictive performance due to their inherent model limitations.After comprehensive consideration of model stability and predictive efficacy, SVM was ultimately selected for constructing the radiomics model due to its superior capability in processing high-dimensional imaging features. For the combined model, the LR algorithm was chosen primarily for its excellent interpretability and robust performance with clinical-imaging fusion features. This selection strategy effectively avoids overfitting risks while ensuring reliable predictive performance.

Nomogram Constructed with Radiomics Model Output Probabilities Combined with Treatment Cycle. prob:probability; *:statistically significant difference.
Model Validation
The diagnostic efficacies of the clinical model, the radiomics model, and the combined model are shown in Figure 4 and Table 2, respectively. In the training set, the AUC of the combined model was superior to that of the clinical model (0.914 vs 0.705, P < 0.001) and the radiomics model (0.914 vs 0.905, P = 0.683), and the AUC of the radiomics model was superior to that of the clinical model (0.905 vs 0.705, P = 0.001). In the testing set, the AUC of the combined model was also superior to that of the clinical model (0.859 vs 0.644, P = 0.003) and the radiomics model (0.859 vs 0.815, P = 0.034), and the AUC of the radiomics model was also superior to that of the clinical model (0.815 vs 0.644, P = 0.041). In the training and testing sets, the accuracy, SEN, SPE, PPV, precision, NPV, recall, and F1 score of the combined model and the radiomics model were better than those of the clinical model. In the training set, the accuracy, SEN, NPV, recall, and F1 score of the combined model were better than those of the radiomics model. In the testing set, the combined model had better accuracy, SPE, PPV, NPV, precision, and F1 score than did the radiomics model, and both had comparable SEN and recall values. The combined model had the best accuracy, NPV, and F1 score in both the training and testing sets.The Youden index analysis revealed significant differences in model performance. In the training set, the combined model (J = 0.696) and radiomics model (J = 0.689) substantially outperformed the clinical model (J = 0.349). This advantage persisted in the validation set, though with expected attenuation: combined model (J = 0.622) > radiomics (J = 0.551) > clinical (J = 0.303). The consistent superiority of the combined model across both sets suggests effective feature integration.

ROC Curves of Clinical Model, Radiomics Model, and Combined Model in the Training (A) and Testing Sets (B).
Predictive Performance of Different Models.

Note: AUC:Area under curve; CI: Confidence interval; SEN:sensitivity; SPE: specificity; PPV: Positive predictive value; NPV: Negative predictive value.
Model Evaluation
The calibration curves are shown in Figure 5. We performed the Hosmer-Lemeshow test, with results showing that in the training set: the clinical model had χ2 = 5.313, df = 8, p = 0.724, the radiomics model χ2 = 17.659, df = 8, p = 0.024, and the combined model χ2 = 16.883, df = 8, p = 0.031. In the validation set: the clinical model showed χ2 = 14.370, df = 8, p = 0.073, the radiomics model χ2 = 14.778, df = 8, p = 0.064, and the combined model χ2 = 7.113, df = 8, p = 0.525. The Hosmer-Lemeshow test showed the clinical model had good training-set calibration, while radiomics and combined models showed initial miscalibration. Notably, the combined model achieved superior validation-set calibration, demonstrating that clinical-radiomic integration provides more reliable predictions despite training challenges. While promising, its performance may vary across populations, requiring further validation. The DCA curve results revealed greater net clinical gains for the combined model in both the training and testing sets over most of the high-risk threshold range, as shown in Figure 6.
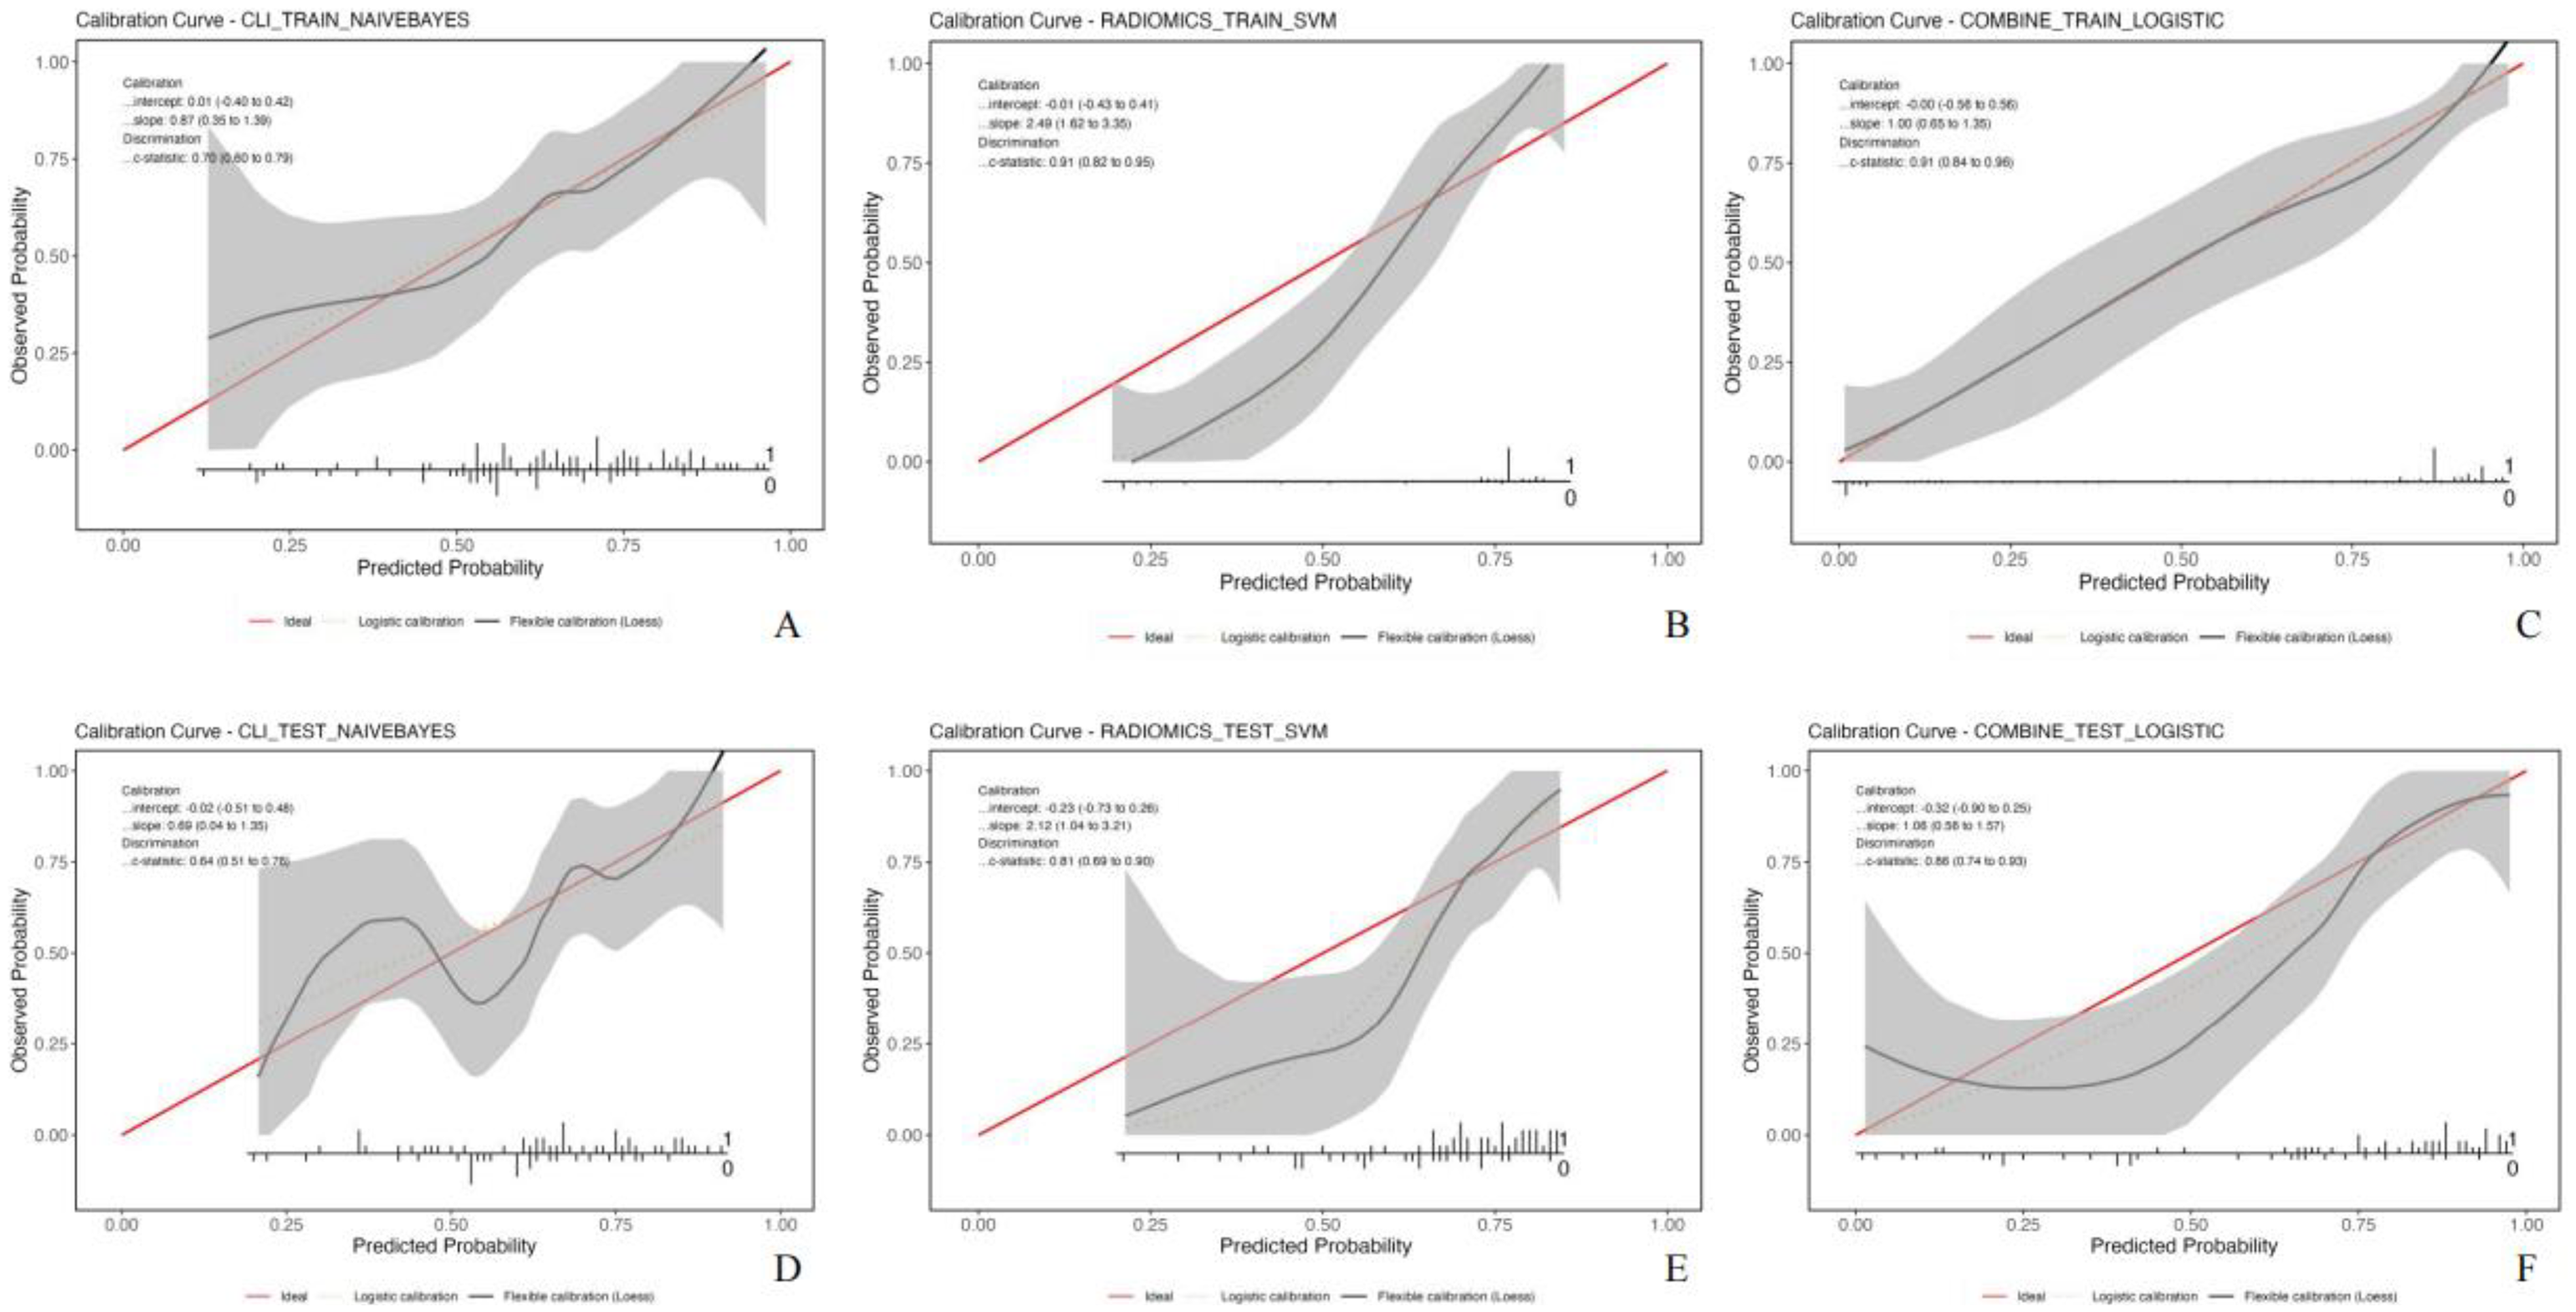
Calibration Curves of Clinical Model, Radiomics Model, and Combined Model in the Training (A-C) and Testing sets (D-F).

Decision Curve Analysis of Clinical Model, Radiomics Model, and Combined Model in the Training and Testing Sets.
Discussion
Esophageal squamous cell carcinoma is usually neglected in the early stages, and most patients are diagnosed with ESCC when they are already in the advanced stages of the disease. Surgical treatment alone and chemotherapy alone have high recurrence and metastasis rates. Studies4,21,22 have shown that neoadjuvant chemotherapy combined with immunotherapy has good efficacy and safety. This treatment strategy showed higher pathological complete remission (PCR) rates, and patients who obtained PCR had a good prognosis. As a result, the development of predictive models for pathological remission states could help develop more personalized treatment plans. Radiomics is superior to traditional imaging techniques in predicting tumor response and prognosis, and has a wide range of application prospects.
In the existing clinical studies of neoadjuvant chemotherapy combined with immunotherapy, 2-4 cycles of treatment are generally used, with 2 cycles as the main treatment. Compared with 2 cycles of treatment, the effect of 3-4 cycles of treatment results in better tumor downstaging.23–25 However, few studies have included the number of treatment cycles as candidate clinical predictors, which was intentionally included in this study. The results of this study showed that there were significant differences in age, number of treatment cycles in training set, BMI and number of treatment cycles in test set between the remission group and the non-remission group receiving neoadjuvant chemotherapy combined with immunotherapy for ESCC, while there were no statistically significant differences in other clinical characteristics. Multivariate regression analysis found that the number of treatment cycles was an independent clinical predictor, similar to the findings of Lv et al. 26 However, Cai et al 27 reported that increasing the number of treatment cycles did not lead to greater benefits. The optimal number of cycles of neoadjuvant chemotherapy combined with immunotherapy has not yet been determined, and clinicians need to consider various factors comprehensively to select the appropriate number of cycles.
In this study, we ultimately obtained 10 radiomic features from 1218 candidate radiomic features based on CT-enhanced images, mainly reflecting pixel and grayscale differences. The results showed that the radiomic features could reflect the heterogeneity of the tumor, with high tumor heterogeneity, poor treatment response and poor prognosis, which further validated the radiomic features as imaging markers for predicting the response of patients with ESCC to neoadjuvant chemotherapy combined with immunotherapy. Zheng et al 28 reported statistically differences between first-order mean and second-order features (glcm, gldm and glszm), similar to the present study. In this study, we found that the radiomics model had good predictive performance for remission of neoadjuvant chemotherapy combined with immunotherapy in the training set and the test set, with AUC of 0.905 and 0.815, respectively. Kasai et al 29 reported that the AUC values of the CT-based radiomics model in the training set and the test set were 0.990 and 0.920, respectively. Liu et al 30 reported that the AUC values of the MRI-based radiomics model in the training set and the test set were 0.968 and 0.885, respectively. Although few studies have the efficacy of neoadjuvant chemotherapy in combination with immunotherapy for ESCC using radiomics, both studies showed high efficacy of the radiomic model.The results of the present study were similar to the results of these studies.
Many studies have proposed the combination of clinical features to further improve the predictive efficacy of radiomics models and have achieved good expected results. Liu et al 9 combined MR radiomics features and dynamic hematological factors to improve the predictive efficacy of the combined model. Qi et al 31 reported that the combined model was superior to the separate model in predicting pathological complete response after neoadjuvant chemoimmunotherapy in patients with ESCC. Other studies, such as Gong et al, Li et al, Tang et al, and Yang et al,32–35 have shown that the combined model can improve the predictive efficacy. The results of this study showed that the combined model that combines CT-enhanced radiomics with treatment cycles was more effective than a radiomic model alone and a clinical model alone in predicting the response of patients with ESCC to neoadjuvant chemotherapy combined with immunotherapy. The AUC values of the combined model in the training and testing sets were 0.914 and 0.859, respectively, which were consistent with the above research results. According to the analysis, the single radiomics model has limitations in characterizing the internal characteristics of the tumor from a single perspective, while the combined model takes advantage of the clinical characteristics to reflect the heterogeneity of the tumor more comprehensively, thus improving the accuracy of prediction.The calibration curves (Figure 5E-F) revealed that both the radiomics model and the combined model systematically overestimated remission probabilities, particularly in the mid-to-high probability range. This miscalibration likely stems, in part, from limitations inherent to the current study, including its modest sample size and uneven event distribution, increasing susceptibility to overfitting and overconfident predictions. To enhance the reliability of predicted probabilities for clinical use, future work will explore calibration methods such as Platt scaling or isotonic regression, alongside efforts to incorporate larger, more diverse multicenter datasets to refine model calibration and overall clinical applicability. Although the combined model performs well overall, its net benefit slightly declines in the high-risk threshold range (0.6-0.8) (Figure 6), indicating room for improvement in this clinically critical region. Future work may explore strategies such as threshold adjustment, cost-sensitive modeling, region-specific optimization or ensemble-based to enhance the model's applicability in high-risk scenarios.
Although our enhanced CT radiomics model combined with treatment cycles effectively predicted response to neoadjuvant chemoimmunotherapy, it is noteworthy that the majority of patients (72/114 in training set, 47/75 in testing set) were classified as non-responders. For these patients, personalized therapeutic adjustments could be considered, such as switching immune checkpoint inhibitor types, combining anti-angiogenic targeted agents to modulate the tumor microenvironment, or adopting dose-intensive chemotherapy regimens. For locally advanced cases, incorporating neoadjuvant radiotherapy may enhance immunotherapy efficacy by promoting tumor antigen release. Furthermore, these patients could be prioritized for clinical trials exploring dual immunotherapy or chimeric antigen receptor T-cell(CAR-T) cell therapy. Future studies should investigate correlations between radiomic features and specific resistance mechanisms to guide precise therapeutic selection.21,23,24,30,36
The combined model offers novel insights for clinical decision-making post-neoadjuvant therapy. While radiomics demonstrates superior predictive value for pathological response, the feasibility of deferring surgery in radiologic responders remains debatable. Although recent some trials 23 reported favorable outcomes in pathological complete responders, Zheng et al 28 identified residual disease in 15% of radiologic responders, consistent with the 12% recurrence rate in PCR patients reported by Okamura et al 22 Most notably, the long-term oncologic outcomes (particularly 5-year overall survival) of active surveillance strategies demand rigorous verification, with special emphasis on immunochemotherapy-treated populations.Therefore, surgery persists as the standard of care.Future investigational efforts should focus on developing risk-adapted management protocols—for instance, incorporating combined-model risk stratification and serial endoscopic surveillance—to identify optimal candidates for potential organ-preservation approaches.
In our study, we focused on pre-treatment data to replicate the real-world clinical scenario where treatment decisions must be made before starting neoadjuvant therapy. Although we had access to post-surgical pathology results, pre-treatment clinical and imaging features better reflect the tumor's original biological characteristics, which are more valuable for predicting treatment sensitivity. This approach also aligns with NCCN guidelines.
This study has several limitations: 1. The sample size of patients in this study was relatively small, and there may be potential selection bias, which is a common problem faced by most radiomics-related studies.36–40 Future research should aim to expand the sample size to mitigate this limitation. 2. As a single-center retrospective analysis, this study lacks external validation in independent cohorts, which may affect the generalizability of the model for clinical application. In future work, we plan to conduct multicenter prospective studies in collaboration with three major medical centers in China to establish independent validation cohorts, which will allow us to further evaluate the predictive performance and stability of the model in broader populations, thereby providing more reliable evidence for clinical translation. 3. In this study, the regions of interest were manually delineated, which introduced subjectivity and generated high time costs. Most importantly, the current radiomics workflow (including post-processing and offline feature extraction) cannot support real-time clinical application. 4. The number of clinical features included in this study was limited. Further research is needed on broader clinical features and the relationship between radiomic features and responses to neoadjuvant chemotherapy combined with immunotherapy. 5. While our exclusive focus on esophageal squamous cell carcinoma (SCC) reflects the predominant histology in endemic regions, it necessarily limits the generalizability of our findings to esophageal adenocarcinoma. This histological restriction was methodologically intentional to control for tumor biology confounders, but future multicenter studies should validate these radiomic signatures in mixed-histology cohorts, particularly in Western populations where adenocarcinoma prevalence is higher. Nevertheless, the homogeneous SCC population strengthens the internal validity for this specific subtype, which remains the global majority of ESCC cases.
Conclusions
In summary, the enhanced CT-based radiomic model has a strong predictive efficacy in evaluating the response of patients with ESCC to neoadjuvant chemotherapy combined with immunotherapy. Furthermore, the combined model, which integrates clinical features (treatment cycle) with radiomic features, exhibited the highest diagnostic performance, indicating superior predictive value. This comprehensive approach provides a more comprehensive assessment, highlighting its potential as a valuable tool for predicting treatment outcomes.
Footnotes
Acknowledgments
We would like to thank the Beijing Medical Award Foundation that financially support our current research. We sincerely thank all participating patients and collaborating institutions for their contributions to this study. We also gratefully acknowledge the technical support from our radiology and pathology departments.
Ethical Considerations and Consent to Participate
This study was approved by the Ethics Management Committee of the Affiliated Huaian No.1 People's Hospital of Nanjing Medical University (No. KY-2022-045-01), with an exemption from obtaining informed consent.
Funding
The authors disclosed receipt of the following financial support for the research, authorship, and/or publication of this article: This work was supported by the Beijing Medical Award Foundation [grant number YXJL-2023-0866-0341].
Declaration of Conflicting Interests
The authors declared no potential conflicts of interest with respect to the research, authorship, and/or publication of this article.