
Abstract
Objectives
Irreversible Electroporation (IRE) is both open surgery and minimally invasive cancer therapy used in the treatment of liver tumors. The therapy demands precision and accuracy to ensure complete tumor ablation. Reliable simulation tools can help achieve this goal by predicting the tissue regions that will reach the required electric field threshold and by suggesting correcting actions when the predicted outcome is inadequate. This article retrospectively compares segmented ablations from intra-procedural computed tomography (CT) scans with computer simulations to check their validity in predicting the operation outcome and the required electric field threshold.
Methods
10 patient ablation procedures were retrospectively analyzed using a detailed computational model of electroporation, informed by the patient-specific geometry of each case. CT scans were analyzed by three physicians over two sessions to assess intra- and inter-observer variability. Same day postoperative images were used for accuracy. The resulting measured ablations from the patient's data were compared to simulation predictions, both in terms of ablated volumes and 3D similarity scores (Dice coefficient).
Results
Simulated ablation volumes were computed across electric field thresholds (465-750 V/cm), showing highest volumes at 465 V/cm and lowest at 750 V/cm. Comparison with physician segmented volumes showed best match for 500-600 V/cm ablation threshold: this result was consistent across different patients despite differences among patient's conditions and characteristics. 3D analysis revealed Dice scores between 0.63 and 0.77 (mean: 0.71), indicating moderate to good agreement. Visual and statistical comparisons further validated the reliability of the simulation model within this threshold range.
Conclusion
This study highlighted the accuracy of IRE ablation volume predictions by comparing retrospective CT based ablation volume segmentations with electric field simulations. The best match occurred at 500 to 600 V/cm thresholds, with post-procedure measurements. Despite observer variability and modeling limitations, Dice scores showed moderate to good agreement, validating the simulation model and emphasizing timely imaging for accuracy.
Introduction
Irreversible electroporation (IRE) is a medical technique that uses short bursts of high-voltage electrical energy to create permanent and transient nanopores in cell membranes. 1 Unlike traditional methods like heat based treatments, IRE doesn't rely on temperature to destroy targeted cells. 2 Thus, it allows precise cell death without causing extensive collateral damage to the surrounding healthy tissues. 3 This makes it a promising option for the treatment of lesions in sensitive or anatomically hard to reach areas, where traditional therapies reach their limits. 4 The non-thermal nature of irreversible electroporation and its ability to preserve important structures makes it an intriguing and evolving avenue in the realm of cancer treatment and other medical applications.5,6
During an IRE procedure, specialized equipment, like AngioDynamics NanoKnife® (Latham, New York), is employed to deliver precisely controlled electrical pulses through multiple needles inserted directly into the tumor site. 5 The number of used needles depends on the size and location of the tumor, typically ranging from two to six needles. 7 These needles are placed with the help of imaging techniques such as ultrasound or computed tomography (CT) scan. The size of the tumor being treated varies, but IRE is particularly effective for tumors up to 5 centimeters in diameter. 8 Treatment duration can vary depending on factors such as tumor size and location, but typically ranges from one to several hours for the whole IRE procedure. Throughout the procedure, the patient is usually under local or general anesthesia to minimize discomfort and ensure precise placement of the needles unaffected by respiratory variations.
The goal of IRE is to completely ablate solid tumors 9 covering the whole tumor 10 alongside any microscopic tumor extensions or satellite lesions that may present in the surrounding tissue. 11 To achieve this effect a sufficient electric field should be induced in the vicinity of the tumor. The anticipated threshold for IRE in hepatic tumors ranges from 600 to 800 V/cm.5,12 Newer findings present thresholds between 500 to 700 V/cm,13,14 although the difference is not great in the newer findings but this will affect the outcome if the simulations. These thresholds depend on the quantity and duration of pulses delivered also the targeted tissue influences the threshold. A greater number of pulses or prolonged durations can result in a reduced need for electric field intensity to achieve the intended outcome.13,15
Clinical practitioners also intentionally create a larger ablation zone than the tumor itself. This strategy is known as safety margin where clinical practitioners seek to increase the likelihood of eliminating all cancerous cells and reducing the risk of tumor recurrence. A safety margin is considered to be between 5-10 mm, 16 depending on various factors, including the tumor type, size, location, and proximity to critical structures.
Although in some cases IRE is a minimally invasive procedure, it comes with its own set of challenges like any medical procedure, such as anatomic accessibility of the tumor, which may pose challenges for accurate electrode placement. Electrode placement is a challenge on its own since the precise placement of multiple electrodes is crucial for the success of IRE to ensure complete encompassing while avoiding tumor puncturing. 17 Real time monitoring of the procedure is also one of the time consuming challenges that clinical practitioners face. While irreversible electroporation is considered as safe procedure, the complications include bile duct stenosis, damage to nearby structures or infection. 18 Identifying suitable candidates for IRE is crucial for the treatments success, individual patient factors such as the patient's comorbidities and the estimated outcome. These challenges requires a multidisciplinary approach involving oncologists, interventional radiologists, and other specialists to ensure the safe and effective delivery of irreversible electroporation for cancer treatment.
Treatment planning is one of the crucial steps in IRE, 5 that involves assessing the size, location, and characteristic of the tumor to determine the optimal parameters for IRE. A prerequisite step for treatment planning is computer aided simulations to predict the outcome of irreversible electroporation by modeling the electric field distribution. 19 Prediction can be used to optimize the treatment parameters such as pulse duration, voltage, and frequency to achieve complete and total tumor ablation, while minimizing damage to surrounding healthy tissue. 20 Also, simulation can help during the procedure if they are fast enough for real-time recommendations. As for risk assessment, simulations can also help predict potential complications associated with the IRE procedure, such as tissue overheating21,22 or damage of nearby critical structures. This information helps clinicians to take preventive measures or adjust treatment parameters to lower these risks. These predictions lead to understanding the outcomes of IRE and can help in communicating effectively with patients, informing them about potential benefits and risks of the procedure. Predicting the outcome of irreversible electroporation through simulations has an important role in enhancing the safety, efficacy, and precision of the procedure, as a result improving patient care and treatment outcomes. However, all the benefits of simulation are only valid if the simulations themselves are accurate and reliable.
The objective of this retrospective study is to investigate and compare the ablation volumes derived from retrospective patient data obtained from the hospital archive for IRE procedures with those predicted by computer simulations using the finite element method (FEM). First the ablation volumes captured on the same day of the intervention through CT scans and were measured. Then all the patient specific information required to build the computational model was collected, eg, the patient-specific tissue geometry (in CT and MRI scans) and electrode locations, the electrodes’ geometry and characteristics, based on the AngioDynamics NanoKnife® (Latham, New York) documentation, the input voltages acquired from the operation report. The outcomes of the simulations were then compared to the reference data for a range of electric field threshold derived from literature.13,14 Furthermore, 3D ablations measured and exported using Philips Intellispace Portal v12 (Philips. The Netherlands) were compared to modeled 3D ablations obtained with the FEM model implemented in COMSOL (COMSOL Multiphysics 5.5; COMSOL AB, Stockholm, Sweden). Finally, all results were contextualized and evaluated to assess the accuracy and reliability of computer simulations in predicting the outcomes of the electroporation procedure, and to verify the applicability of literature-based IRE thresholds.
Materials and Methods
Case selection was done after a careful and extensive review of the patients who went through IRE ablation for liver tumors at the author's institution in the time frame between 2012 and 2020. After searching the data a total of 106 unfiltered IRE interventions. The following factors were taken into consideration in the selection process, a crucial one being the presence of clear and sequenced images of the procedure including pre-interventional contrast enhanced CT (CECT), alongside with follow up imaging from CT and MRI scans. Another factor was the retraction of the electrodes, all cases that had electrode replacement were excluded to simplify the model and make it more comparable with the computer model. Cases with missing data reports, including unknown input voltage and pulse length, had to be excluded. After consideration of these factors, a total of 10 cases with IRE of primary and secondary liver cancer (HCC and liver metastasis) were chosen for reconstruction. All patient data used in this study was completely anonymized therefore based on the local regulations (data privacy act NRW §17) where the research was conducted no Institutional Review Board (IRB) approval was required.
All cases underwent the same IRE procedure using the AngioDynamics NanoKnife® (Latham, New York), with a voltage range of 1000 to 3000 V. The number of electrodes used varied between 2 and 4, with electrodes operating in pairs. The electrode exposure was set between 2 to 2.5 cm, all cases are mentioned in details in the Supplemental Material. All cases followed the same screening protocol, which included pre- interventional CT scans or MRIs to visualize the tumor. Periinterventional imaging was performed during and after electrode placement, and a follow-up assessment was conducted immediately after the procedure.
Pre-interventional CT scans were visualized using PACS system and segmented using Philips portal. The segmentation was done by a Radiology Physician, where all ablation volumes alongside all the electrodes were measured and extracted as a 3D-model as shown in Figures 1-3. All segmented ablation volumes for all cases were extracted as 3D models using the Philips Intellispace Portal to allow for comparison with the simulated ablation volumes. Due to the availability of the 3D ablated volume from only physician 1, the comparison with the corresponding simulated volume at the matching electric field threshold was limited to that physician's measurements. The comparison between segmented and simulated ablation volumes was performed by voxelising both datasets using a method like that described in Patil. 23 Specifically, each 3D surface model was converted into a volumetric representation by applying a ray-tracing algorithm to identify internal voxels of a closed triangular mesh. For visualization, periinterventional images were used, as these capture the needle positions during the intervention. In contrast, post-interventional images were used for the segmentation of the ablation area, as they clearly show the extent of tissue affected following the procedure.

(A) Coronal View of the Liver with Inserted Electrodes, (B) Sagittal View of the Ablated Region (Hypodense Area Between the Needles), (C) Axial View of the Liver with Inserted Electrodes. Case 6.

(A) Axial View of the 3D Ablation Volume, (B) Coronal View of the 3D Ablation Volume. Case 7.

(A) 3D Visualization of the Electrodes Inside of the Body Taken from Philips Intel Space, (B) 3D Exported Model of the Needles, C. Reconstructed Electrodes. Case 6.
The ablation volumes were individually measured twice for each case. The measurements were done by three different physician's to assess intra- and inter-observer accuracy and reproducibility. To remove any bias towards the measurements the physicians were contacted separately and all data was anonymized.
All needles were reconstructed using computer-aided design software (SolidWorks 2019), aligning the tip of each reconstructed electrode with the exported 3D model derived from the segmented images, while preserving both the orientation and the inter-electrode distances as reported in the operative report. Needle numbering was determined by the physician, with electrode counting performed in the sagittal view. Each electrode pair was defined based on the AngioDynamics NanoKnife® (Latham, New York) documentation, which also provided additional parameters such as the active electrode area and input voltage.
The procedure for the reconstruction of the electrodes is illustrated in Figure 3.
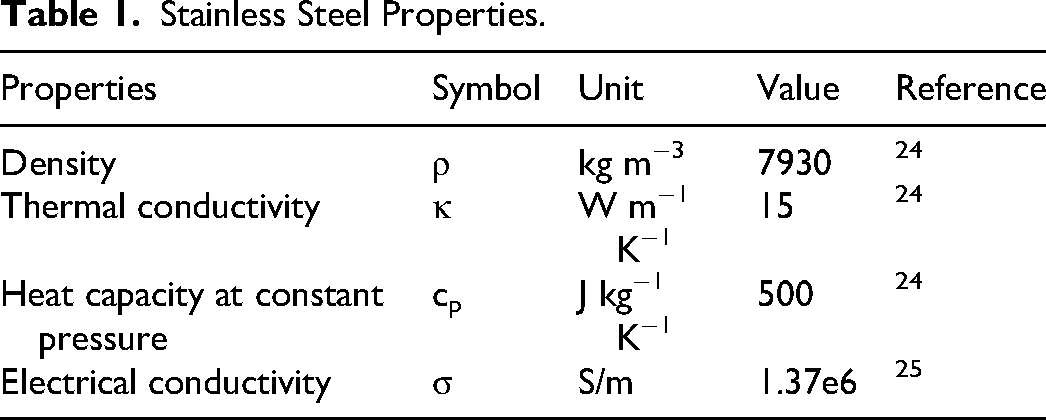
The 3D model was imported into (COMSOL Multiphysics 6.2; COMSOL AB, Stockholm, Sweden) where the simulations were performed. The electrode consisted of two materials, stainless steel and Polyvinyl chloride (PVC) insulation. The properties of the metal part are shown in Table 1.
Stainless Steel Properties.
Insulation was included as PVC having the following properties, as seen in Table 2.
Polyvinyl Chloride Properties.

In this study, we focused solely on the total ablation, since in all selected cases the tumors were completely ablated. Therefore, two options were tested for the biological tissue: the first including both the tumor and the healthy liver parenchyma in the simulation, and the second including only the healthy liver parenchyma. Test simulations were conducted to evaluate the effect of the tumor on the calculated ablation volume. The ablation volumes with and without the tumor were compared, and the difference was found to be less than 1%. Based on this result, the tumor was excluded from all the reported results.
The liver was represented as a cube. 30 The size of the liver was tested for each case to ensure ablation independence, taking into consideration the position of the electrodes, the effects of the boundaries on the ablation, and the computation time. An example of the model geometry is shown in Figure 4.

Model Representation for the Liver with Electrodes Used in Computer Simulation for One of the Cases, Liver Model Dimension (100*100*100 mm).
For the liver properties, different values for liver conductivity are reported in literature, ranging from 0.05 to 0.12 S/m for the initial conductivity and from 0.2 to 0.45 S/m for the final conductivity (after IRE). According to a recent study
1
the most influential parameter for IRE ablation is the initial conductivity. Another reported influential parameter is, the electric field threshold
20
which was not included in the previous study.
1
Given this information, a focused sensitivity analysis was performed using Morris method,
31
to investigate the influence of these two model inputs on the predicted ablation. This method is a global sensitivity analysis used to rank the input parameters based on their influence on the models output. The sensitivity of the output with respect to the input is computed by the mean and standard deviation of the elementary effect. Where the elementary effect, mean and standard deviation are listed respectively below:


Where X is the set of input parameters, Y is the model output, Δ is the perturbation of input, r is the number of trajectories, µi is the mean of the elementary effects, Σi is the standard deviation, and
The study was performed using a toolbox for global sensitivity analysis. 32 Figure 5 illustrates the variation of ablated volume with electric field threshold and initial conductivity in the considered range.
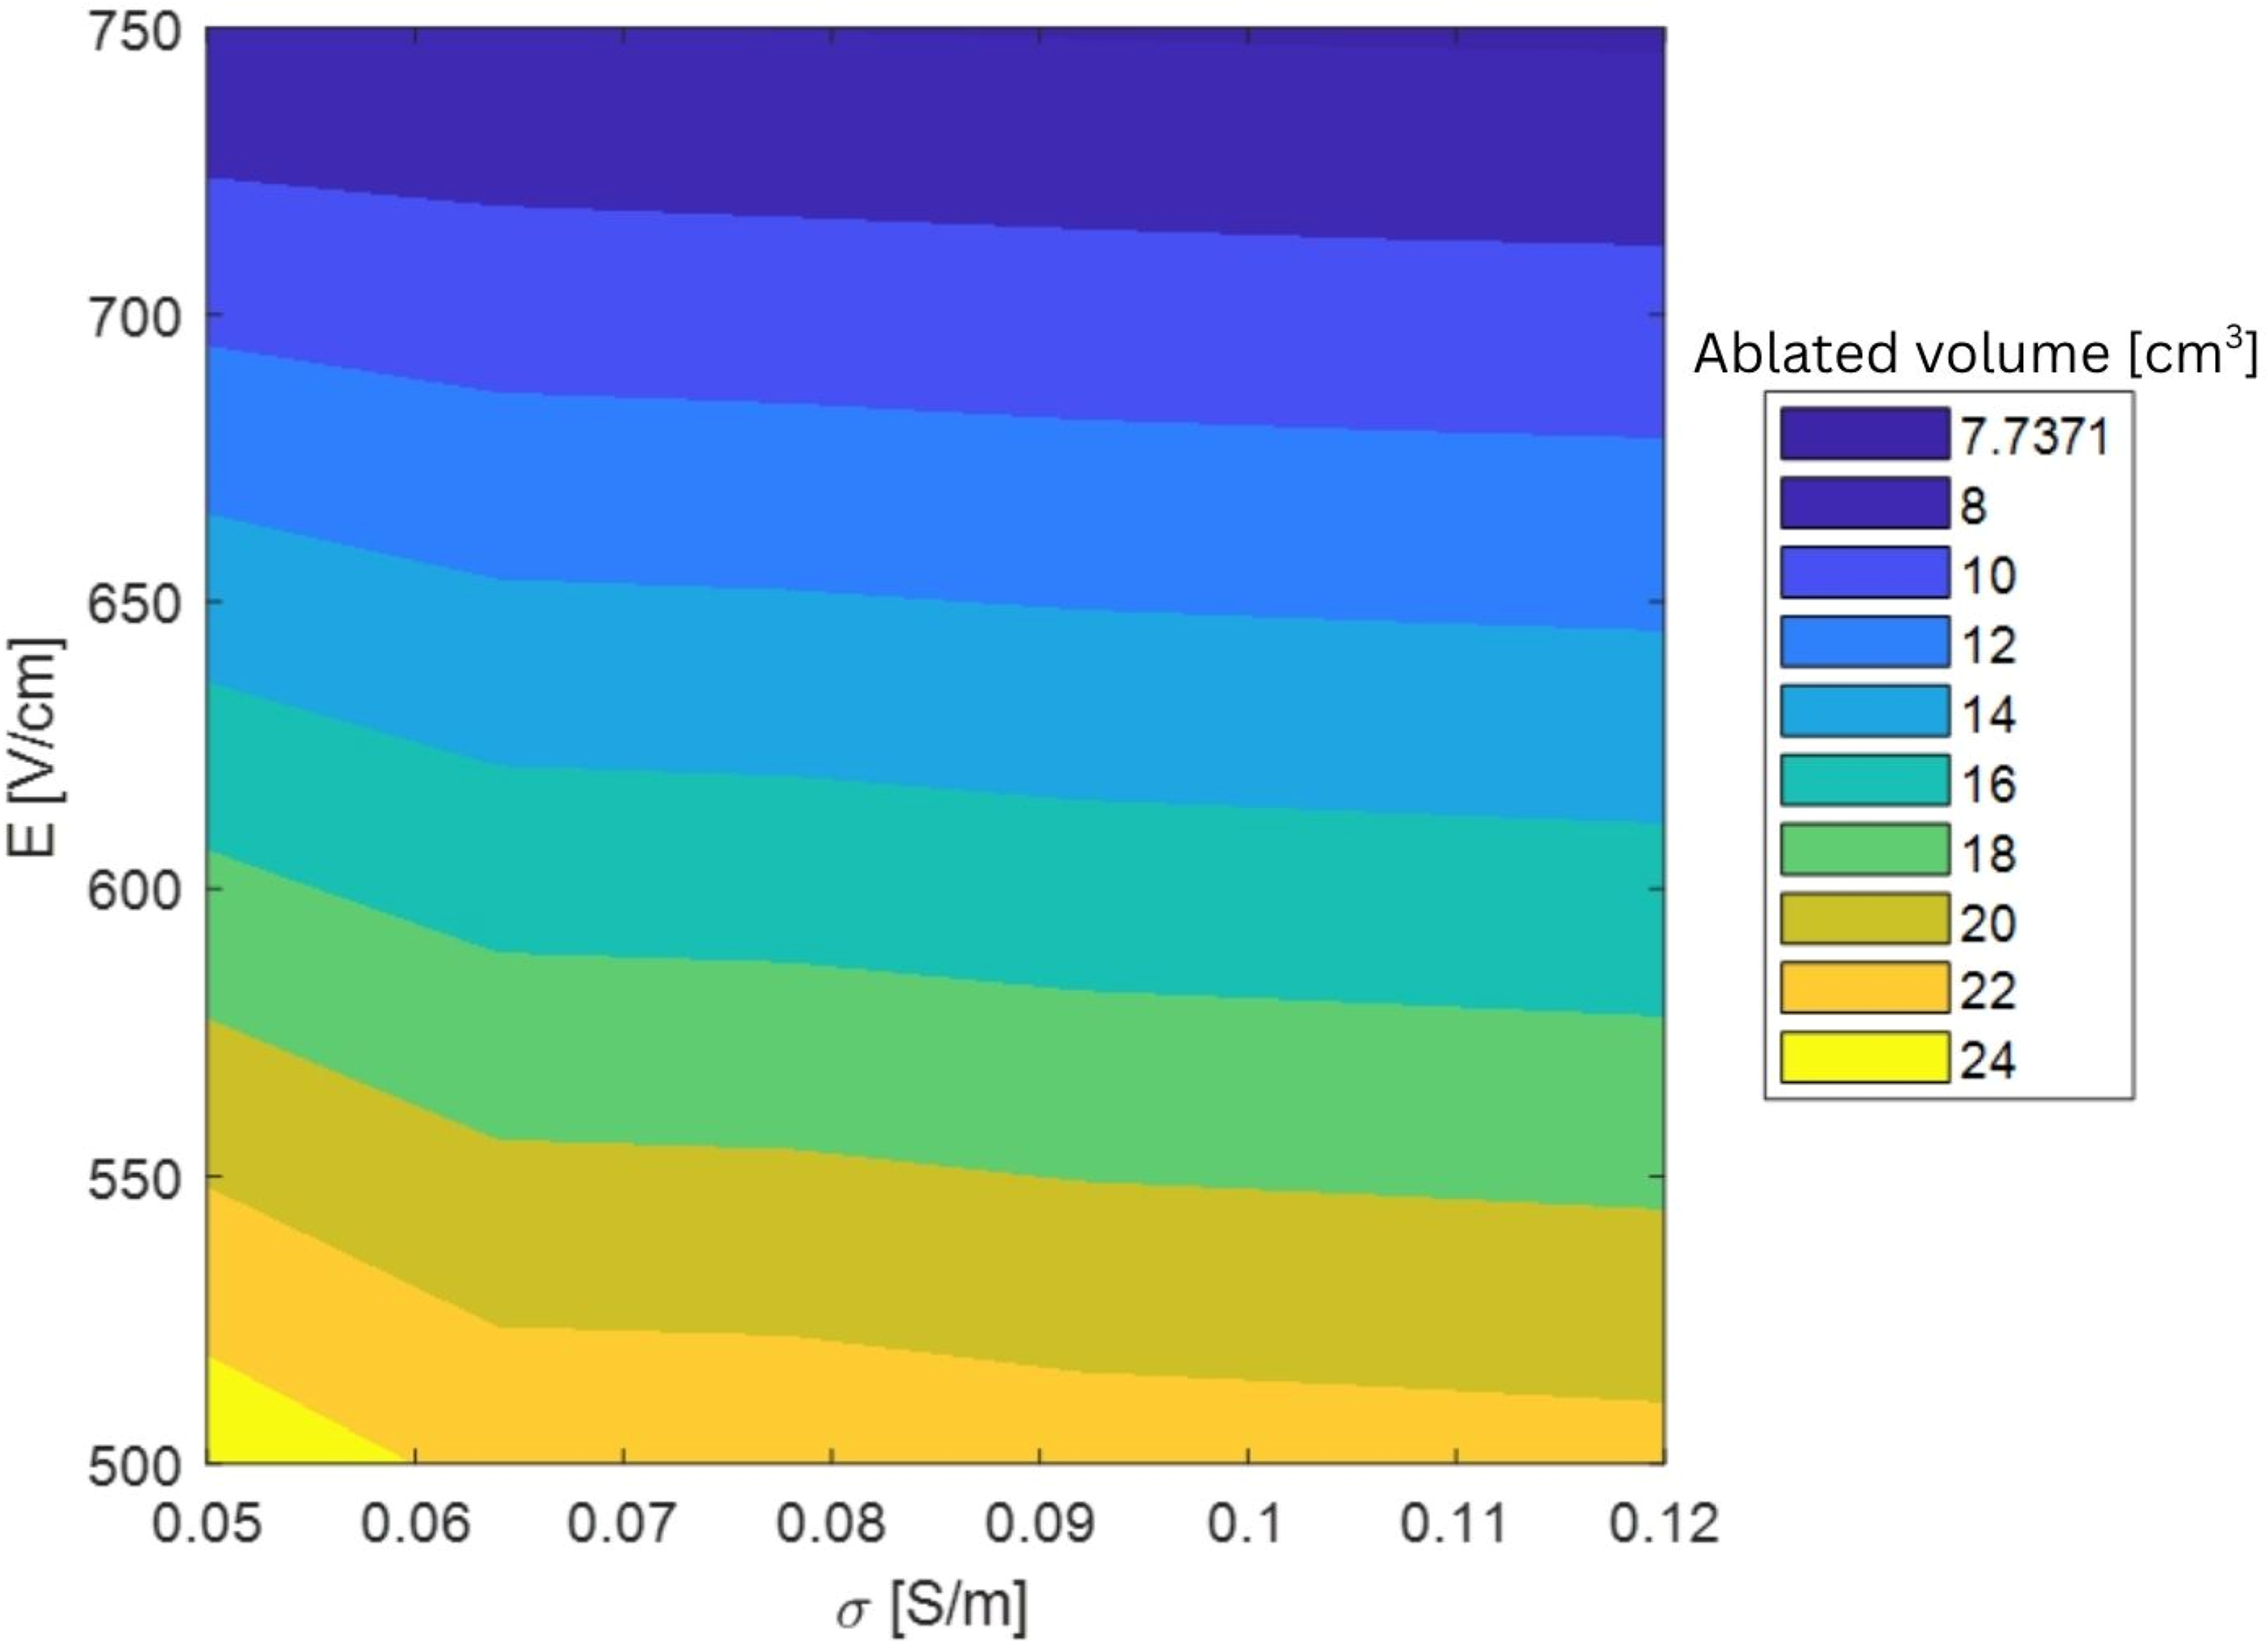
Variation of Ablated Volume [cm3] Within the Range Considered of Electric Field Threshold and Initial Conductivity.
The mean and standard deviation of the elementary effects [µ*, Σ] where µ* represents the overall influence of a parameter, and Σ represents the degree of interaction or non-linearity with other parameters. [µ*, Σ] were found to be equal respectively to [1.13, 0.84] and [14.48, 3.99] for σ and E. We can conclude that within this range, the electric field threshold has a greater influence on the total ablation volume compared to the initial conductivity (largest µ*) and that the interaction between parameters is low (µ* > Σ for both parameters). Therefore, the initial conductivity was fixed, and the ablation volume was measured for different electric field threshold values ranging from 500 to 750 V/cm.
The electrical properties for the liver are shown in Table 3.
Liver Properties.
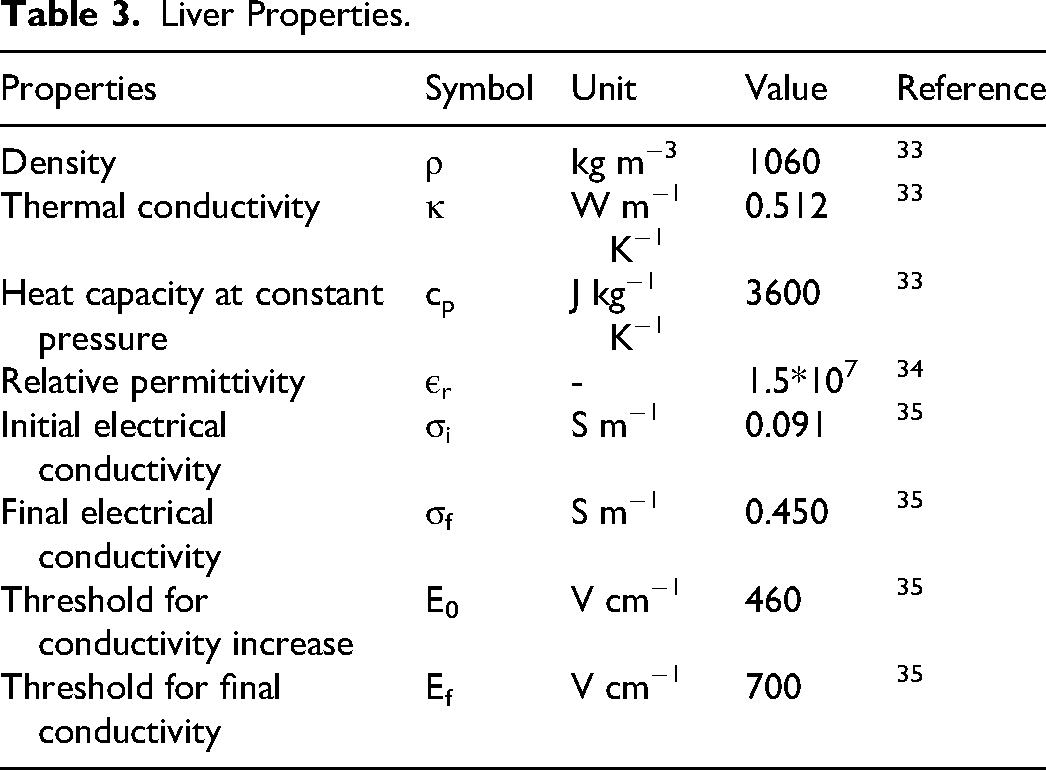
The human liveŕs tissue conductivity was defined as a piecewise function of the local electric field strength
35
as shown in equation (1):
Where σi is the initial conductivity, σf is the final conductivity. E0, Ef are the initial and final threshold for conductivity where the conductivity increase starts and saturates respectively, and E is the current electric field.
For electric currents, the assumed surface of the liver was defined as an insulation boundary. Terminal boundaries were set for the electrodes to deliver the voltage. With the equation of current conservation
35
represented by:


Equation (2) represents the continuity equation, Where
To alternate between the electrodes, a dynamic condition was added where the results are saved from each active pair and used as the baseline in the following active pair. This allows the system to simulate the effect of the activation of each electrode pair on the conductivity. The main assumption in this model is that the conductivity changes due to electroporation are irreversible once a cell reaches a specific electric field. This threshold derived from literature is used to identify and mark regions that have undergone irreversible electroporation. A sweep was done using several thresholds ranging from 500 to 750 V/cm.
The input voltage for each case ranged from 1000 to 3000 V. The specific voltage along with the electrode pairing and activation sequence was taken from the IRE machine report which is generated during the intervention. Procedure data for all cases is presented in the Supplemental Materials in Table 1.
The mesh was built using a tetrahedral element shape with quadratic (second order) finite elements for both liver and electrode domains. Due to variations in electrode number, orientation, and liver size, the mesh for each case was analyzed individually to determine the most suitable configuration. A mesh convergence study was conducted for each case, with the maximum element size ranging from 1 to 3 mm and the minimum element size ranging from 0.1 to 0.3 mm. This approach resulted in a total number of elements ranging from 651 357 to 2 061 619.
The purpose of these simulations is to compare the simulated ablation volume with the measured one from the post operation CT scans.
The 3D comparison between simulated ablation volume and measured ablation volume was done through Dice score also known as Dice Similarity coefficient (DSC), it is used to quantify the similarity between two sets by overlapping between a predicted region and a ground region. Mathematical definition is given by:
Where
The reporting of this study conforms to STROBE guidelines. 36
Results
CT Scans Measurements
All CT scans were reviewed to select the clearest images for analysis. In some cases, two post-treatment images on the day of the ablation were available. Measurements were performed by three physicians on two separate occasions, with a time interval of 3 weeks between the first and second sessions. This approach was designed to assess both intra-observer variability (differences in measurements by the same physician) and inter-observer variability (differences between measurements by different physicians), alongside the average percentage for inter- and intra-observer, mean average and standard deviation was calculated using the following equations.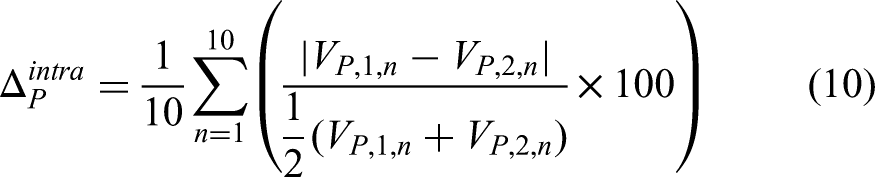


Where
Ablation Volumes Measured by Physicians, Mean Average in cm3, Standard Deviation (STD), Intra-Physician Average Delta%, and Average Delta%.

The images used for measurements were obtained on the day of the intervention. This choice is necessary for a relevant comparison to model's ablation predictions, as reported in literature37,38 and as confirmed by physicians, who typically use same day images to evaluate the success of the procedure.
The results of the measurements performed on the CT scans demonstrate some variability across cases and between the trials conducted by the three physicians. This variability highlights both intra-observer and inter-observer differences.
In most cases, the measurements across trials are consistent, with expected minor variations. For example, cases like 1 and 5 show values that align well across all physicians, with variations falling within an acceptable range. Case 6 also shows agreement across all trials, with very close values of 26.2 and 26.3 cm³ for both measurements from one physician, despite slightly lower values from others.
Simulated Measurements
After assigning the input voltage for all the cases ranging from 1500 to 3000 V, and the electrode pair, the simulations were computed, and the measurements of the ablation volume were recorded for different electric field threshold ranging from 465 to 750 V/cm. In all cases the largest ablation volume was at the 465 V/cm and the lowest recorded was at 750 V/cm. the results of the simulations are shown in Table 5.
Simulated Ablation Volume Measurements at Various Electric Field Strengths.

This table shows the simulated ablation volumes for each case recorded at different electric field strengths ranging from 465 V/cm to 750 V/cm. these values shows how the ablation volume changes as the intensity of the electric field changes.
Across all parameter sets, a general decreasing trend in ablation volume is observed with increasing electric field strength.
A comparison between the mean segmented ablation volumes, calculated by averaging the segmented volumes obtained from different physicians, and the simulated ablation volumes is shown in Figure 6. The data points correspond to electric field thresholds ranging from 500 V/cm to 600 V/cm. Each marker type represents a different electric field value.

Shows the Mean Segmented Ablation Volume in cm3 Compared to the Simulated Ablation Volume Size Obtained at 500 to 600 V/cm.
Segmented ablation volumes were extracted as 3D models for comparison with simulated volumes. Due to data availability, comparisons were limited to physician 1 at the matching electric field threshold. The values of the dice score for each case is shown in Figure 7. The Dice score quantifies the spatial overlap between two sets. In this study, it was calculated based on binary voxelization of the segmented and reference volumes. The Dice score ranged between 0.63 to 0.77 across 10 cases, with a mean dice score of 0.71, showing moderate to good agreement between the measured and simulated ablation volumes.

Shows the Plot of Dice Score Blue Bars for Each Case and the Mean Dice Score Red Dashed Line.
The image in Figure 8 displays the visualization of the 3D comparison and how both ablated and simulated volumes overlap with each other.
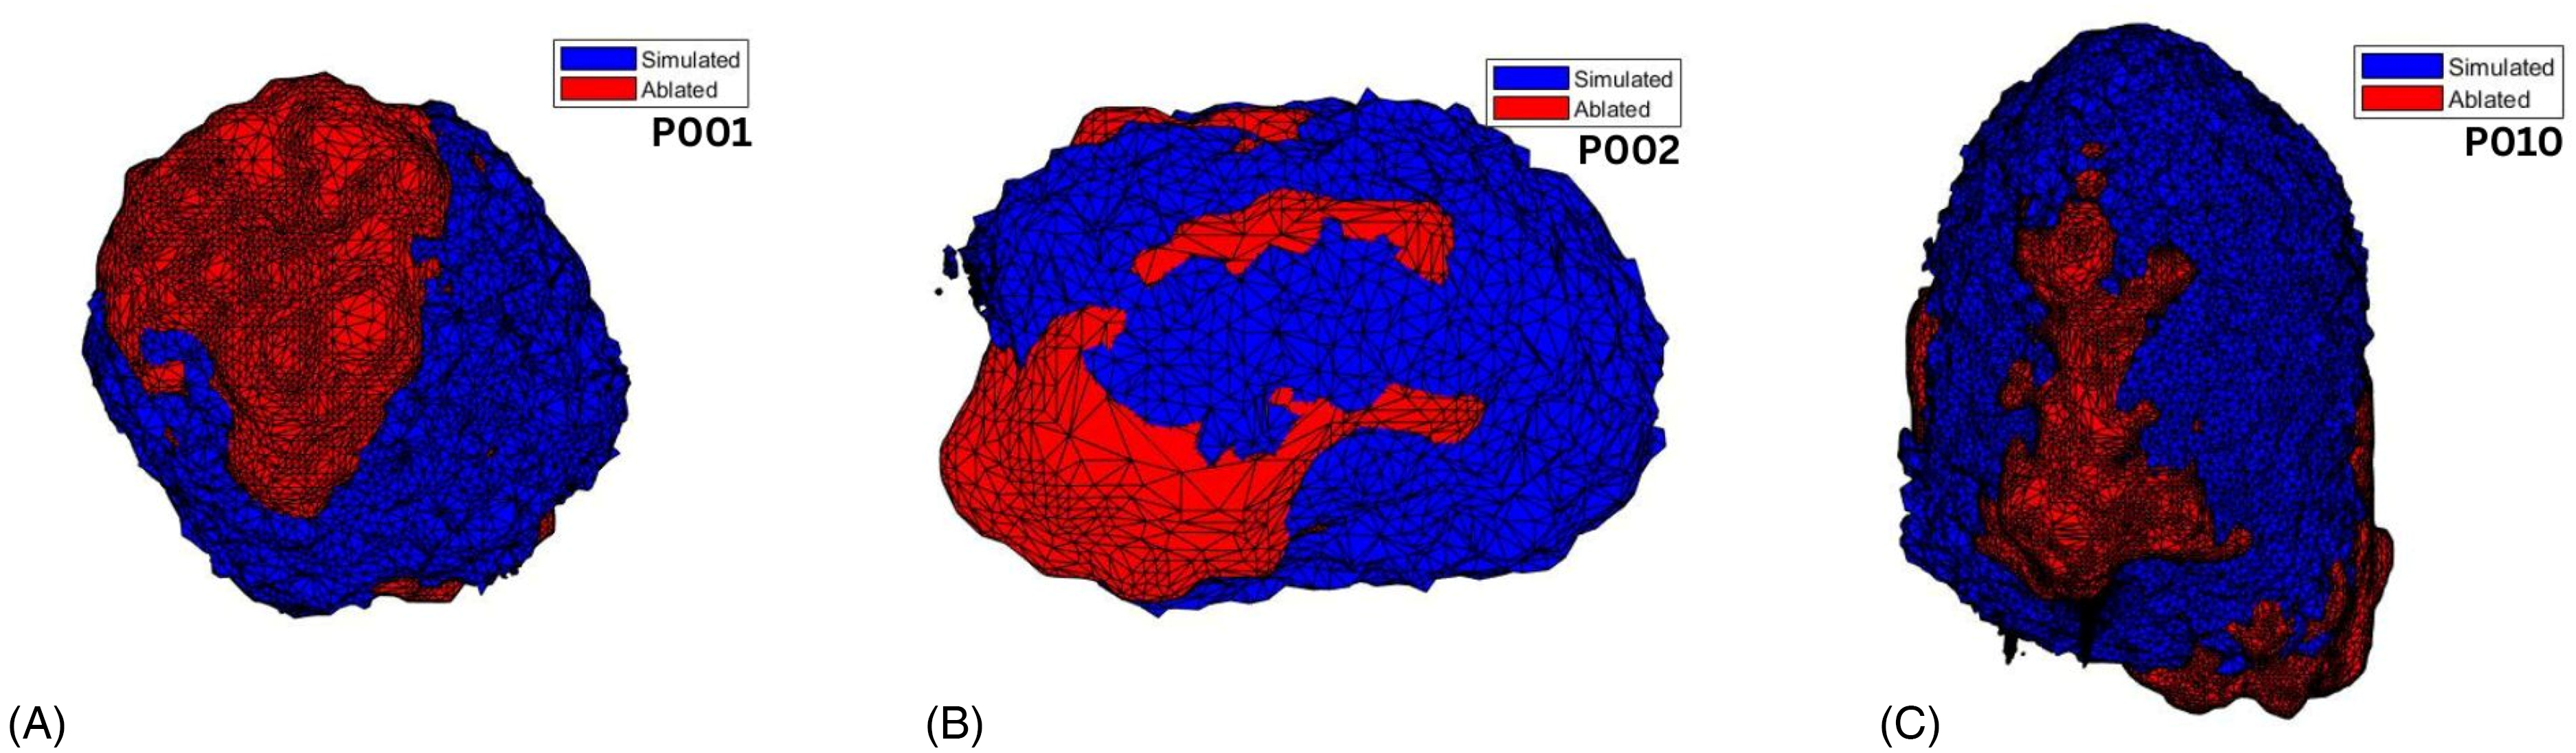
(A), (B), (C) Shows the Overlapping of the Simulated (Blue) and Ablated (Red) Volumes for Case 1, 2, 10 Respectively.
Discussion
In this study, archived CT scan data from patients was reviewed and analyzed regarding IRE ablation. In total 10 cases, where no electrode replacement was done, could be included. After data collection, three physicians were tasked with performing the required measurements, including ablation area and ablation volume. As mentioned earlier, all measurements were performed twice by each physician with a two- to three-week interval between the measurements, this time period was intended to eliminate the chance of measurements repetition.
These measurements are labeled as intra-observer and inter-observer. For physician 1, case 1 showed a value of 34.53 cm3 (Trial 1) and 32.42 cm3 (Trial 2), with a difference of 2 cm3 between trials. Also, for physician 3 we observed a similar difference for case 3 with a value of 24.80 cm3 for trial 1 and 21.00 cm3 for trial 2 with a 3 cm3 difference between trials. The same trend is observed for all physicians, with noticeable differences between trials. Across all physicians and cases, the individual standard deviation (STD) ranged from 0.63 to 3.22. The average percentage difference (Δ%) between the two trials per case and physician ranged from 2.17% to 11.46%. The intra-observer average percentage differences were 8.71% for Physician 1, 2.67% for Physician 2, and 3.61% for Physician 3, respectively. These quantitative measures provide a more objective assessment of intra-observer variability and highlight the consistency and accuracy across repeated measurements. This difference is potentially due to different interpretation or segmentation techniques. Intra-observer has been noted in literature where the variability in measurements was observed in multiple contexts, such as attenuation measurements on computed tomography, 39 and CT scans-based tumor volume delineations in esophageal carcinoma. 40
For inter-observer the difference between the measurements provided by the physicians is also present with a maximum variability of approximately 25% (for cases 6 and 7). Also, as an example case 5, the range of measurements across trials spans from a low of 40.00 cm³ (Physician 3, Trial 2) to a high of 48.44 cm³ (Physician 2, Trial 2). This suggests that the criteria or methods used by each physician to define and calculate the ablation volume may differ, even when assessing the same dataset. These variations may be influenced by the physician's measuring method, familiarity with the imaging software, or personal interpretation of ablation boundaries. Inter-observer differences have been assessed in other studies.41,42
The mean average was used to smooth out inconsistencies and provide a more reliable estimate of ablation volumes for comparative analysis.
The simulations were performed and the result was plotted for different electric field thresholds ranging from 465 to 750 V/cm these values were chosen upon the available literature data that suggests that IRE threshold is somewhere between 500 and 900 V/cm.5,35 The results showed that the threshold ranged from 500 to 600 V/cm is the best fit when compared to the mean average segmented ablation volume.
The decreasing trend in simulated ablated volume with increasing electric field threshold aligns with theoretical expectations, for example in case 1 for threshold 500 V/cm an ablation of 31.04 cm3, while at 750 V/cm an ablation of 15.02 cm3 was measured. When compared to the mean average segmented ablation volume, the best fit for case 1, and 9 was observed at 500 V/cm, and 600 V/cm respectively showing the highest and lowest electric field threshold. This result is probably related to the timing of the measurements in this study, which were performed on the same day as the ablation procedure and therefore required a lower threshold than reported in the literature. At this early stage, the ablation volume had not yet undergone shrinkage or resorption, with enough time for the biological and structural changes to fully develop due to IRE. 43
According to the literature, 35 comparisons made using follow-up imaging, around six weeks post procedure often require a significantly higher electric field threshold, such as 900 V/cm, to match the reduced ablation volume due to tissue healing and contraction over time. Tissue regeneration and ablation zone shrinkage decreases rapidly in size 2 weeks post procedure. 44
However, other studies 45 have shown that when measurements are taken shortly after ablation (on the same day or within 12 h), before significant shrinkage occurs, the simulated ablation volume that most closely matches experimental data corresponds to a threshold of approximately 600 V/cm. This finding is consistent with the results of the current study, supporting the importance of measurement timing when validating simulation models against experimental or clinical outcomes, it was also shown in studies that same day comparisons between simulated ablation zones and CT scans results in a good agreement. 12
The 3D extracted ablation volumes were acquired only from physician 1 during the second trial. This dataset was compared to 3D simulated ablation measurements at specific electric field thresholds ranging from 500 to 600 V/cm using the voxelization method described earlier. The Dice similarity coefficients across 10 cases ranged from 0.63 to 0.77, with a mean of 0.71, indicating moderate to good agreement between the simulated and measured ablation volumes.
Although the data showed good agreement, several factors may have influenced the degree of overlap between the 3D measured and simulated volumes. First, the use of data from one single physician, where the shape and the size of the ablation volume depends on the physician's own eye and hand. Inter-observer variability can significantly affect treatment planning and outcome assessment. 46
Also, the ablation shapes produced by IRE can be irregular and complex, 47 which may limit the ability of uniform electric field threshold-based models to fully capture the geometry of the ablated zone. In more complex cases more electrodes might be needed the achieve the predicted IRE zone.48,49 The ablation outcome is influenced by various factors such as local tissue properties, heterogeneous conductivity, perfusion, and electrode placement and orientation, all of which can lead to complex and patient-specific ablation patterns. 50
Moreover, anatomical and physiological variations between patients such as differences in tissue density, electrical conductivity, can impact the actual extent of ablation and introduce differences when compared with idealized simulations. Although The voxelization process is widely used, it is also sensitive to factors such as grid resolution and segmentation thresholds, which can affect spatial accuracy and, in turn, the Dice scores. 51
with these limitations existing, the moderate to good alignment between simulated and measured volumes provides strong support for the predictive value of the simulation model within the selected threshold range. For future improvements incorporating patient specific tissue properties, refining model calibration with multi-observer datasets could be included.
Next steps could focus on expanding the dataset by increasing the number of studied cases, which was a limitation in this study where only 10 cases were available out of 106, which in turn would enhance the statistical power of the findings. This should include cases with electrode replacement, which introduce additional complexity to the model, as electrode repositioning can significantly affect the distribution of the electric field. 52 This could also include using a realistic liver model extracted from the CT scans and specific to each case, allowing for individualized simulations that account for anatomical variations, thereby improving the accuracy of electric field distribution predictions. 53 The inclusion of a thermally dependent conductivity will be considered for future work in order to improve the model since the increase in temperature will lead to an increase in the conductivity, in this study the thermal conductivity was over looked which introduces a limitation to the model. The reason behind the choice is that thermal effects were investigated in a previous publication 22 Necrosis is only near electrodes, so the influence on thermal effects to the conductivity is negligible for the outer areas, which we are interested in: the ablation volume.
Future work could include, comparing the different electric field thresholds with follow-up imaging from 1 week, 2 weeks, and up to 6 weeks post-intervention. Also specific patient liver tissue properties, studying the effect and the difference of fatty and normal liver on the outcome. While IRE is primarily considered a non-thermal technique, studies have shown that thermal effects can occur during treatment, potentially impacting the surrounding tissues. 54 Including this factor and differentiating between thermal ablation and irreversible electroporation could improve the simulation or aid to the simulations accuracy accounting for individual anatomic and patient factors.
Conclusion
This study evaluated the accuracy of IRE ablation volume prediction by comparing physician-segmented CT data with electric field simulations. Intra- and inter-observer variability was observed, which was consistent with existing literature, showing the influence of subjective interpretation and segmentation methods. Simulated ablation volumes matched best with measured data at electric field thresholds between 500 and 600 V/cm, since measurements were taken shortly after the procedure, before significant tissue shrinkage occurred. 3D comparisons using Dice similarity coefficient indicated moderate to good agreement, despite limitations such as the inherent complexity of IRE-induced ablation geometry. These results support the validity of the simulation model as a predictive tool for IRE ablation and underscore the importance of measurement timing for the choice of electric threshold and the evaluation of ablation data.
Supplemental Material
sj-docx-1-tct-10.1177_15330338251384207 - Supplemental material for A Retrospective Comparison of CT Imaging and Computational Simulations of Irreversible Electroporation in the Liver
Supplemental material, sj-docx-1-tct-10.1177_15330338251384207 for A Retrospective Comparison of CT Imaging and Computational Simulations of Irreversible Electroporation in the Liver by Ali Jouni, Marco Baragona, Youssra Obeidi, Anca-Maria Iancu and Robert Malte Siepmann, Andreas Ritter in Technology in Cancer Research & Treatment
Footnotes
Abbreviations
Acknowledgments
This work is a part of ElectroPros, a collaborative research project undertaken jointly by Uniklinik RWTH, Aachen and Philips Research, Eindhoven.
Ethics Statement
Not applicable.
Author Contribution
Ali Jouni: Draft writing.
Marco Baragona: Simulation control.
Youssra Obeidi: CT scans Reading, observing and 3D ablation volumes measurements.
Anca-Maria Iancu: CT scans Reading, observing and ablation volumes measurements.
Robert Malte Siepmann: CT scans Reading, observing and ablation volumes measurements.
Andreas Ritter: Supervision.
Funding
The project has received funding from the European Union's Horizon 2020 research and innovation program, under the Marie Sklodowska-Curie grant agreement number 813192.
Declaration of Conflicting Interests
The authors declared no potential conflicts of interest with respect to the research, authorship, and/or publication of this article.
Author Disclosure
The authors declare the use of ChatGPT (OpenAI) as an assistive tool limited to grammar and language editing only. The tool was not used for data analysis, interpretation or content generation. Responsibility for the integrity and originality of the manuscript remains entirely with the authors.
Supplemental Material
Supplemental material for this article is available online.
References
Supplementary Material
Please find the following supplemental material available below.
For Open Access articles published under a Creative Commons License, all supplemental material carries the same license as the article it is associated with.
For non-Open Access articles published, all supplemental material carries a non-exclusive license, and permission requests for re-use of supplemental material or any part of supplemental material shall be sent directly to the copyright owner as specified in the copyright notice associated with the article.