
Abstract
Objective
Checkpoint inhibitor pneumonitis (CIP) is a potentially life-threatening immune-related adverse event. Efficient strategies to select patients at risk are still required. The aim of our study was to assess the utility of a machine learning model, integrating pre-treatment CT lung radiomics features with clinical data, to predict patients at risk of developing CIP.
Methods
In this retrospective study, 116 patients with varied malignancies treated with immune checkpoint inhibitors (ICIs) were included. In this cohort, 35 patients presented with CIP and 81 patients did not. Each lung and its lobes were segmented on pre-treatment CT scans to perform a handcrafted radiomic analysis. Radiomic features were associated with clinical parameters to build generalized linear (GLM) and random forest (RF) models, to predict occurrence of CIP. The models were fine-tuned, validated and tested using a nested 5-fold cross-validation method.
Results
The RF models combining radiomic and clinical features showed the best performances with an area under the ROC curve (AUC) of 0.75 (95%CI:0.62-0.88) on the test set. The most accurate clinical model was a RF model and achieved an AUC of 0.72 (95%CI:0.51-0.92). The best radiomic model was a GLM model and achieved an AUC of 0.71 (95%CI:0.58-0.84).
Conclusions
Our CT-based lung radiomic models showed moderate to good performance at predicting CIP. We demonstrated the potential role of machine learning models associating clinical parameters and lung CT radiomic features to better identify patients treated with ICIs at risk of developing CIP.
Advances in knowledge: Radiomics analysis of the lung parenchyma could be used as a non-invasive tool to select patients at risk of developing immune-checkpoint pneumonitis.
Keywords
Introduction
In the last decade immune checkpoint inhibitors (ICIs) have demonstrated unprecedented efficacy in the treatment of numerous advanced malignancies, offering more long-term clinical responses.1,2 However, as ICIs act by stimulating the immune system in order to limit tumor proliferation, they have been associated with specific autoimmune complications called immune-related adverse events (irAEs).3,4 Immune-related adverse events are associated with therapy discontinuation, more frequent hospitalization, emergency room admission, death, and increased health care costs. 5 Among irAEs, checkpoint inhibitor pneumonitis (CIP), which was first described by Nishino et al in 2015 in three patients with melanoma treated with anti-programmed death-1 (PD-1), is particularly worrisome. 6 A recent meta-analysis revealed that CIP was one of the most fatal irAEs, representing 35% of all anti-PD-1 / programmed death ligand-1 (PD-L1) -related fatalities. 7 The reported incidence of CIP is comprised within a wide range, varying from 2% up to 19%.8–10 Several risk factors have been described in order to identify subgroups of patients that are more likely to present with CIP, among which tumor histology, ICI combination therapies or the presence of preexisting chronic lung disease such as interstitial lung disease (ILD) diagnosed on CT.10–14 The latter has been recognized in several studies as one of the most important risk factors, and associated with more high grade CIP, suggesting that lung abnormalities visible on pretreatment CT scans could be used to more accurately predict if a patient is at risk of developing CIP, which is crucial in the therapeutic decision process and the treatment monitoring.15–17
Besides, radiomics is a quantitative, noninvasive imaging technique which extract a large amount of information from standard-of-care imaging. These information can then be used to build machine learning-based models to predict clinical outcomes such as prognosis, response to treatment or treatment toxicity. 18 Radiomic analysis of the lung parenchyma has already shown its ability to predict the onset of radiation pneumonitis.19–22 We postulate that radiomic analysis of the lung parenchyma on pre-treatment CT, by depicting unforeseen lung abnormalities, may play a role in the selection of patients who are more likely to develop CIP. Therefore, in this retrospective study, we conducted a CT-based lung radiomic analysis of patients treated with ICIs for an advanced malignancy in order to predict occurrence of CIP.
Materials and Methods
Patients
We identified all patients with advanced malignancy treated with anti PD-1/PD-L1 at our university hospital between December 2015 and December 2021, either as monotherapy or in association with anti-cytotoxic T-lymphocyte antigen-4 (CTLA-4) or chemotherapy. We retrospectively reviewed medical records and all lung CT carried out during the ICI treatment of those patients.
Two groups of patients were selected, a group of patients who presented with CIP (CIP group) and a group of patients who did not develop CIP (control group).
According to the Fleischner Society, the diagnostic criteria used for CIP were : (a) newly identified pulmonary opacities on CT, commonly in a bilateral nonsegmental distribution; (b) temporal association of presentation with the initiation of the treatment; and (c) exclusion of other causes. 23 To validate the diagnosis of CIP all potential cases, previously selected after clinical records and lung CT screening, were reviewed again in a multidisciplinary team composed of two radiologists (4 and 10 years’ experience), one oncologist specializing in lung cancer and one pulmonologist specializing in ILDs. The severity of CIP was assessed according to Common Terminology Criteria for Adverse Events version 5.0. All patients with an alternative diagnosis such as infection, tumor progression or heart failure were excluded using extensive medical file review based on clinical information, laboratory data, bronchoalveolar lavage if available or echocardiography.
Concerning the control group, all patients who received ICIs between 2018 and May 2019 were included. The patient selection period for that group was intentionally limited to one year (situated in the middle of the study period, which we considered to be representative) in order to limit the imbalance of the data. Exclusion criteria were: (a) occurrence of a CIP; (b) ICI treatment duration of less than 3 months.
In the case of both groups, patients without available high-resolution lung CT performed before ICI initiation were also excluded. The end of the follow-up period was December first, 2021.
The following demographic and clinical data were collected: age, sex, smoking history, Eastern Cooperative Oncology Group performance status (PS), type of malignant disease, active auto-immune disease, prior radiotherapy of the lung, ICI molecule, line of treatment and preexisting pulmonary disease visible on CT (including radiation-induced lung injury, emphysema and ILD; assessed by two radiologists of 4 and 10 years’ experience). Categorical clinical variables were converted to a numerical format to be implemented in the models.
This study received approval from the institutional review board, and the need for informed consent was waived based on its retrospective design. The reporting of this study conforms to STROBE guidelines. 24
CT Image Acquisition and Segmentation
The pre-treatment CT images were acquired with scanners Somatom Emotion, Sensation, Definition, Definition AS or Edge plus (Siemens Healthineers, Erlangen, Germany), Brilliance (Phillips Healthcare, Amsterdam, Netherlands), Brightspeed or Revolution CT (GE Healthcare, Chicago, IL, US), using tube voltage ranging from 80kVp to 130kVp, automatic adjustment of tube current, a 512 × 512 matrix, with or without intravenous iodine-based contrast injection. All images were reconstructed using a lung convolution kernel with slice thickness comprised between 0.6 and 3 mm. For all patients, each lung and its lobes were semi-automatically segmented using MIM software v7.2.3 (Beachwood, OH, US) by one radiologist with 10 years’ experience, taking care to exclude large vessels and gross tumoral tissue.
Radiomic Analysis
Features Selection
Handcrafted radiomic features were extracted from each segmented region of interest (ROI) using the RadiomiX software (Oncoradiomics SA, Liège, Belgium), including first-order and texture features, in compliance with the Image Biomarkers Standardization Initiative. 25 Gray value discretization using a fixed bin count of 64 was performed. A minimum redundancy maximum relevance (mRMR) feature-ranking algorithm was used to select a subset of promising predictors. The feature selection procedure was adapted to the machine learning method considered, the F-test correlation quotient using Analysis of Variance (ANOVA) was used for the generalized linear model (GLM) and the random-Forest correlation quotient based on the Gini Index for the random forest (RF) model.
Model Building
The output to be predicted by the models was the occurrence of CIP. Three types of models were built: (a) clinical models integrating clinical parameters only, (b) radiomic models, integrating radiomic features only, and (c) combined models, associating clinical parameters and radiomic features. Clinical models only integrated a subset of patients for whom all clinical data were available, contrary to radiomics and combined models in which all patients of the cohort were included. The performance of each ROI was first assessed separately regarding the outcome. The patient-level performances of the models were then expressed as the mean area under the ROC curve (AUC) value of all the ROIs belonging to the same patient, using either lung ROIs or lobe ROIs. Due to the lack of an independent validation dataset a stratified 5 × 5-folds nested cross-validation scheme was used. Stratification based on outcome occurrence and cancer origin was used to equally split the data in the 5 outer folds. Each outer train fold was subsequently divided into a subset of 5 inner folds (80/20 split), to optimize hyperparameters and train the models. The best model per outer fold was selected based on the highest mean AUC over the inner folds. The outer folds were used to assess generalizability and robustness of the models. A random down-sampling was carried out on the outer loop test sets to reach a 1:1 outcome ratio. The final performance of the model corresponds to the mean performance of all outer fold signature. Two different types of machine learning model were used for each set of features: a GLM and a RF model. Concerning RF, deeply grown trees were chosen by setting a low minimum node size, leading to deep and unbiased trees with a near-deterministic behavior on training data (AUCs≈1). Overfitting was controlled by applying ensemble averaging across the 5 outer folds of the nested cross-validation. Two hyperparameters were optimized during cross-validation: the number of trees (tested between 100 and 10 000) and the number of features randomly selected at each split (tested between 1 and 50).
Statistical Analysis
Wald test was used for the univariate analysis of the clinical predictors. The performance of each model was evaluated by the area under receiver operating characteristic (ROC) curve (AUC), and its corresponding 95% confidence interval (CI). DeLong test was performed to compare the AUC values of the different models. All the statistical analyses were carried out with R software (version 4.1.1), using the glm function and the caret package (ranger implementation).
Results
Patient Characteristics
A total of 116 patients were included in the analysis, 35 patients in the CIP group and 81 patients in the control group. A patient flow diagram is shown in Figure 1. A total of 740 ROIs were segmented, composed of 230 lungs (2 patients had a history of left pneumonectomy) and 530 lobes (after lobectomy, 20 ROIs were considered both as lung and lobe). There were significantly more patients with a history of smoking in the CIP group compared to the control group (100% vs 89%, P = .04). There were also more patients with a high tumoral PD-L1 expression in the CIP group compared to the control group (51% vs 25%, P = .03). There was no other significant difference between the groups. The median time between baseline CT acquisition and ICI initiation was 24 days (range 0-158 days) in the whole dataset, 22 days (range, 1-158 days) in the CIP group and 25 days (range, 0-126 days) in the control group. Contrast-enhanced CTs were performed in 27 patients (77%) of the CIP group, and 68 patients (84%) of the control group. Median time between ICI initiation and CIP occurrence was 113 days (range, 11-1304 days). Grade 1 CIP was observed in 8 patients (23%), grade 2 in 15 (43%), grade 3 in 4 (11%), grade 4 in 4 (11%) and grade 5 in 4 patients (11%). The median treatment duration was 8.3 months (range, 0.9-45 months) in the CIP group and 10.6 months (range, 3-35.7 months) in the control group (P = .22). The demographic and clinical characteristics of the patients are presented in Table 1. Tumoral expression of PD-L1 was unknown in 33 patients (28%), including patients with non-lung malignancies and lung malignancies receiving second and further lines treatments, and therefore these patients were not included in the clinical models. Predictive value of the clinical characteristics regarding CIP onset in the 83 patients with known tumoral PD-L1 status are shown in Table 2. In order to use the whole dataset, tumoral PD-L1 status was not integrated in the combined models.
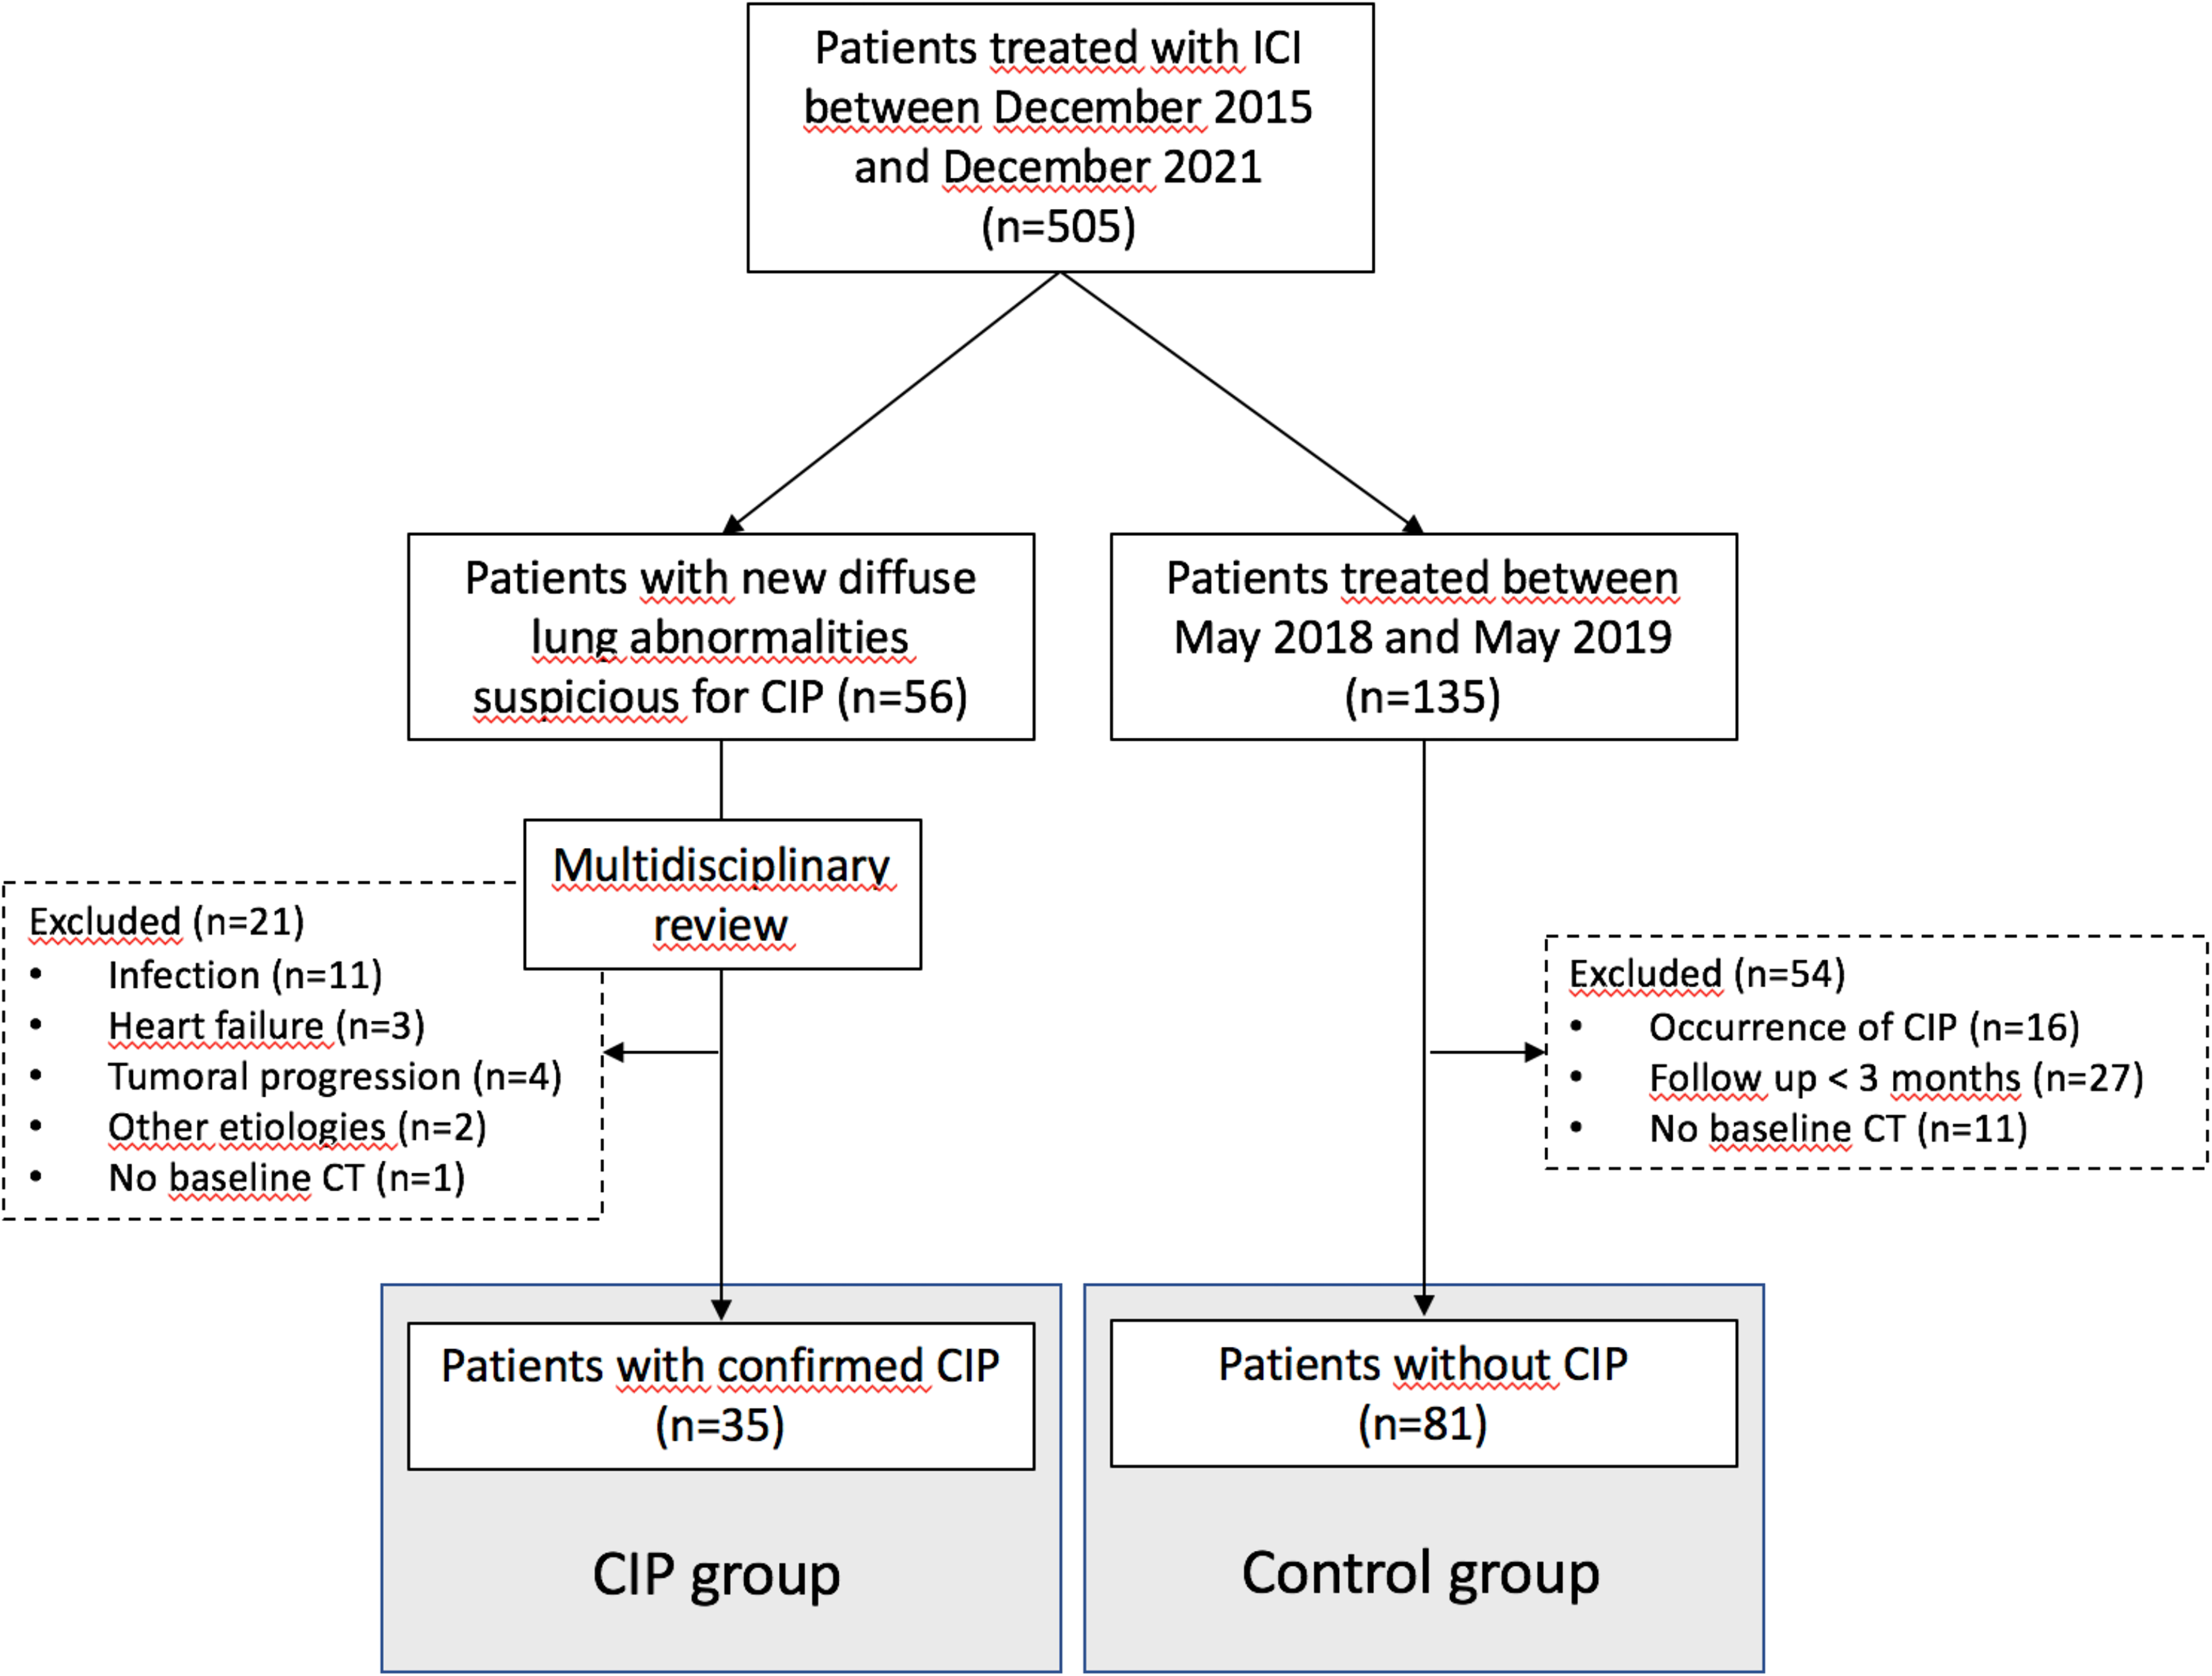
Patients Flow Diagram.
Demographic and Clinical Characteristics of the Patients.

Other includes renal, head and neck, urothelial, esophageal and penile cancers.
Abbreviations: ECOG PS, Eastern Cooperative Oncology Group performance status; PD-L1, programmed death-ligand 1; ICI, immune checkpoint inhibitor; CT, chemotherapy; ILD, interstitial lung disease; CIP, Checkpoint inhibitor pneumonitis.
in months.
Univariate Analysis of the Clinical Predictors.

Abbreviations: ICI, immune checkpoint inhibitor; AUC, area under the ROC curve; OS, overall survival; CIP, Checkpoint inhibitor pneumonitis; ROC, receiver operating characteristic; ECOG PS, Eastern Cooperative Oncology Group performance status.
Radiomic Feature Selection
A total of 171 handcrafted radiomic features were extracted from each segmented ROI. A subset of 10 promising predictors was selected for GLM and 50 promising features for RF models using the mRMR feature ranking algorithm. The list of the radiomic and clinical features selected for each model building, and their relevance, can be found in the Supplementary Tables 1-4.
Performance of the Models
Concerning the performances of the clinical models, based on clinical predictors only, the best clinical GLM signature to predict the onset of CIP included 4 parameters (age, smoking history, line of treatment and tumoral PD-L1 status) and achieved an AUC of 0.59 (95%CI:0.38-0.80) on the test set. The best clinical RF model yielded an AUC of 0.72 (95%CI:0.51-0.92).
Concerning radiomic models, including radiomic features only, the GLM lobe-based approach achieved an AUC of 0.78 (95%CI:0.77-0.79) and 0.71 (95%CI:0.58-0.84) on the training and validation dataset; and 0.75 (95%CI: 0.74-0.76) and 0.61 (95%CI: 0.46-0.76) for the lung-based analysis, respectively. The RF approach achieved an AUC of 0.61 (95%CI: 0.43-0.79) for lobes and 0.68 (95%CI: 0.57-0.79) for lungs on the testing dataset.
Regarding the performances of the combined models, associating clinical parameters and radiomic features to predict the onset of CIP, the GLM lobe-based approach achieved an AUC of 0.83 (95%CI: 0.82-0.84) and 0.75 (95%CI: 0.64-0.86) on the training and validation dataset; and an AUC of 0.78 (95%CI: 0.75-0.81) and 0.62 (95%CI: 0.49-0.75) for the lung-based analysis, respectively. The RF lobe-based approach achieved an AUC of 0.75 (95%CI: 0.68-0.82) and the lung-based approach an AUC of 0.75 (95%CI: 0.62-0.88) on the testing dataset. Regarding RF model's performances on training sets, the deeply grown trees of the RF models applied led to near-deterministic behavior on training data with AUCs ≈1.
A summary of the models’ performance is presented in Table 3 and the corresponding ROC curves are shown in Figure 2.

ROC Curves of the Clinical Models. (a, b), radiomic lobe-based models (c, d), radiomic lung-based models (e, f), combined lobe-based models (g, h) and lung-based models (i, j). For each model, GLM (a, c, e, g, i) and RF (b, d, f, h, j) analyses with confidence intervals are represented in light and dark grey respectively. Abbreviations: GLM, generalized linear model; ROC, receiver operating characteristic.
Test set Performances of the Different Machine Learning Models to Predict CIP Occurrence.

Abbreviations: CIP; checkpoint inhibitor pneumonitis; AUC, area under the ROC curve; ROI, region of interest; GLM, generalized linear model; RF, random forest; ROC, receiver operating characteristic.
No statistically significant difference was noted between AUC values of the different models following the DeLong test. All radiomic and clinical features used to build the signatures are available in the Supplementary Tables 1-4.
Discussion
Immune checkpoint inhibitors offer unprecedented tumoral response in a subset of patients with advanced cancer, but are also associated with specific and potentially life-threatening adverse events, among which is CIP. Thus, in the era of personalized medicine, a more accurate understanding of these irAEs, and the reliable identification of patients at risk, are crucial to aid the best treatment selection for an individual patient. 26
In this study, we used radiomics to extract texture features from pre-treatment lung CT to predict the onset of CIP in patients with solid malignancies. These features were combined to clinical parameters and analyzed using machine learning algorithms to develop predictive models. Our best combined patient-based model was the lobe-based RF model, achieving moderate to good performances at stratifying the risk of developing CIP, yielding an AUC of 0.75 (95%CI: 0.68-0.82).
The presence of underlying chronic lung disease such as ILD has been recognized as an important risk factor for CIP.13,15,16 This has been confirmed in two recent meta-analyses looking at the occurrence of CIP in non-small cell lung cancer (NSCLC), showing an increased incidence of CIP in patients with ILD, with a pooled OR of 3.23 (95%CI: 2.06-5.06) and 3.68 (95%CI: 2.49-5.44).27,28 In the KEYNOTE 001 study, an association was shown between occurrence of pneumonitis and a history of asthma or chronic obstructive pulmonary disease in patients with NSCLC treated with pembrolizumab. 29 In a study by Atchley et al, the development of CIP in a cohort of patients with lung cancer treated with ICIs was independently associated with several chronic pulmonary diseases such as fibrosis, COPD and emphysema. 9 Reuss et al have also demonstrated that NSCLC patients treated with ICIs who subsequently developed CIP had lower pre-treatment forced expiratory volume in 1 s, suggesting that preexisting lung disease resulting in decreased lung function may be a CIP risk factor. 30 All these data suggest that beside risk factors linked to patient characteristics and treatment modalities, preexisting lung disease is also to be considered as a risk factor for CIP. 14 The underlying mechanism is not well known but some authors suggest that the presence of inflammatory pulmonary comorbidities leads to predisposition to acute inflammatory lung response.4,31,32
Although CT radiomics has already proven its ability to assess interstitial lungs abnormalities, few studies have evaluated its role in the identification of patients at risk of developing CIP.33–35 A proof of concept study by Colen et al based on two patients with CIP was the first attempt to show the potentiality of CT radiomics of the lung parenchyma at predicting CIP onset. 36 More recently, Tan et al have developed a deep learning model based on clinical data and pre-treatment CT images of the lungs to predict patients at risk of developing CIP in a lung cancer population, achieving an excellent performance with an AUC of 0.92. 37 However, the dataset they used to train their deep learning model was still limited, including only 24 patients with CIP among 48 patients with lung cancer, leading to a risk of overfitting. In comparison, we used more understandable machine learning processes to build models based on a dataset composed of 116 patients presenting with different types of cancers. We also performed our radiomic analysis on two anatomical levels, the lobes and the lungs, postulating that some textural parameters could be different when considering the whole lung rather than a part of it. Even if no statistically significant difference was noted between the different models with the DeLong test, which could be due to the limited size of our dataset, our lobe-based linear models showed better performances compared to the lung-based analyses. The lobe-based approach could be more efficient to depict non-uniformly distributed lung abnormalities. However, looking at the RF analysis, no difference in performance was noted between the two approaches. In this study the combined models slightly outperformed both radiomic and clinical models. However, tumoral PD-L1 expression, which was the clinical factor most strongly associated with CIP with an AUC of 0.60 (95%IC, 0.51-0.69), was not available in 28% of patients and was therefore not included in the combined models, contrary to the clinical models. It means that the clinical parameters used to train these models were slightly different and that these models could not be directly compared. Nonetheless, performances of the combined models without PD-L1 expression were still better than the clinical models including PD-L1 expression, underlining the importance of developing integrative models. In this specific indication, models integrating lung textural analysis is a way of incorporating quantitative lung parenchymal assessment in the CIP risk stratification process, along with patient and treatment-based risk factors.
Our study has some limitations. First, it is a monocentric study and an external validation dataset was lacking, which could be a problem to assess the generalizability of the models. However, to compensate for this limitation we used a nested cross-validation approach to fine-tune parameters and test the models on different data. This approach was taken in order to limit the effect of an optimistically biased evaluation of the models and to obtain a more accurate assessment of their true performance. Also, our patient population is heterogeneous, including different tumor histologies, treatment types and lines, and patient profiles; a more accurate selection of a sub-population of patients might have resulted in better performance. The median treatment duration was slightly shorter in the CIP group (8.3 months) compared to the control group (10.6 months), but that difference was not statistically significant (P = .22). This difference is probably due to the fact that treatment was withdrawn in case of CIP of grade 2 and higher, as part of side effect management. The distribution of classes within our dataset was imbalanced with a 30/70 proportion of patients with and without CIP. Even if this could be considered as a light imbalance, this could have led to bias toward the majority class.
Additionally, tumoral PD-L1 expression was not included in the combined models, consequently, its performances could not be directly compared with the performances of the clinical model. Finally, differences in acquisition parameters and contrast injection protocols between CTs could potentially have affected radiomic features extraction and analysis.
Conclusion
This study demonstrated the potential role of a machine learning model associating clinical parameters and lung CT radiomics features to more accurately identify patients with advanced malignancies treated with ICIs at risk of developing CIP.
Supplemental Material
sj-docx-1-tct-10.1177_15330338251344004 - Supplemental material for Machine Learning Model Integrating CT Radiomics of the Lung to Predict Checkpoint Inhibitor Pneumonitis in Patients with Advanced Cancer
Supplemental material, sj-docx-1-tct-10.1177_15330338251344004 for Machine Learning Model Integrating CT Radiomics of the Lung to Predict Checkpoint Inhibitor Pneumonitis in Patients with Advanced Cancer by François Cousin, Thomas Louis, Pierre Frères, Julien Guiot, Mariaelena Occhipinti, Fabio Bottari, Wim Vos and Roland Hustinx in Technology in Cancer Research & Treatment
Footnotes
Abbreviations
Ethical Considerations
The approval from the Institutional Review Board (Comité d’Ethique Hospitalo-Facultaire Universitaire de Liège) was obtained, and the need for informed consent was waived based on its retrospective design (Reference number: 2019/191; date of acceptance : 08/08/2019).
Funding
The authors received no financial support for the research, authorship, and/or publication of this article.
Data Availability Statement
The data that support the findings of this study are available on request from the corresponding author.
Declaration of Conflicting Interests
Julien Guiot reports personal fees for advisory board, work and lectures from Boehringer Ingelheim, Janssen, SMB, GSK, Roche, Astra Zeneca, and Chiesi, non-financial support for meeting attendance from Chiesi, MSD, Roche, Boerhinger Ingelheim and Janssen. He is in the permanent SAB of Radiomics (Oncoradiomics SA) for the SALMON trial without any specific consultancy fee for this work. He is co-inventor of one issued patent on radiomics licensed to Radiomics (Oncoradiomics SA).
Thomas Louis and Fabio Bottari are salaried employees of Radiomics (Oncoradiomics SA). Mariaelena Occhipinti reports personal fees from Radiomics, outside the submitted work. Wim Vos has shares in the company Radiomics.
The rest of the authors does not have conflicts to declare.
Supplemental Material
Supplemental material for this article is available online.
References
Supplementary Material
Please find the following supplemental material available below.
For Open Access articles published under a Creative Commons License, all supplemental material carries the same license as the article it is associated with.
For non-Open Access articles published, all supplemental material carries a non-exclusive license, and permission requests for re-use of supplemental material or any part of supplemental material shall be sent directly to the copyright owner as specified in the copyright notice associated with the article.