
Abstract
Purpose
To evaluate the accuracy of two bladder scanners (BS) in measuring bladder volume (BV) during radiotherapy (RT), and explore the influence of two bladder filling methods and patients’ subjective urinary sensation on the consistency of BV.
Methods
Forty-two patients with pelvic tumors were divided into two groups: Group A (20 patients) and Group B (22 patients). Before the planning CT and each treatment session, all patients drank 500 mL of water after emptying their bladder and rectum. Group A waited for patients to provide feedback on urination, while Group B waited for 1 h. Subsequently, three consecutive measurements using two BSs were performed. The average volumes measured by the BS Padscan HD5 and Padscan HDW1 were recorded as BSHD5-v and BSHDW1-v, respectively. The differences between BSHD5-v, BSHDW1-v, and the BV obtained from planning CT (CT-v) or cone beam CT (CBCT) (CBCT-v) were assessed. The consistency between CBCT-v and CT-v in two patient groups was calculated. Urinary sensation score BV (VSC) was determined by the patient's urge to urinate score and CT-v.
Results
The average CT-v or CBCT-v was 280 mL (range 78-710 mL, SD = 119 mL). BSHD5-v had an average of 271 mL (range 61-611 mL, SD = 115 mL), with a significant correlation with CT-v or CBCT-v (R = 0.89, p < 0.001). BSHDW1-v averaged 267 mL (range 92-634 mL, SD = 77 mL), positively correlated with CT-v or CBCT-v (R = 0.70, p < 0.001). Group A's CBCT-v proportions within ±20%, ± 30%, and ±50% of CT-v were 51.20%, 66.90%, and 91.90%, respectively, contrasting with Group B's 26.2%, 41.1%, and 67.7%. VSC exhibited a positive association with CBCT-v (R = 0.59, p < 0.001).
Conclusions
Consistent and reproducible bladder volume was obtained by using Padscan HD5 and Padscan HDW1. The Padscan HD5 demonstrated greater consistency and accuracy. Furthermore, the urinary feedback method has a more consistent bladder volume than the fixed-time method.
Introduction
Pelvic tumors represent a prevalent category of malignant tumors, and radiotherapy (RT) serves as a pivotal component in their treatment. However, the consistency of bladder volume (BV) during therapy substantially impacts the irradiation dose to both the target area and organs at risk (OARs),1–7 consequently elevating the risk of toxic side effects.8–10 Image-guided radiotherapy (IGRT) enables visualization of the target area and OARs before each treatment, necessitating patients to augment water intake or endure longer periods of urine retention if bladder filling is inadequate. Nonetheless, this process is time-intensive, and repetitive cone-beam CT (CBCT) scans expose other tissues to additional radiation doses. BladderScan, an ultrasound-based BV scanner devoid of radiation, offers an alternative solution that can be utilized outside the treatment room, thus obviating the need for repeated CBCT scans owing to inadequately prepared bladders. This approach not only enhances treatment efficiency but also mitigates patient discomfort. The latest studies primarily compared the bladder volumes (BV) obtained from the BVI9400, BVI6100, Lilium® α-200, and Meike Palm PBSV3.2 with those from CT and CBCT scans, demonstrating a robust correlation.11–14
In this study, the BS Padscan HD5 is widely used in clinical practice, but there is relatively limited research on it. On the other hand, the BS Padscan HDW1 is currently in the testing phase. The Padscan HDW1 measurement device offers technological innovations that surpass traditional BS. Its compact size and portability make it suitable for various clinical environments. By connecting with a mobile app, it enhances flexibility and convenience, particularly in RT, providing more application scenarios for real-time BV monitoring. Additionally, the Padscan HDW1 is cost-effective, significantly reducing hospital investment and maintenance costs compared to traditional equipment.
The study aimed to: (1) Compare the disparities in BV (BSHD5-v and BSHDW1-v) measured by two BSs (Padscan HD5 and Padscan HDW1, Caresono, Dandong, China) with planning CT bladder volume (CT-v) and bladder volume scanned by CBCT on the same day (CBCT-v), evaluating the validity of the two BSs. The two BSs are shown in Figure 1(a) and 1(b). (2) Contrast the variations in BV consistency between the patient biofeedback method and the fixed drinking volume and time drinking method. (3) Analyze the differences in patients’ urinary sensation score BV (VSC) concerning CBCT-v.

(a) The bladder scanner Padscan HD5; (b) The bladder scanner Padscan HDW1.
Materials and Methods
Patients
The reporting of this study conforms to the CONSORT statements. 15 From February 2021 to November 2021, 42 patients diagnosed with pelvic tumors undergoing RT were enrolled in this study. Approval was granted by the Ethics Committee of West China School of Medicine, Sichuan University (No. 20211568), with all patients providing written informed consent. Exclusion criteria included urinary frequency exceeding once per hour, frequent nocturia, urinary incontinence, and rectal diversion. The average age of the patients was 55.5 years (median, 55 years; range, 35-74 years), with an average body mass index (BMI) of 23.1 kg/m2. Nearly all patients (with one exception) underwent consecutive RT sessions. To compare the differences in BV consistency between two methods of bladder filling, patients were randomized into two groups: Group A (20 patients) and Group B (22 patients). All patients in both groups were instructed to empty their bladder and rectum, and then drank 500 mL of water. In Group A, bladder measurements were performed when the patients’ urinary urge was consistent with the planning CT. Conversely, patients in Group B waited for 1 h after drinking water before bladder measurements, using a scale to assess their urinary urge. Patient characteristics are presented in Table 1.
Patient Characteristics.

Abbreviations: ECOG PS, Eastern Cooperative Oncology Group Performance Status Scale; BMI, Body Mass Index.
Bladder Volume Measurement
During planning CT and each treatment session, BV measurements were performed using two bladder scanners (Padscan HD5 and Padscan HDW1). When using the Padscan HDW1, the BS was connected to the HDW1 test version app on a mobile phone. Before using the BS, all operators received standardized training. During the measurement procedure, ultrasound gel was applied to the midline of the patient's abdomen, just above the pubic symphysis. The ultrasound probe was positioned approximately two finger-widths above the pubic symphysis. The probe was slowly adjusted to locate the optimal position for bladder measurement and held steady during acquisition. For the Padscan HD5, the calculated BV was directly displayed on the device screen, while measurements from the Padscan HDW1 were transmitted to and displayed via the mobile application. Three consecutive measurements were performed with each device, and the BV from each measurement was recorded. Subsequently, the average of the three measurements was used for data analysis.
Biofeedback Program
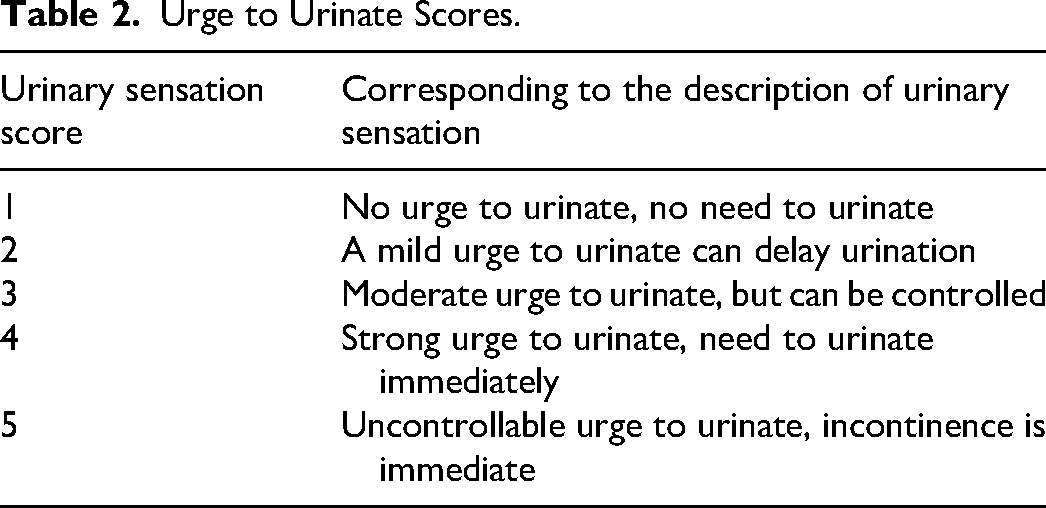
A biofeedback program was introduced for 20 patients in Group A, with appropriate training provided to help patients better discern bladder filling. Feedback was administered by presenting patients with daily BV data and offering water intake recommendations. Due to the limited literature on the BS used in this study for assessing accuracy and precision, its reliability required evaluation. Therefore, BV measured by the BS was not utilized as a feedback criterion for patients. Instead, feedback was based on patients variance between daily CBCT and planning CT images post-alignment to minimize biofeedback errors. To ensure the integrity of the biofeedback mechanism, patients in Group B were not informed of their bladder filling status at the end of treatment. Additionally, the accuracy of patients’ self-assessment of bladder filling was assessed using a 5-point scale for the urge to urinate (Table 2). Bladder scanning was performed when patients in Group A had the same urinary sensation and planning CT, while patients in Group B waited for 1 h before bladder scanning and completing the urinary urgency rating scale. Finally, the VSC derived from the urinary score during treatment was calculated by proportionally converting the urinary score and CT-v, using the formula: VSC = sɨ * CT-v/SCT; where sɨ represents the patient's urinary score at each treatment, and SCT is the urinary score at the time of planning CT. Given that patients in Group A shared the same urinary score and planning CT at the time of treatment, VSC was assumed to be equal to CT-v for Group A patients.
Urge to Urinate Scores.
CT Scan and CBCT Bladder Volume Calculation
All patients were positioned supine, head-first, during the procedure. After the injection of the contrast agent, planning CT scans were performed using a GE CT scanner (General Electric Company, USA) with a slice thickness of 5 mm. The radiation oncologist delineated the target and OARs on the images. The RT plan was developed by a physicist using the Raystation Treatment Planning System (TPS) (RaySearch Laboratories, Sweden). Treatment was delivered using an Elekta linear accelerator Versa HD (Elekta AB, Sweden) with 6MV x-rays. Before each treatment session, a CBCT scan was performed on the patient, and CBCT scan images were transferred to the Raystation system. Researchers delineated the bladder on each CT and CBCT image. Subsequently, the BV was reconstructed and calculated by the planning system. We considered this value to represent the actual volume of the bladder and recorded the BV.
Statistical Analysis
Statistical analyses were conducted using SPSS software (v27.0, IBM Corp, Chicago, IL). Paired t-tests were conducted to compare BV measured by two BSs (BSHD5-v, BSHDW1-v) with CT-v and CBCT-v. Pearson correlation analysis was used to assess the correlation between the BV measured by two BSs (BSHD5-v, BSHDW1-v), VSC, and CT-v or CBCT-v. Furthermore, agreement and deviation of bladder scanner-measured BV from CT-v or CBCT-v were assessed using Bland-Altman plots. A significance level of p < 0.05 was deemed statistically significant.
Results
Accuracy of Two Bladder Scanners in Measuring Bladder Volume
For the 42 patients involved, a total of 345 sets of bladder scans and corresponding CT-v and CBCT-v data were acquired. The mean CT-v and CBCT-v were 280 mL (range 78-710 mL, SD = 119 mL). The mean value measured by Padscan HD5 was 271 mL (range 61-611 mL, SD = 115 mL), with BSHD5-v positively correlated with both CT-v and CBCT-v (R = 0.89, p < 0.001), as depicted in Figure 2(a). Similarly, the mean value of Padscan HDW1 measurements was 267 mL (range 92-634 mL, SD = 77 mL), with BSHDW1-v also positively correlated with CT-v or CBCT-v (R = 0.70, p < 0.001), as illustrated in Figure 2(b). The paired t-test comparing BSHD5-v versus CT-v or CBCT-v yielded a mean difference of 9.07 ± 55.30 mL (95% CI 3.22-14.93, p < 0.005), while for BSHDW1-v versus CT-v or CBCT-v, it was 12.83 ± 85.32 mL (95% CI 3.8-21.87, p < 0.005). The Bland-Altman plot of BSHD5-v versus CT-v or CBCT-v exhibited a mean difference of 9.1 mL, with 95% Limits of Agreement ranging from −99.3 to 117.5 mL, as displayed in Figure 2(c). The Bland-Altman plot for BSHDW1-v versus CT-v or CBCT-v showed a mean difference of 12.8 mL, with 95% Limits of Agreement ranging from −154.4 to 180.1 mL, as illustrated in Figure 2(d).

(a) Scatterplot of bladder scanner Padscan HD5 measured volume versus CT or CBCT volume (R = 0.89, p < 0.001); (b) scatterplot of bladder scanner Padscan HDW1 measured volume versus CT or CBCT volume (R = 0.70, p < 0.001); (c) shows Bland–Altman plots comparing CT or CBCT volume with Padscan HD5 measured volume difference and mean volumes; (d) presents Bland–Altman plots for CT or CBCT volume versus Padscan HDW1 measured volume difference and mean volumes, with horizontal lines indicating the 95% limits of agreement, mean difference, and standard deviation (SD).
Accuracy of Urine Sensation Bladder Volume
Following the evaluation of patients’ ability to accurately predict BV, urinary sensation scores were tallied for a cohort of 42 patients, revealing a positive correlation between the urinary sensation score BV (VSC) and the patient's CBCT-v (R = 0.59, p < 0.001), as depicted in Figure 3(a). Group A showed a positive correlation between VSC and patients’ CBCT-v (R = 0.69, p < 0.001), while Group B demonstrated a correlation between VSC and patients’ CBCT-v (R = 0.49, p < 0.001). The figures are not displayed. The Bland-Altman plot of VSC versus CBCT-v exhibited a mean difference of 25.2 mL, with 95% Limits of Agreement ranging from −232.8 to 182.4 mL, as displayed in Figure 3(b).
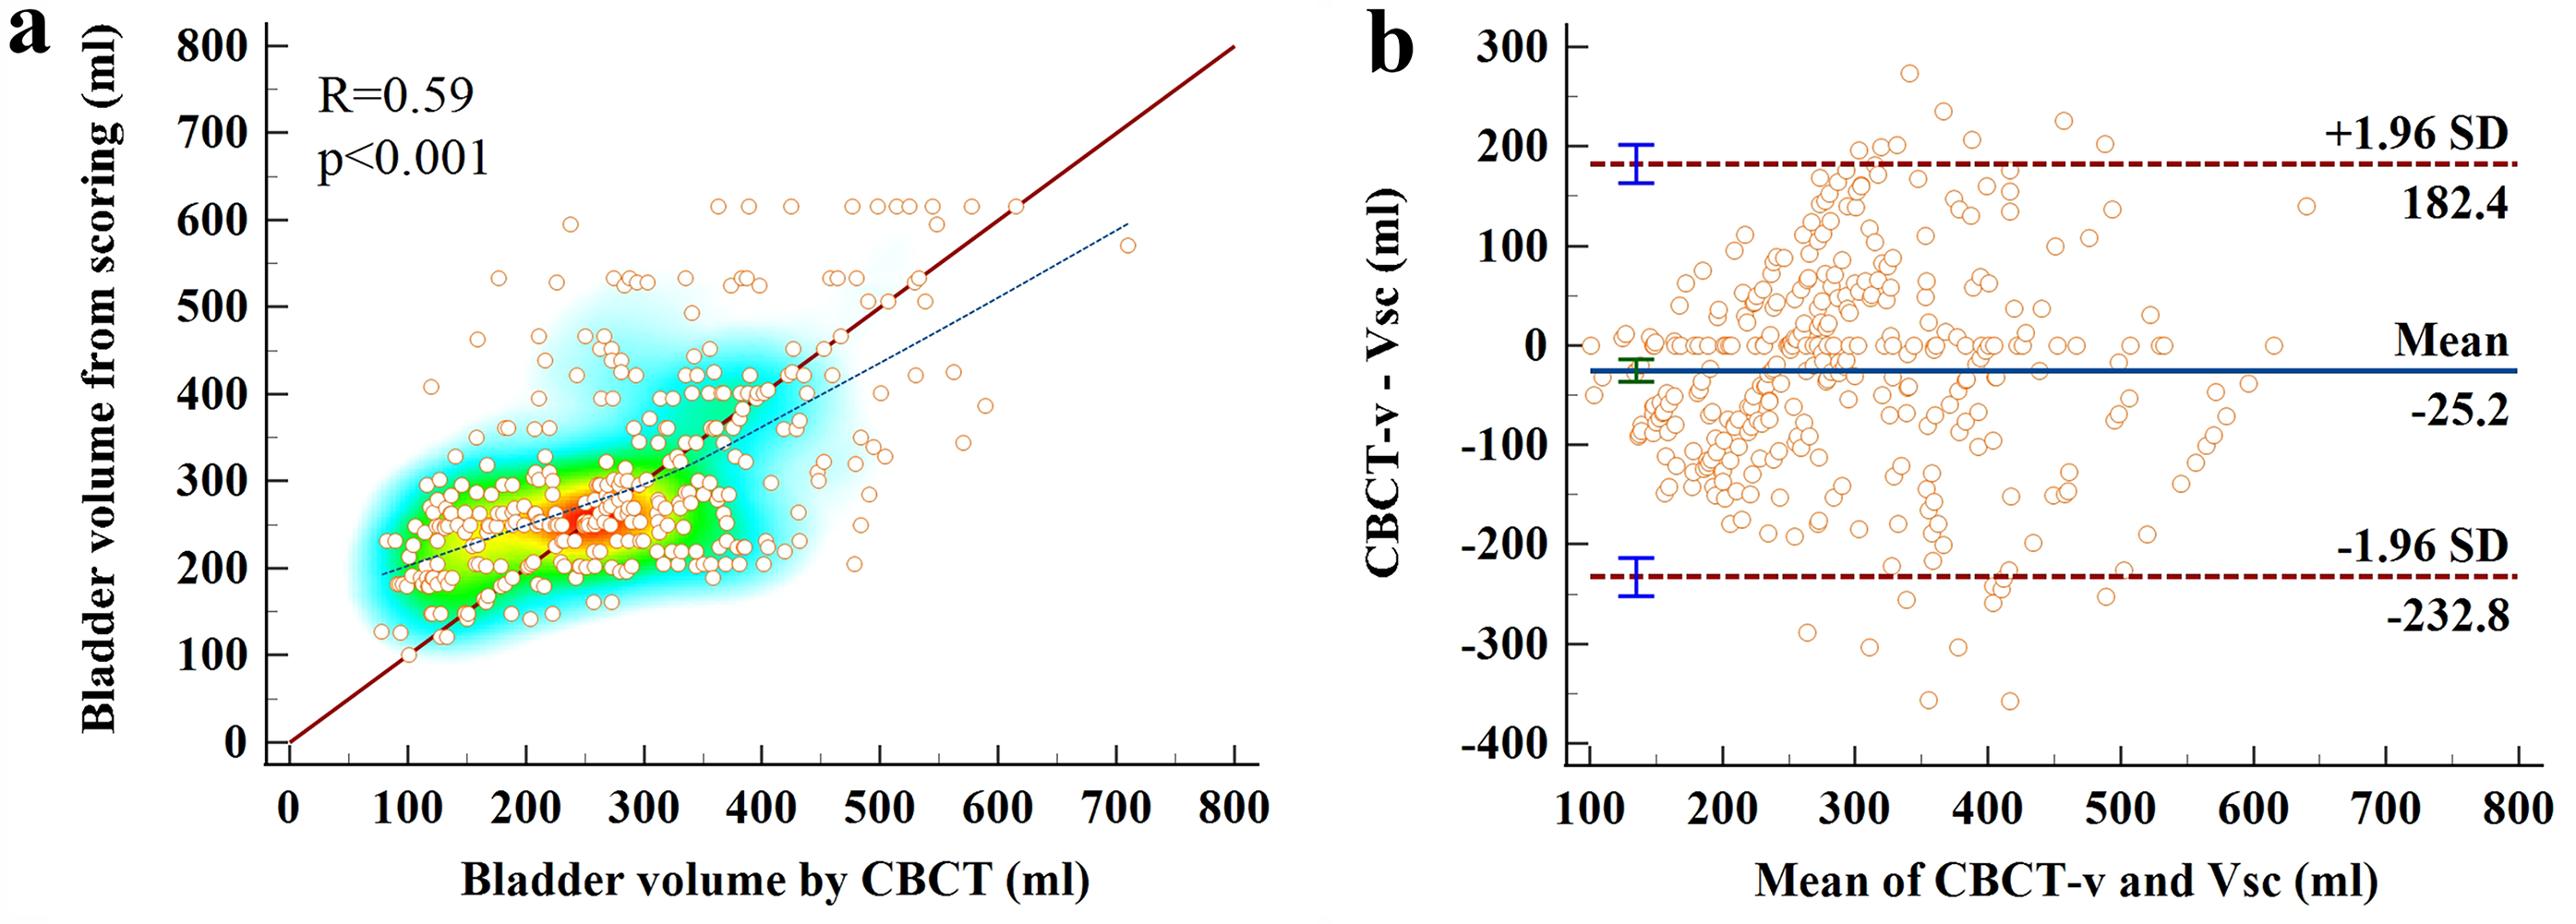
(a) Scatterplot distribution of the urinary sensory bladder volume (VSC) versus CBCT volume (R = 0.59, p < 0.001); (b) Displays Bland-Altman plots comparing the differences between urinary sensory bladder volume (VSC) and CBCT volume, with horizontal lines indicating the 95% limits of agreement, mean difference, and standard deviation (SD).
Comparison of Two Different Bladder Filling Methods
The results show that the BV consistency in Group A, which received urine volume feedback, is higher than in Group B, which did not receive feedback. Group A's CBCT-v during treatment is closer to the planned CT-v, but for both Group A and Group B, there is no significant difference between CT-v and CBCT-v, as shown in Table 3. By comparing the differences between CBCT-v and CT-v, we calculate the CBCT-v proportions within ±20%, ± 30%, and ±50% of CT-v for both patient groups, the percentages of patients in Group A were 51.20%, 66.90%, and 91.90%, while those in Group B were 26.2%, 41.1%, and 67.7%, respectively. The distribution of Group A and B percentages is depicted in Figure 4.

Percentage of CBCT-v in different ranges of CT-v in Groups A and B.
Comparison of BV Using Two Bladder Filling Methods (mL).

Abbreviations: CT-v, Bladder volume delineated on CT images; CBCT-v, Bladder volume delineated on CBCT images
Discussion
As this study exclusively focused on BV and did not investigate dose considerations, we opted to include patients with pelvic tumors necessitating bladder filling without specifically categorizing them by disease type.
Effectiveness of Two Bladder Scanners
Prior to this study, the BS Padscan HD5 was widely used in the clinic, but related studies are relatively lacking. The results of this study showed a strong correlation between BV measured by Padscan HD5 and the BV from CT and CBCT (R = 0.89, p < 0.001). Similarly, although the Padscan HDW1 is currently in the testing stage, there was also a significant correlation between the volume it measured, BSHDW1-v, and CT-v and CBCT-v (R = 0.70, p < 0.001). This result indicates that the BS Padscan HDW1 has significant clinical potential in measuring BV during RT. Consistency in BV is crucial during RT, and BS Padscan HDW1 can serve as a fast, non-invasive preliminary assessment tool. The use of Padscan HDW1 not only reduces radiation exposure from repeated CBCT scans but also improves work efficiency.
In previous studies, bladder measurement devices commonly used in pelvic tumor RT include BVI9400, BVI6100, Lilium® α-200, and Meike Palm PBSV3.2. The measurements from these devices demonstrate a significant correlation with the actual BV, showing correlation coefficients ranging from 0.74 to 0.96.11,13,14,16
In our study, two BSs were utilized each time the patient's bladder was measured. Additionally, patients were tasked with rating their urge to urinate concurrently. Consequently, the process typically took 3–5 min to complete the Padscan HD5 and Padscan HDW1 measurements. However, for patients who are obese or have a low urine output, the process may take longer to complete. This, combined with a waiting time for treatment ranging from 3–10 min, results in some deviation of the BV scanned by the bladder scanner from the CBCT and CT volumes. Hynds et al 17 reported that the mean inflow before treatment was 4.6 ± 2.9 mL/min, whereas, in Lotz et al, 18 the urine inflow was even greater than 9 mL/min. According to the data from this study, the average values for CT/CBCT-v was 280 mL, while the average for BSHD5-v was 271 mL and for BSHDW1-v was 267 mL. Based on these data, if we shorten the scanning and waiting times for treatment, the accuracy of BV measured by Padscan HD5 and Padscan HDW1 will be higher.
Calculating BV based on voided urine can be biased due to potential urine retention. Hence, we consider BV measured by CBCT or CT as the “gold standard”, despite the theoretical proximity of BV derived from contouring the inner bladder wall to actual urine volume. However, the limited differentiation of the inner wall complicates accurate volume measurement. Consequently, no distinction was made between the inner and outer bladder walls during subsequent outlining, potentially introducing bias.
Comparison of the Results of Two Different Bladder Filling Methods
In our study, we examined the agreement between CBCT-v and CT-v by comparing them in each patient across three intervals of CT-v. Based on previous research showing no significant difference in prostate location and BV size, 19 we set the maximum interval to plus or minus 50% of the CT-v. The results revealed that in Group A, the percentages of CBCT-v within ±20%, ± 30%, and ±50% of CT-v were 51.20%, 66.90%, and 91.90%, respectively, while in Group B, they were 26.2%, 41.1%, and 67.7%, respectively. In Group A, a positive correlation was observed between CBCT-v and CT-v (R = 0.66, p < 0.001), as well as in Group B (R = 0.34, p < 0.001). These findings suggest that in Group A, CBCT-v closely aligned with CT-v following urinary feedback. During treatment, Group A patients experienced a 19% reduction in average BV, declining from 310.2 mL in the first week to a mean BV of 251.1 mL at the late treatment stage. Conversely, patients in Group B exhibited an average BV reduction from 340.9 mL in the first week to 217.2 mL at the late treatment stage, representing a 36.3% average volume decrease. These specific changes are illustrated in Figure 5(a). Nakamura et al 20 reported a mean reduction in bladder volume of 38% at the end of the entire treatment, while Chang et al 21 documented a reduction in BV of 59% throughout the treatment, Bandanatham S et al 22 also reported a 21% reduction in BV during the treatment process. Pisani C et al 23 stated that treatment-induced inflammatory responses in bladder tissue, changes in bladder function, and other urotoxicities are the main causes of BV reduction.
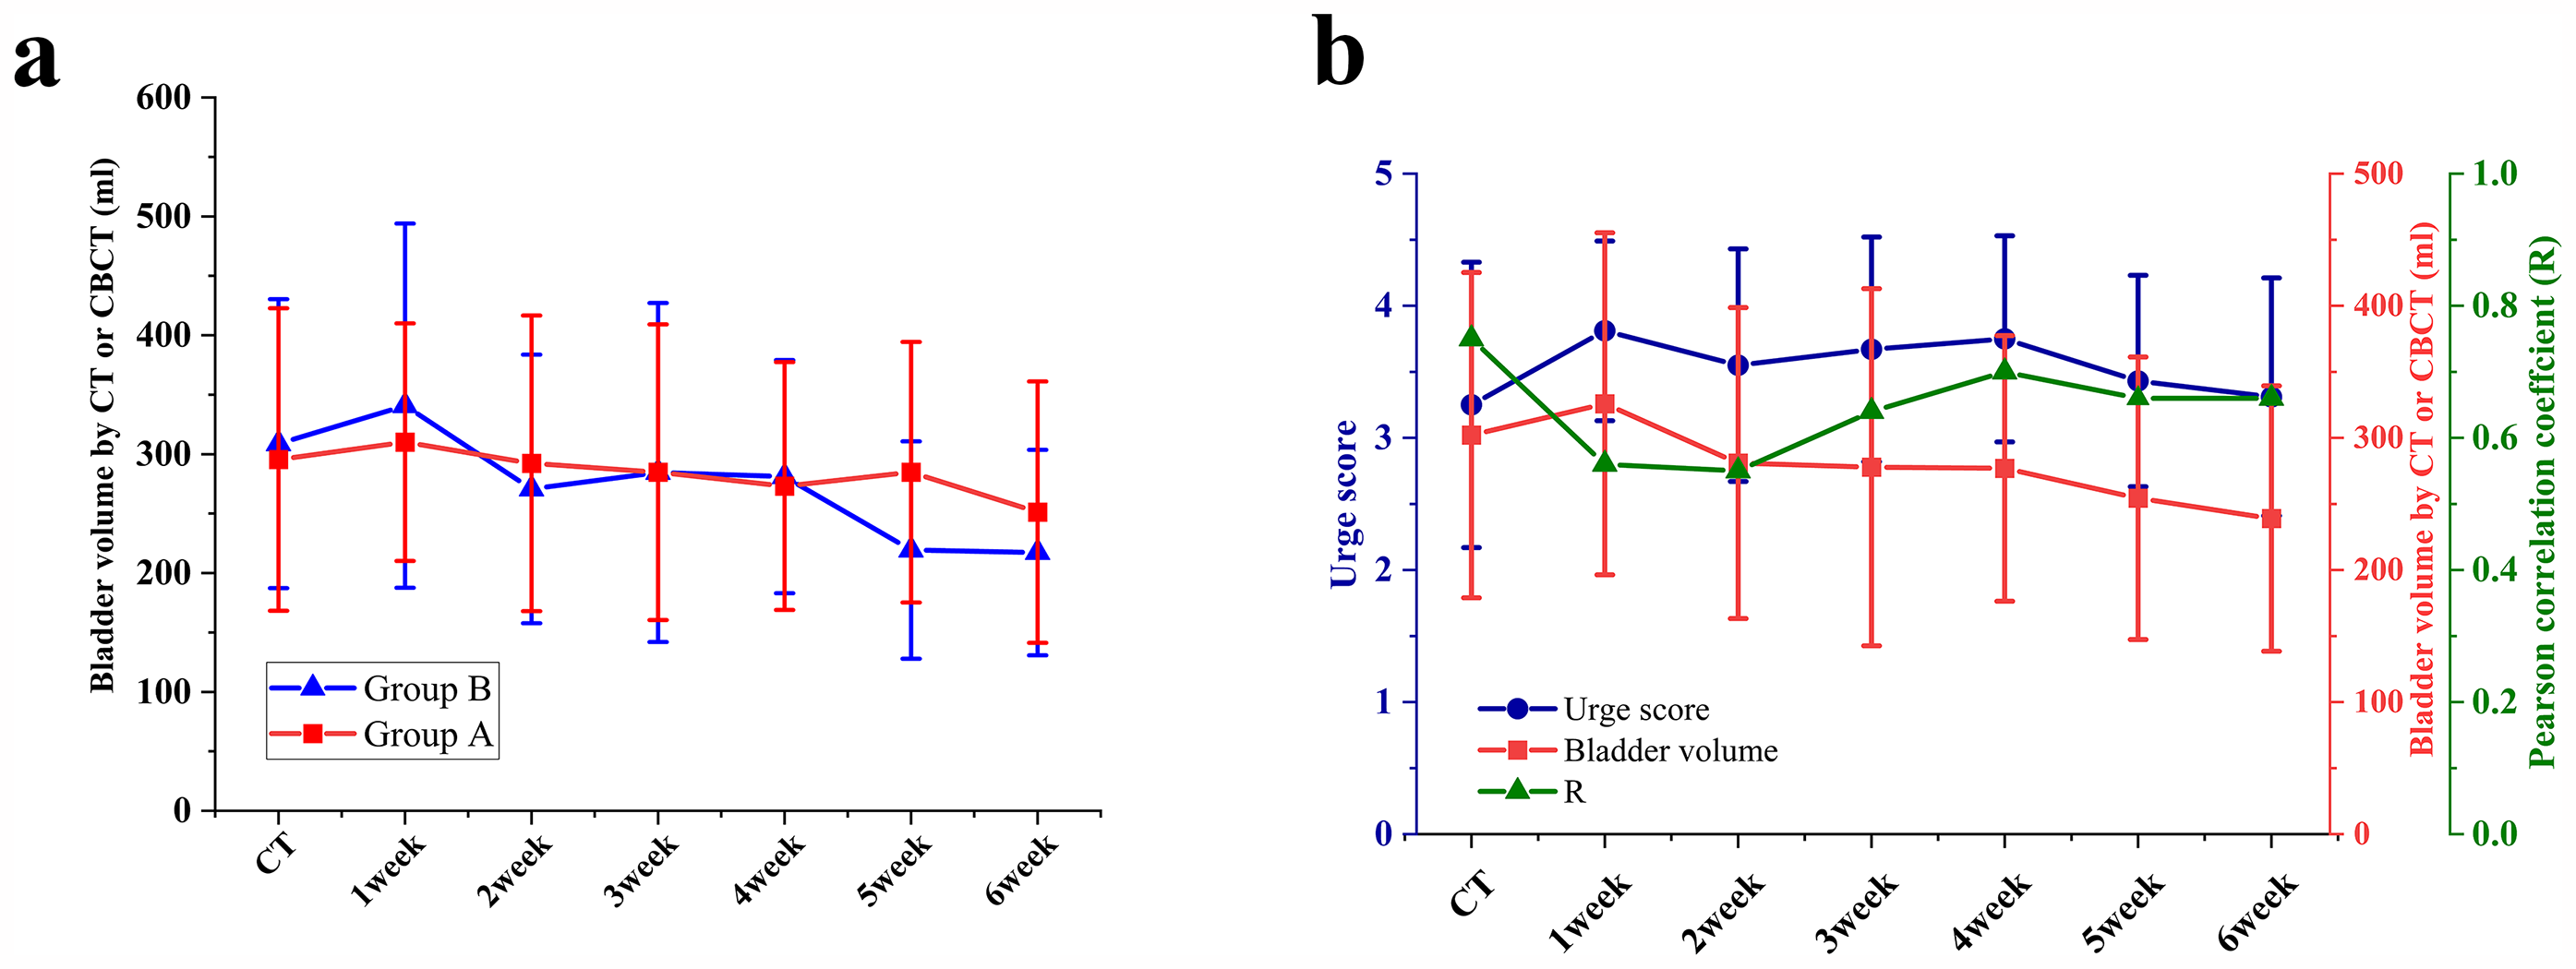
(a) Changes in bladder volume throughout radiotherapy in Groups A and B; (b) The relationship between patients’ urinary sensation scores and true bladder volume at different treatment times and the correlation between patients’ urinary scores and bladder volume were statistically significant at 1–6 weeks (all p < 0.001).
These findings imply that Group A exhibited a significantly higher percentage within different ranges compared to Group B, suggesting that the feedback mechanism effectively prompted patients to regulate bladder filling more efficiently. Cramp et al 24 noted that obtaining BV using the BladderScan method was beneficial in achieving high consistency and appropriately sized BV. Stam et al 19 provided biofeedback to 18 out of 34 patients, while the remaining 16 patients received no biofeedback. The group with biofeedback demonstrated a 7% improvement, indicating the efficacy of biofeedback in maintaining BV consistency. Other studies have also highlighted that ultrasound scanning-based biofeedback protocols are more effective in maintaining BV consistency compared to self-controlled filling protocols.21,25
Accuracy of Patient Urine Score
In our study, we explored whether patients could accurately predict bladder filling based on their urinary scores. 13 These scores were transformed into urinary sensation BV using calculation. Our findings indicated that urinary sensation scores acted as a guide to BV accuracy. Specifically, in Group A, where feedback was provided, the correlation between VSC and CBCT-v was significant (R = 0.69, p < 0.001), while in Group B, without feedback, the correlation was lower (R = 0.49, p < 0.001). This highlights the notable impact of feedback on bladder filling in pelvic tumor RT. Throughout the treatment, there was a consistent positive correlation between urine sensation score and CT-v or CBCT-v (R = 0.65, p < 0.001). The correlation between urine sensation scores and CT-v and CBCT-v from the first to the sixth week of treatment was observed as follows: R1 = 0.56, R2 = 0.55, R3 = 0.64, R4 = 0.70, R5 = 0.66, R6 = 0.66, (all p < 0.001). Detailed findings are illustrated in Figure 5(b). Notably, patients’ urinary sensation and bladder filling capacity varied throughout treatment. Initially, during planning CT, there was a strong correlation between urinary sensation and BV (R = 0.75), likely due to patients’ training in assessing their urinary sensation. However, this correlation weakened significantly after the waiting period before treatment (R = 0.56). Interestingly, the accuracy of urinary sensation improved after the first week of treatment. This may be due to the fact that after one week of treatment and through continuous feedback, patients gradually developed adaptive responses and appeared to learn how to better assess their bladder volume over time.
We evaluated the consistency between the two bladder scanners. The results showed a positive correlation between the BV (BSHD5-v and BSHDW1-v) measured by both scanners, with a strong statistical significance (R = 0.79, p < 0.001). Additionally, we measured the thickness of subcutaneous fat and muscle at the probe placement site. Pearson correlation analysis revealed no statistically significant associations between BSHD5-v and gender, fat thickness, muscle thickness, or BMI (p > 0.05). In contrast, BSHDW1-v showed no significant associations with fat thickness or BMI; however, it was significantly associated with other factors (p < 0.05).
During the treatment of prostate cancer and rectal cancer patients, the relative position of the rectum and bladder may change due to factors such as edema and inflammation, especially when the tumor is located in the lower part of the pelvis. This can lead to bladder compression, resulting in changes in the shape and volume of the bladder. For female patients with cervical or rectal cancer, the presence of the uterus may also affect the accurate measurement of BV.
In this study, the BV consistency in patients from Group B was lower than that in Group A, which may be related to individual differences, baseline health conditions, fluid balance and hydration, the cumulative effects of treatment side effects, psychological factors of patients, and the type of food consumed on the day of treatment, these factors may result in varying rates of urine flow into the bladder. After drinking 500 ml of water, Group B patients waited for 1 h, but did not provide feedback on their urine volume, which may have led to differences in BV among individuals. Therefore, future studies may need to more carefully consider these variables to improve the consistency and reliability of experimental results.
Conclusions
Our research confirms the viability of patients using either the Padscan HD5 or Padscan HDW1 bladder scanners to measure bladder volume before treatment, with Padscan HD5 showing superior accuracy and consistency. We found that the urinary feedback method consistently maintained better bladder volume consistency throughout radiotherapy compared to the time-waiting method. Additionally, even without a bladder scanner, biofeedback through urine sensation scoring can guide patients in maintaining bladder volume consistency.
Footnotes
Abbreviations
Ethical Considerations
This study was approved by the Ethics Committee of West China School of Medicine, Sichuan University (No. 20211568). All patients signed an informed consent form before radiotherapy.
Author Contributions/CRediT
Haitao Wang designed the study, collected data, analyzed data, and drafted the manuscript. Lu Zeng, Quan Zhong and Zhonghua Deng helped collect and analyze the data. Renming Zhong designed the study, revised and finally approved the manuscript. All authors approved the final version of this manuscript.
Funding
This work was supported by the 1.3.5 project for disciplines of excellence–Clinical Research Incubation Project, West China Hospital, Sichuan University (No: 2021HXFH029) and the Science and Technology Support Program of Sichuan Province, China (2021YFQ0065).
Conflicting Interests
The authors declared no potential conflicts of interest with respect to the research, authorship, and/or publication of this article.