
Abstract
Introduction
Head and neck cancer (HNC) is responsible for almost 6% of all cancers, 1 with over 830 000 new cases and over 430 000 deaths globally each year. 2 Alarmingly, the incidence of HNC is projected to rise by 30% annually by 2030.3,4 HNC encompasses anatomical sites including the oral cavity, pharynx, hypopharynx, larynx, and nasal cavity. The oral cavity region includes buccal mucosa, lip, mouth floor, hard palate, anterior tongue, retromolar trigone, and upper/lower gingiva. The pharynx region consists of the nasopharynx, and oropharynx (tonsils area, soft palate, posterior pharyngeal wall, and tongue base.) The hypopharynx includes the bottom of the throat and pyriform sinuses. The larynx region consists of the glottic, subglottic, and supraglottic larynx. The nasal cavity and paranasal sinuses include ethmoid, maxillary, frontal sinuses, and sphenoid. HNC includes different histological subtypes while squamous cell carcinoma (SCC) is the most prevalent form, constituting 90% of cases. 3 The traditional tissue biopsy method for HNC cannot track disease progression or may increase tumor metastasis potential due to misleading results based on differences in cell morphology, and leads towards poor survival and prognosis. 5 Despite advances in treatment, patients with advanced-stage HNC show a 5-year survival rate of less than 60% with poor prognosis, 6 suggesting the need for new biomarkers to improve prognosis and treatment outcomes. Liquid biopsy which is a minimal invasive approach using biofluids of blood and urine samples, holds potential to diagnose and real time-monitoring of cancer. 7 These biofluids contained some biological carriers whose secretion rate changed due to disease initiation and pathogenesis. Exosomes are important for properly tracking disease progression among these biological carriers.
Exosomes are a subclass of extracellular vesicles with a size range of 40-160 nm. These vesicles are secreted by both normal and cancerous cells. 8 Exosomes play roles in transfer of cargo materials like proteins, DNA, mRNA, and microRNAs (miRNAs) from donor cells to recipient cells, thus playing a role in intercellular communication. 9 Exosomes may also play a role in the deregulation of different pathways or change in the cellular fate of neighboring cells through exosomal content (specifically miRNAs) released by specific cells. This showed a possible role of exosomes in the progression, initiation, or drug resistance of cancer cells. 10 Exosomal miRNAs have been linked with phenotypes of several cancers in different studies11,12 indicating their potential as diagnostic biomarkers in HNC. 13
MicroRNAs (miRNAs) play crucial roles in the development of different cancers. This includes the dysregulation of the miRNA-17-92 cluster, which has been studied in different cancers.11,12 The two important members of the miR-17-92 cluster, miR-20 and miR-17-5p, are also called the miR-17 family based on sequence composition. 14 Deregulation of miR-17 has been reported in HNC 15 and miR-20 in HPV-positive oropharyngeal carcinoma of HNC. 16 Both miRNAs of the miR-17 family have equivalent functions by controlling the same target genes as their same seed sequences. 17 It has been reported that miR-20a and miR-17 directly target TGFBR2 and regulate the TGF-signaling pathway 18 that controls several cellular processes including cell cycle arrest, epithelial to mesenchymal transition, apoptosis, and migration. 18 The study has reported the expression deregulation of TGFBR2 resulted in an aggressive type of HNC. 19 Deregulated expressions of miRNAs have been studied and reported in HNC patients. Still, fewer studies are available on the role of these exosomal miRNAs in HNC. In this study, miR-17-92 cluster microRNAs (miR-20a and miR-17) and target gene TGFBR2 were selected for analysis. Expressions of miR-20a, miR-17, and TGFBR2 were analyzed in serum exosomes of HNC patients and compared with healthy controls. The expression results were also correlated with the clinical parameters to elucidate the potential of exosomal miRNAs as diagnostic and prognostic biomarkers for HNC patients.
Methods
Samples Collection and Clinical Data
The samples of HNC patients and healthy individuals (taken as controls) were collected over 2 years from May 2021 to June 2023 from collaborating hospitals. The current study was authorized by the institutional ethical review committee of the university and the collaborating hospitals. GPower sample size calculator (GPower 3, The university of Dusseldorf, Dusseldorf, Germany) software was utilized to calculate the sample size; α was set to 0.05, and 1-β to 0.90. The current research included 400 verified HNC and 400 age- and gender-matched healthy individuals as control samples as shown in Supplementary Table S1. Samples were taken only after informed consent from all participants.
Demographic parameters along with clinical records were collected from patients questionnaires and histopathological reports. In present study cohort, AJCC staging was followed to assess the TNM staging and further categorized into early and advanced stages. Tumor stages (T-stage) were divided into early T-stages (T1 and T2) versus advanced T-stages (T3 and T4). Lymph node stages (N-stage) were compared between early N-stages (N0) and advanced N-stages (N1-N3), while metastasis stages were divided into no-metastasis (M0) versus metastasis-stage (M1). In the case of clinical stages, patients were also divided into two stages including early clinical stages (C1-C2) and advanced clinical stages (C3-C4), as shown in Supplementary Table S1. The smoking status of HNC patients was categorized based on self-reported history and mentioned in Supplementary Table S1. The participants were asked about their smoking history, current smoking status, and the number of packs per day. This study has included three types of tobacco use which are paan, naswar and cigarets. As intake of these agents varies from individuals to individuals, a broad definition of smoking was introduced here. Alcohol use is another significant risk factor for HNC but most of the participants were not drinking or were unwilling to respond to this question.
Furthermore, the patients were categorized based on their treatment status at the time of sample collection. The patients who were treated with any form of therapeutic strategy including surgery, radiation, or chemotherapy, were classified as treated patients. Patients who were newly diagnosed and had not yet been treated with any form of therapeutic strategy were classified as untreated patients. The data on the treatment status of HNC patients is mentioned in Supplementary Table S1.
The control and patient samples with other diseases, such as hypertension, diabetes, familial diseases, or suffering from conditions other than HNC, were excluded. For serum extractions, 2 ml of blood was taken from patients and healthy controls. Blood samples were spun at 3000 and 10 000 × g for 15 and 20 min at 4 °C, followed by serum storage at −80 °C.
After collecting samples, we follow up with the patients for 5 years (starting from the time of diagnosis). Half of the patients died during the follow-up duration with no report of recurrence. So far 192 patients have died, and the remaining 208 patients have been in good health according to follow-up results.
Exosome Purification
For exosome purification, a total exosome isolation kit (provided by Invitrogen, USA) and ultracentrifugation methods were used for exosomes extraction from HNC serum samples and controls as described previously. 20 The first step was use of a total exosome isolation kit, following the guidelines supplied by the manufacturer. In brief, the frozen serum samples were thawed in a water bath set at a temperature of 25 °C. After this step, samples were centrifuged for 30 min at 2000 × g to enhance the purification process by removing the cellular debris and then subjected to RNase-free tube. The 500 µl clarified serum was mixed with 100 µl of exosome extraction reagent and this serum/reagent mixture was gently vortexed and then incubated for 30 min. Next, the specimens underwent centrifugation at 10 000 × g for 10 min, following the supernatant was removed. Then the pellet was dissolved in PBS and the second step exosome pellet was purified by transferring it into 1.5 mL polyallomer ultracentrifugation tubes (Beckman Coulter, Fullerton, CA). Then the samples were ultracentrifuged at 110 000 × g (Beckman Coulter Opima Max) for 1 h at 4 °C. Exosome pellets were washed with PBS and the ultracentrifugation step was repeated. The pellets of exosomes were then resuspended in 100 µl of 1 × PBS and stored at −80 °C for further downstream analysis.
Transmission Electron Microscopy (TEM)
The exosome pellets were diluted at a ratio of 1:10 ratio in PBS and the morphology of exosomes was captured through a transmission electron microscope (TEM) as described previously. 20 5 µl of exosome sample was applied on carbon-coated grids (EMS www.emsdiasum.com) which was hydrophilic through the application of 30 s glow discharge (25 mA). Extra liquid was wiped away through Whatman 1 filter paper followed by briefly floated in water to remove salt or phosphate, blotted once more with filter paper, and stained for 20-30 s with 0.75% uranyl formate (EMS catalog 22451). Extra stains were wiped with filter paper and grids were observed in JEOL 1200 EX TEM.
Immunogold Labeling
Exosome confirmation was performed through immunoelectron microscopy. 20 5 µl of exosome sample was loaded on the carbon-coated grid. Exosome blocking was performed through 1% BSA for 10 min and then immunolabelled with primary antibody, anti-human CD63 (BD Pharmingen 556019) for 30 min. The sample was washed in PBS for 10 min, followed by gold-labeled secondary antibody (Abcam ab6709) for 20 min. The sample was washed in PBS and then in water for 5 and 10 min respectively. Whatman #1 filter paper was used to remove excess liquid and then samples were subjected to staining with 0.75% uranyl formate for 15 s. Excess liquid was removed with filter paper and grids were observed in JEOL 1200 EX transmission electron microscope.
Nanosight Nanoparticle Tracking Analysis (NTA)
Nanosight LM10 system (Nanosight Ltd) was used to calculate the mean size and concentration of isolated exosomes. 20 The exosome samples were diluted at 1:70 in sterile-filtered PBS. Exosomes were illuminated through a blue laser (405 nm) and their Brownian movement was recorded for 60 s. The size distribution and nanoparticle concentration were calculated using Nanosight particle tracking software. During analysis, all settings were kept the same and a minimum of three measurements were taken for each sample to calculate the representative measurement.
ELISA
The identification and quantification of exosomes were performed utilizing ExoELISA-Ultra complete kits (System Biosciences, Inc.) which enable the detection of the exosomal protein markers including CD9, CD63, and CD81. ELISA was performed according to manufacturer instructions as described previously. 20 Briefly, exosome samples were diluted using a coating buffer and prepared as per the manufacturer's instructions. Then 50 µl of protein buffer and exosome specimens were added in microtiter wells and incubated at 37 °C for an hour after covering the wells. The wells were emptied by inverting followed by three times washing with 100-200 µl 1 × wash buffer. Next, 50 µl of CD9, CD63, and CD81 diluted primary antibodies were introduced to each well followed by 60 min of incubation at 37 °C and then the plate was further washed three times with 1 × wash buffer. Then, 50 µl of diluted secondary antibody (1:5000 in blocking buffer) was poured into each well. The plate was again incubated for 60 min and rewashed. The assay was then ceased by adding 50 µl of colorimetric substrate (super sensitive TMB ELISA) and 50 µl of stop buffer. The protein samples were then quantitated using a microplate reader (AMP Platos R II), following optical density (OD) at 450 nm. The resulting values were plotted against the standard curve provided by the kit. The samples were analyzed in triplicates and for each concentration (pg/ml), results were reported as mean ± SD.
RNA Isolation from Serum Exosomes
Exosome pellets were mixed with TRIzol reagent (Invitrogen, CA, US) treatment according to manufacturer's guidelines in order to extract total RNA. 20 In short, a volume of 1 milliliter of TRIzol reagent was combined with 200 µl of chloroform and poured into the samples. Following centrifugation at 12 000 × g at 4 °C for a duration of 15 min, the resulting supernatant from each sample was added in separate eppendorf and mixed with 500 µl of isopropanol for a duration of 10 min at −20 °C. This step was repeated with centrifugation at 12 000 × g at 4 °C for 10 min and then supernatants were discarded. Subsequently, RNA pellets underwent washing process utilizing 75% ethanol, followed by resuspension in 10 µl of nuclease-free water. After RNA isolation, the concentration and purity of isolated RNA were evaluated through a nanodrop spectrophotometer (Thermo Scientific) through measuring OD at 260/280 nm. Subsequently, RNA samples were stored at −80 °C for further utilization.
cDNA Synthesis and Expression Analysis
The RevertAid first-strand cDNA synthesis kit (Thermo Scientific) was used to prepare the reverse transcript mixture for complementary DNA (cDNA) following the instructions provided by the manufacturer. Primers of miR-17, miR-20a, U6, TGFBR2, and β-actin were synthesized using PrimerQuest Tool (Integrated DNA Technology, IA, USA). Detailed primer sequences with optimized annealing temperatures are listed in Supplementary Table S2. The 10 µl reaction mixture for each molecule was prepared with 1 µl of cDNA of each sample along with each forward and reverse primer, 4 µl of dye (2x Sybr Green, Invitrogen), and afterward 4 µl of PCR water. Step-one-plus real-time PCR instrument (Applied Biosystems, MA, US) was used for quantitative PCR of related gene and selected miRNAs. The PCR reaction was carried out using 96 well plates and initial denaturation at 95 °C for 6 min, then 40 cycles of 95 °C for 30 s, and at the final step of annealing temperature for 30 s. The resulting data was analyzed with the 2−
Oxidative Stress Measurement
Oxidative stress levels in isolated exosomes of HNC patients compared to controls were evaluated using the ELISA as reported by Hussain et al. 22 Oxidative stress was assessed by (i) analyzing the levels of antioxidant enzyme Peroxidase level (POD) and by (ii) measuring the ROS, 8-Oxoguanine (8-OHdG) in isolated exosomes of HNC patients and controls. Peroxidase level (POD) was measured using the peroxidase ELISA kit (Abcam, USA). The 8-Oxoguanine (8-OHG) level was measured using the available ELISA kit of 8-hydroxy 2 deoxyguanosine (Abcam, USA). The concentrations of antioxidant and reactive oxygen species (ROS) levels were then quantitated by a microplate reader (AMP Platos R II) at OD 450 nm. The resulting values were then plotted against a standard curve. The samples were analyzed in triplicates and reported as mean ± SD for each concentration (pg/ml).
Statistical Analysis
The statistical tests used in the current study are one-way ANOVA and the student t-test assessed significance between groups. Spearman correlation was utilized for clinical correlations. ROC curve and area under the curve (AUC) were used to check the diagnostic ability and accuracy of chosen miRNAs and genes by measuring sensitivity and specificity. Furthermore, Kaplan Meier and Cox regressions were used to check the prognostic significance of selected molecules in HNC patients. Statistical analysis was performed using SPSS (IBM SPSS, version 26) and GraphPad Prism (version 8.0.2, US). p < .05 was taken as statistically significant.
Results
Demographic and Clinical Parameters of the Study Cohort
The study cohort consisted of 400 HNC patients and 400 age and gender-matched healthy controls were used in the present study. The demographic and clinical parameters of the current study cohort included age, gender, anatomical site of cancer (pharynx, oral cavity, and larynx), smoking status, grades of cancer (poorly, moderately, and well-differentiated), T-staging (T1-T4), N-staging (N0-N3), metastatic stages (M0 and M1) and treated versus untreated HNC patients as shown in Supplementary Table S1.
Serum Exosome Characterizations
Exosomes were isolated from serum samples obtained from HNC patients and control samples. The characterization of isolated exosomes was carried out using various techniques including NTA, TEM, TEM-Immunolabelling, and ELISA. The results are shown in Figure 1. TEM was used to characterize morphology and negative staining of purified exosomes revealed a spherical shape with anticipated exosome size range (30-150 nm) with membrane integrity (Figure 1A). Immunogold labeling was used to confirm the protein surface marker specific to CD63, a marker for the identification of exosomes. Positive immunolabelling was observed using Transmission Electron Microscope and the results are shown in Figure 1B. NTA was used for the size distribution of exosomes and the number of particles per µL. Brownian movement of exosomes was recorded, and measurements showed the model size of 100 nm, confirming particle populations within exosome size range (Figure 1C). The positive confirmation of isolated exosomes was obtained through ELISA using exosome-specific protein markers including CD9, CD63, and CD81. The results are shown in Figure 1D.

Exosomes characterizations (A) TEM negative staining of exosomes revealed sphere shaped morphology of serum exosomes (scale bar = 100 nm). TEM micrograph showed exosomes size with an acceptable size range. (B) CD63 immunogoldlabelling of exosomes and imaged through TEM. (C) Size distribution and concentration of exosomes analyzed with NTA of combining serum samples. (D) ELISA-based detection of serum exosomal protein surface markers CD9, CD63 and CD81. For each concentration (pg/ml) of three proteins, the results are shown as mean ± SD.
Relative Expression of Exosomal miR-17 in HNC
The expression level of exosomal miR-17 was analyzed and compared in HNC patients and controls. Significantly reduced expression of miR-17 (average value 0.12 ± 0.5) was found in HNC patients (p < .0001) versus control samples (Figure 2A). This miR-17 expression was analyzed statistically in different demographic and histological categories of HNC patients.
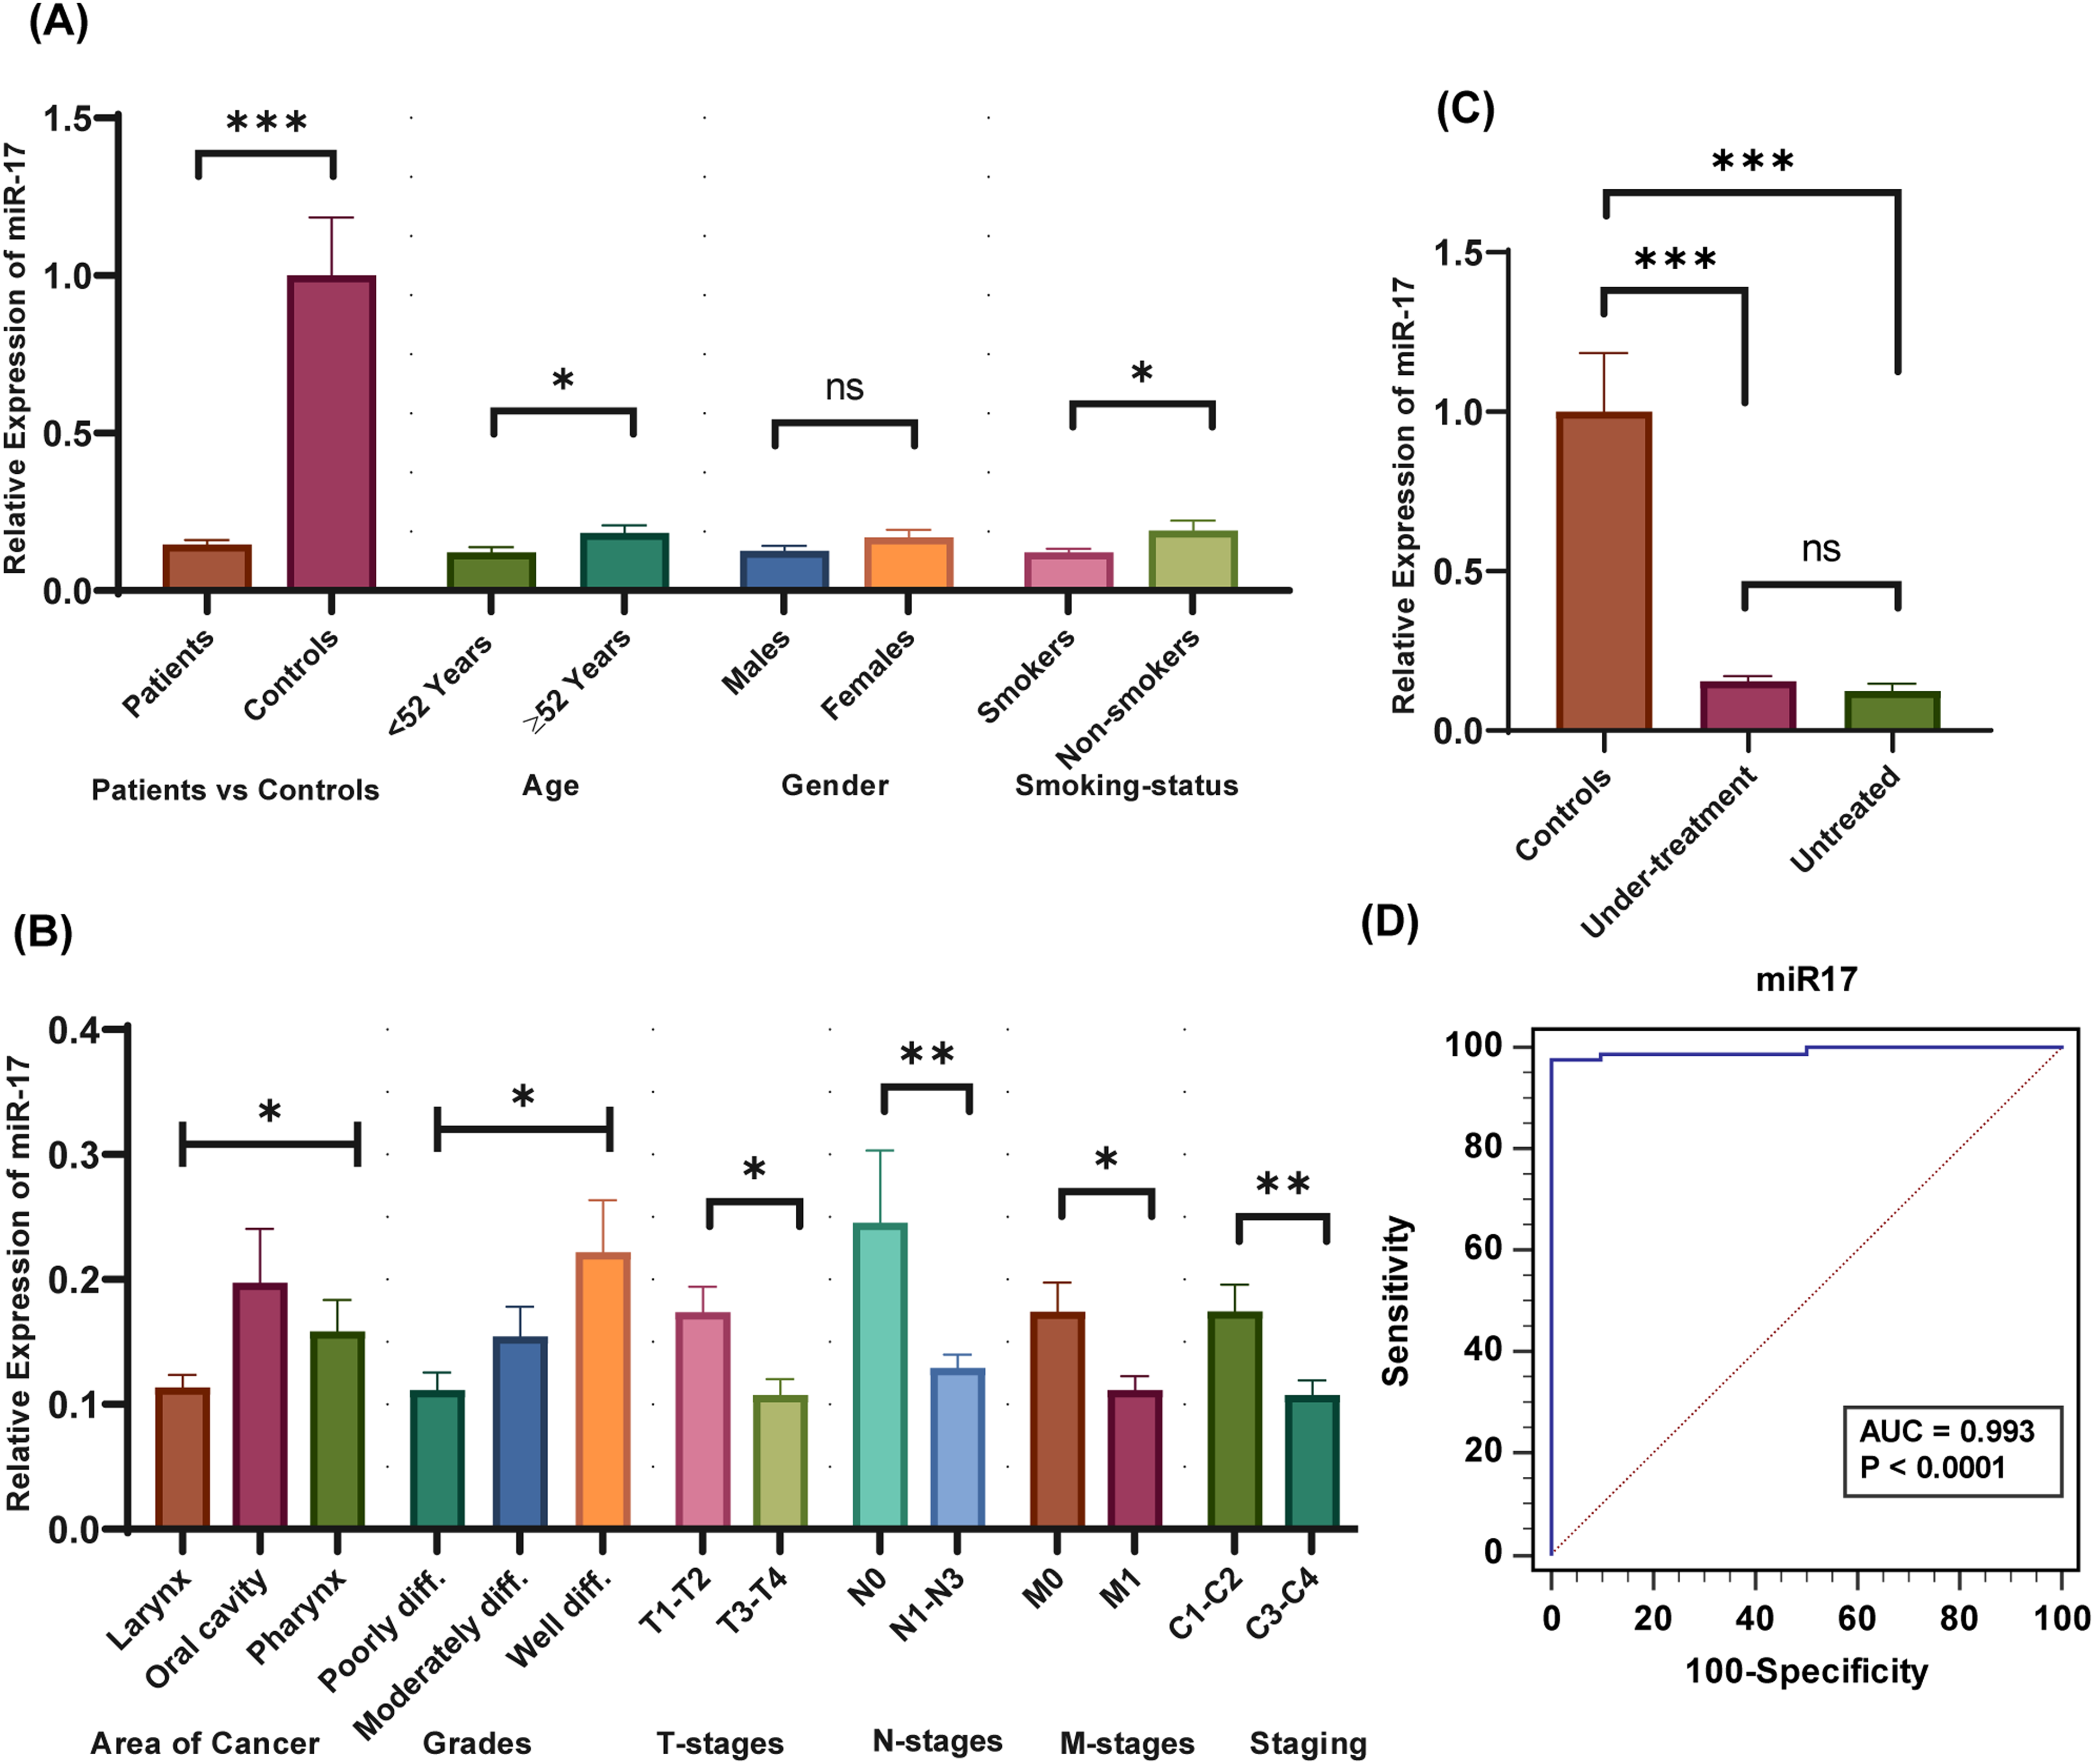
Expression analysis of miR-17 in exosomes of HNC patients and controls. (A) Expression levels of miR-17 in HNC patients versus controls and in demographic parameters. (B) miR-17 expression analysis in clinicopathological parameters of HNC. (C) miR-17 expression levels in HNC treated versus un-treated versus controls. (D) AUC-ROC analysis of miR-17 in HNC patients.
When analyzed a significant downregulation was observed in patients with <52 years mean age (p = .024) and smoker patients (p = .0154). In the case of smoking status in controls, a significantly increased level of miR-17 (p = .0444) was observed in smoker controls compared to nonsmoker controls, as shown in Supplementary Figure 1A. In histopathological parameters, significant downregulation was observed in laryngeal cancer (p = .0429), poorly differentiated cancers (p = .0264), advanced T-staging (p = .0157), advanced N-stages (p = .0013), M1-stage (p = .0185) and aggressive clinical stage (p = .0094). These results are shown in Figure 2B.
Patients were also divided into treated versus untreated and when analyzed non-significant decreased expression was assessed in untreated patients (p = .3610) (Figure 2C). Figure 2C also shows that significant downregulation was assessed in under-treatment patients (p < .0001) and untreated patients (p < .0001) when compared with respective controls.
Relative Expression of Exosomal miR-20a in HNC
Exosomal miR-20a was found to be significantly downregulated in HNC patients versus controls (p = .0003) (Figure 3A). Significant downregulated expression of miR-20a (average value 0.60 ± 0.45) was observed in HNC patients for gender (female vs male) (p = .0448), and smoker patients (p = .0209), as shown in Figure 3A. In the case of smoking status in controls, a nonsignificant difference in miR-20a level (p = .3152) was observed in smoker controls compared to nonsmoker controls, as shown in Supplementary Figure 1B. In clinical characteristics of the study, exosomal miR-20a was significantly downregulated in the oral cavity subtype of HNC (p = .0002), poorly differentiated cancers (p = .0156), advanced T-stages (p = .0046), advanced N-stages (p = .0191), metastatic-phase (M1) (p = .0093) and aggressive clinical phases(p = .0104) (Figure 3B). Non-significant downregulation was observed in untreated versus treated HNC patients (p = .0689) and under-treatment patients versus controls (p = .1318) (Figure 3C). At the same time, significant downregulation was observed in untreated patients versus controls (p = .0373) (Figure 3C).

Expression analysis of miR-20a in exosomes of HNC patients and controls. (A) miR-20a expression levels in HNC patient's versus controls and in HNC demographic parameters. (B) miR-20a expressions in clinical parameters of HNC. (C) miR-17 expression levels in HNC treated versus un-treated versus controls. (D) AUC-ROC analysis of miR-20a in HNC patients.
Relative Expression of Exosomal TGFBR2 in HNC
Exosomal TGFBR2 was found significantly upregulated in patients of HNC when compared with controls (p = .0005) (Figure 4A). TGFBR2 was significantly upregulated in smoker patients (p = .0025) (Figure 4A). In the case of smoking status in controls, a nonsignificant difference in TGFBR2 level (p = .4150) was observed in smoker controls compared to nonsmoker controls, as shown in Supplementary Figure 1C. TGFBR2 was also observed upregulated in poorly differentiated grades (p = .0199) and advanced clinical stages (p = .0128) compared to early clinical stages HNC patients (Figure 4B). Significant upregulation of TGFBR2 was observed in advanced T-stage (p = .0130), advanced N-stage (p = .0107), and metastatic stage (M1, p = .0092) (Figure 4B). Moreover, significant upregulation of TGFBR2 was found in under-treatment (p = .0002) and untreated HNC patients versus controls (p = .0031) as shown in Figure 4C.

Expression analysis of TGFBR2 in exosomes of HNC patients and controls. (A) Expression Analysis of TGFBR2 in exosomes of HNC patient's versus controls and in HNC demographic parameters. (B) TGFBR2 expressions in clinical parameters of HNC. (C) TGFBR2 expressional results in HNC treated versus un-treated versus healthy controls. (D) AUC-ROC analysis of TGFBR2 in HNC patients.
Correlation Between Exosomal miR-17, miR-20, TGFBR2, Demographic and Clinicopathological Parameters
Spearman correlation was used to analyze gene-gene, gene-parameter, and parameter-parameter interactions. These results are shown in Table 1. In the current study, a significant negative correlation was observed between smoking and gender (r = −0.442; p < .01), smoking, and types of HNC (r = −0.209; p = .036). Table 1 shows a significant positive correlation between N-stages and T-stages (r = 0.345; p < .01), M-stages and T-stages (r = 0.294; p = .003), M-stages and N-stages (r = 0.283; p = .004). A significant negative correlation was observed in cases of gene-parameter including miR-20a and smoking (r = −0.241; p = .015), TGFBR2, and M-stages (r = −0.216; p = .030). In gene-gene correlation, a positive significant correlation was identified between miR-20a and miR-17 (r = 0.534; p < .01). However, a negative correlation was observed between TGFBR2 and miR-17 (r = −0.240; p = .015).
Spearman Correlation Between Exosomal miR-17, miR-20, TGFBR2, Demographic and Clinical Parameters of HNC Patients.

** Correlation is significant at the 0.01 level (2-tailed).
* Correlation is significant at the 0.05 level (2-tailed).
ROC Curve Analysis of Exosomal miR-17, miR20a, and TGFBR2
ROC curve analysis was performed for exosomal miR-17, miR-20a, and TGFBR2. The results of ROC curve analysis are presented in Figures 2 to 4. The area under the curve (AUC) for miR-17 was found 0.993 with 97.80% sensitivity and 100% specificity (95%CI: 0.952-1.000; p < .0001) in HNC patients (Figure 2D). miR-20a showed 0.743 AUC (sensitivity: 47.25; specificity: 100; 95%CI: 0.646-0.825; p = .0013) (Figure 3D). The AUC for TGFBR2 was 0.831 (sensitivity: 0.33; specificity: 100; 95%CI: 0.743-0.898; p < .0001) (Figure 4D).
Kaplan Meier Analysis
Deregulated expression of selected exosomal miRNAs was correlated with the survival rate of patients, using Kaplan Meier analysis. The results are shown in Figure 5. In Kaplan Meier analysis expression levels of microRNAs and related gene were classified into downregulation and upregulation based on expression optimal cutoff values. These optimal cutoff values were determined using the X-tile program. The downregulation of exosomal microRNAs, miR-17 (p = .0318), and miR-20a (p = .0144) correlated with significantly reduced survival of patients (Figure 5A and B). However, increased expression of TGFBR2 gene (p = .0056) was found associated with significantly reduced survival (Figure 5C).

Survival analysis (A) Kaplan Meier analysis of miR-17 in serum exosome of HNC patients. (B) Kaplan Meier analysis of miR-20a in serum exosome of HNC patients. (C) Kaplan Meier analysis of TGFBR2 in serum exosome of HNC patients. 0 show upregulation and 1 show the downregulation of selected microRNAs and gene in serum exosome of HNC patients. DF is degree of freedom.
Cox Regression Analysis of Selected Molecules in HNC Patients
Univariate and multivariate Cox regression was used to confirm the results of Kaplan Meier analysis. The results are given in Table 2. Univariate Cox regression analysis revealed that dysregulation of miR-17 (HR = 1.64; p = .01), miR-20a (HR = 1.74; p = .01), and TGFBR2 (HR = 2.86; p = .005) was correlated with overall decreased survival of patients (Table 2). The analysis also showed that clinical stage (HR = 2.32; p = .003), T-stage (HR = 2.17, p = .01), N-stage (HR = 2.66; p = .007), M-stage (HR = 4.11; p = .0001) and advance grade (HR = 2.21; p = .004) was associated with overall reduced patient survival (Table 2).
Univariant and Multivariant cox Regression Analysis of Exosomal miRNAs in HNC Patients.

Multivariate Cox regression analysis suggested that deregulation of exosomal microRNAs miR-17 (HR = 5.62; p = .0001), miR-20a (HR = 4.91; p = .0001), and TGFBR2 (HR = 5.87; p = .0001) was correlated with overall reduced patient survival (Table 2). The analysis also showed that the clinical stage (HR = 3.29; p = .003), T-stage (HR = 3.61; p = .001), N-stage (HR = 2.98; p = .005), M stage (HR = 3.91; p = .001), and grade (HR = 4.36; p = .0001) were found as independent prognostic parameters in HNC patients.
Oxidative Stress Evaluation in Exosomes of HNC Patients
Oxidative stress was evaluated in exosomes of HNC patients versus controls by measuring Peroxidase level (POD) and 8-Oxoguanine (8-OHdG) levels. The results are shown in Figure 6. Figure 6A revealed, a significantly decreased level of peroxidase level (POD) in exosomes of HNC (p < .0001) patients compared to controls. POD levels were associated with the clinical characteristics of HNC patients. Figure 6B shows the significantly decreased levels of POD in advanced clinical stages (p < .0013), late T-stages (p < .0023), advanced N-stages (p < .0003), metastatic stage (p < .0006) and in poorly differentiated grades (p < .0004). POD also showed significantly decreased levels in treated patients (p = .0007) versus untreated HNC patients. Figure 6C shows the significantly decreased level of POD in patients of different age groups (<52 years vs ≥52 years; p < .01) and smoking status (smokers vs nonsmokers; p < .01). Non-significant decrease in POD level was observed in the case of gender (males vs females; p = .16), as shown in Figure 6C.

Measurement of oxidative stress in exosome of HNC patients (A) level of antioxidant enzyme, peroxidase (POD) in exosome of HNC patients compared to controls. (B) Association of POD levels with clinical characteristics of HNC patients. (C) ROC curve analysis of POD in exosome of HNC patients compared to controls. (D) 8-Oxoguanine (8-OHdG) levels in exosome of HNC patients compared to controls. (E) Association of 8-OHdG levels with clinical characteristics of HNC patients. (F) ROC curve analysis of 8-OHdG in exosome of HNC patients.
In the case of 8-Oxoguanine level, a significantly increased level was observed in exosomes of HNC patients (p < .0001) versus controls (Figure 6E). In association with clinical parameters, 8-OHdG showed significantly increased levels in advanced clinical stages (p < .0001), advanced T-stages (p < .0001), advanced N-stages (p = .0012), metastatic stage (p < .0001) and in poorly differentiated grades (p < .0001) (Figure 6F). The HNC treated patients showed significantly increased 8-OHdG levels (p < .0001) versus untreated patients (Figure 6F). Figure 6G shows the significantly increased level of 8-OHdG in patients with smoking status (smokers vs nonsmokers; p < .01). Non-significant increase in 8-OHdG level was observed in the case of patients with different age groups (<52 years vs ≥52 years; p < .19) and gender groups (males vs females; p = .20), as shown in Figure 6G.
The POD and 8-Oxoguanine level diagnostic efficacy was evaluated using ROC curve analysis. Figure 6D and H show the AUC (1.00) for both POD and 8-OHdG with sensitivity: 100 and specificity: 100 (p < .0001).
Discussion
Exosomes as messengers carry cargo that can promote cancer development, progression, and metastasis. Exosomes may facilitate promoting pre-metastatic niche, angiogenesis, and evading the immune system. Exosomal unique cargo material reflects the physiological/pathological state of the donor cell and may serve as potential biomarkers.23,24 These characteristics suggest analyzing circulating exosomes and their cargo as promising candidates for cancer liquid biopsy, disease biomarker discovery, monitoring disease progression, and potentially estimating prognosis. miR-17-92 plays major roles in multiple biological processes like proliferation, apoptosis, metabolism, tumorigenesis, and metastasis. 25 However, despite the deregulation of miR-17-92 has been observed in various cancers,25,26 but involvement of miR-17-92 as the exosomal cargo in HNC carcinogenesis remains unexplored. Among the miR-17-92 cluster, expression deregulation of exosomal miR-19a and miR-19b and their related genes (SMAD2 and SMAD4) has already been reported in our previous study. 20 The involvement of a remaining member of the exosomal miR-17-92 cluster, exosomal miR-17 and exosomal miR-20a, and their targeted gene TGFBR2 in HNC has not been reported previously. The present study was conducted in three phases. In the first phase, exosomes were isolated from HNC patients and control samples. The isolated exosomes were then characterized based on size distribution and quantification, morphology, and surface markers.
During the characterization of isolated exosomes, NTA was used to calculate the size and concentration of exosomes. The NTA results showed the isolated exosomes had a mean size of 100 nm which is within an estimated size range of exosomes (40-150 nm). The morphology of exosomes was confirmed sphere-shaped using TEM-negative staining, within the anticipated size range of exosomes. These results are in accordance with previous NTA results and this typical form has already been reported in previous findings. 27 Exosomes were immunolabelled with CD-63 specific marker (commonly used marker for exosomes) and TEM showed positive labeling. ELISA was used to confirm CD9, CD63, and CD81 positive protein surface markers of exosomes in accordance with previous study. 28 Tetraspanin family members including CD9, CD63, and CD81 have been identified as reliable markers for exosome detection and play key roles in the regulation of several functional and molecular processes in cancer. 29
In the second phase of the present study, the expressional analysis of exosomal miRNAs (miR-17 and miR-20a) and their targeted genes TGFBR2 was analyzed in 400 HNC patients and 400 controls. The expression of exosomal miRNAs and target genes was correlated with demographic and clinicopathological parameters of HNC patients. Dysregulation of miRNAs is involved in carcinogenesis including HNC cancer. 26 Exosomal miRNAs are considered preferable biomarkers to the other extracellular miRNAs. In the current study, we found significant downregulation of miR-17 in serum exosomes of HNC patients compared to controls, and significantly reduced expressions were observed in advanced stages of HNC patients. The miR-17 has also been associated with several cancers and performs key functions in the regulation of biological properties in cancer cells.25,26 Consistent with our results downregulation of miR-17 has also been found in breast cancer serum exosomes. 11 The downregulation of miR-17 has also been reported in various cancers like prostate cancer 30 and stomach cancer. 31 miR-17 downregulation has also been reported in therapy-resistant cases of lung cancer. 32 miR-17-92 cluster has been found deleted in various cancers like 21.9% in breast cancer, 20% in melanomas, and 16.5% in ovarian cancer, and functions as a cancer suppressor. 33
In this study, significant downregulation of miR-20a was found in serum exosomes of HNC patients versus controls, while this downregulation was found pronounced in aggressive-stage HNC patients compared to early-stage patients. Consistent with our results, the cancer suppressor role of miR-20a has been observed in small cell lung cancer, 34 endometrial cancer, 35 breast cancer, 36 and glioma patients. 37 The reason behind the downregulation of miR-20a and miR-17 in our study needs to be further explored. However, one possibility of this downregulation is increased oxidative stress levels in the exosomes of HNC patients. This increased oxidative stress ultimately results in increased necrosis, invasion, metastasis, and aggressiveness of disease. The second possible reason is the interaction of selected miRNAs with hypoxia-inducible factor-1 alpha subunit (HIF-1 α) which participates in the progression and pathogenesis of many cancers.38,39 HIF-1α plays a role in angiogenesis, cancer development, metastasis, and hypoxic microenvironment. 40 He et al have reported that the deregulation of HIF-1α downregulates miR-20a and miR-17 by reducing the expression of c-Myc and increasing carcinogenesis in AML. 17
In the present study, exosomal TGFBR2 was found significantly upregulated in HNC patients versus controls and this upregulation was observed more pronounced in the advanced stages of HNC. Consistent with our findings, the downregulation of miR-17 enhances migration and proliferation of gastric cancer by negatively regulating TGFBR2 expression. 41 Galunisertib, a TGFBR2 inhibitor, significantly increases the overall survival of pancreatic cancer patients and serves as a potential drug. 42 In non-squamous cell lung cancer, downregulation of the miR-17 and miR-20a/b led to metastasis and drug resistance by increasing TGFBR2 expression. 43 Yang et al have revealed that miR-20a binds to the 3′-UTR of TGFBR2 and inhibits the anti-cancer role of TGF-β in NSCLC. 44
We found non-significant upregulation of miR-17, miR-20a and target gene TGFBR2 in treated patients (which were receiving any form of therapeutic strategy including surgery, chemotherapy and radiation) as compared to those patients which were newly diagnosed and were not getting any therapeutic strategy yet. Interestingly, Jank et al have reported increased staining of TGFBR1, one of the key members of TGF-β pathway and suggested as a prognostic marker for HNSCC. Jank et al also evaluated inhibition of TGFBR1 inhibitor using vactosertib and found radio-sensitizing and antineoplastic effects in vitro. 45
Oxidative stress biomarkers are associated with the pathogenesis of HNC and could be utilized for timely diagnosis. Based on the key pathogenic role of oxidative stress in HNC, several oxidative stress markers have been identified to have promising diagnostic value. 46 In third part of study, oxidative stress was also measured in the exosomes of HNC patients, and its diagnostic value was assessed. The oxidative stress level was correlated with expression levels of selected microRNAs and target gene. The levels of oxidative stress were assessed by measuring antioxidant enzyme peroxidase (POD) and 8-hydroxy-2-deoxyguanosine (8-OHdG) levels in isolated exosomes of HNC patients and controls. The POD levels were significantly reduced in HNC patients compared to controls, especially in advanced clinical stages of HNC patients. The 8-OHdG levels were significantly increased in HNC patients and advanced clinical stages of HNC patients. Oxidative stress, characterized by elevated levels of reactive oxygen species (ROS), has been associated with various pathologies including cancer development, progression, and drug resistance. 47 The increased levels of ROS can cause oxidative damage to DNA, lipids, and proteins through 8-OHdG. Thus, maintaining ROS homeostasis is crucial for preventing oxidative damage and cells utilize antioxidant molecules like POD to achieve this balance. 48 In the present study the association of increased 8-OHdG levels, increased reactive oxygen species (ROS) and decreased antioxidant enzymes may lead to increased DNA oxidation and ultimately toward aggressiveness of head and neck cancer.49,50 However, there is no published study available investigating the role of exosomal 8-OHdG and POD levels leading towards aggressiveness of HNC patients. These results provide valuable insights into the role of oxidative markers in exosomes and highlight their potential as biomarkers for HNC progression and aggressiveness.
Certain limitations to our study exist, such as: first, detailed in-vitro and in-vivo exosome-based studies are required to understand the mechanism through which the deregulation of these molecules leads to HNC pathogenesis. Second, further study with a larger cohort is suggested to understand the therapeutic potential of exosomal miR-17, miR-20a, and TGFBR2 in HNC. Inflammation is an important contributing factor in HNC. Carcinogens and mutagens are present in tobacco smoke leading to chronic inflammation which ultimately results in cancer of the head and neck region. 51 Third, to determine the role of inflammation in HNC, certain inflammatory markers need to be assessed in future studies. The level of inflammatory markers will be correlated with the level of selected microRNAs/genes to illuminate the picture of head and neck carcinogenesis.
Conclusion
In the current study, we observed significant downregulation of miR-17, miR-20a, and upregulation of important TGF-β pathway member, TGFBR2 in serum exosomes of HNC patients than controls. This dysregulation was associated with increased oxidative stress (measured by 8-OHdG and antioxidant enzyme) and aggressiveness of disease pathology. Further analysis revealed the good diagnostic and poor prognostic significance of selected exosomal microRNAs and TGFBR2 in HNC patients. The present study suggested that deregulation of miR-17, miR-20a, and TGFBR2 along with oxidative stress could enhance the diagnostic and prognostic ability and may act as potential/promising and noninvasive biomarkers for HNC patients. Based on our findings, TGFBR2 is a potential candidate as therapeutic target against HNC, and future studies may evaluate the potential of increased exosomal miR-17/20a or inhibitor of TGFBR2 as a therapeutic target against HNC.
Supplemental Material
sj-tif-1-tct-10.1177_15330338251323314 - Supplemental material for Deregulation of Exosomal miR-17, miR-20a and TGFBR2 in Head and Neck Cancer Patients
Supplemental material, sj-tif-1-tct-10.1177_15330338251323314 for Deregulation of Exosomal miR-17, miR-20a and TGFBR2 in Head and Neck Cancer Patients by Muhammad Rizwan, Ishrat Mahjabeen, Muhammad Shahbaz Haris, Fouzia Qayyum and Mahmood Akhtar Kayani in Technology in Cancer Research & Treatment
Supplemental Material
sj-docx-2-tct-10.1177_15330338251323314 - Supplemental material for Deregulation of Exosomal miR-17, miR-20a and TGFBR2 in Head and Neck Cancer Patients
Supplemental material, sj-docx-2-tct-10.1177_15330338251323314 for Deregulation of Exosomal miR-17, miR-20a and TGFBR2 in Head and Neck Cancer Patients by Muhammad Rizwan, Ishrat Mahjabeen, Muhammad Shahbaz Haris, Fouzia Qayyum and Mahmood Akhtar Kayani in Technology in Cancer Research & Treatment
Footnotes
Acknowledgments
Higher Education Commission of Pakistan (HEC) and COMSATS University, Islamabad, provided financial and infrastructural support to the authors. The authors thank the patients and the personnel of the Pakistan Institute of Medical Sciences (PIMS) Islamabad, PIMS), Bahawalpur Victoria Hospital (BVH), Bahawalpur Institute of Nuclear Oncology (BINO), for their participation in present study.
Author Contributions Statements
All of the authors read and approved the final version of the manuscript. Muhammad Rizwan and Muhammad Shahbaz Haris collected and isolated the exosomes from HNC and control samples. Muhammad Rizwan and Muhammad Shahbaz Haris performed the expression analysis experiments. Muhammad Rizwan, Muhammad Shahbaz Haris, and Fouzia Qayyum performed oxidative stress measurement experiments. Ishrat Mahjabeen and Muhammad Rizwan performed statistical analyses of the data and draft of the manuscript. Mahmood Akhtar Kayani and Ishrat Mahjabeen supervised the project and provided critical revisions. All the authors discussed the results and commented on the manuscript.
Declaration of Conflicting Interests
The authors declared no potential conflicts of interest with respect to the research, authorship, and/or publication of this article.
Funding
The authors received no financial support for the research, authorship, and/or publication of this article.
Ethics Statement
The authors state that they have obtained the appropriate institutional review board approval committee of COMSATS University Islamabad's (CUI) Biosciences department, and cooperating hospitals approval number (CUI/Bio/ERB/4-21/1) or have followed the principles outlined in the Declaration of Helsinki for all human or animal experimental investigations. In addition, for investigations involving human subjects, informed consent has been obtained from the participants involved.
Data Availability
The data supporting the findings of this study are not publicly available due to privacy and ethical restrictions. Protecting the privacy of study participants is a priority, and therefore, the data cannot be shared openly.
Supplemental Material
Supplemental material for this article is available online.
References
Supplementary Material
Please find the following supplemental material available below.
For Open Access articles published under a Creative Commons License, all supplemental material carries the same license as the article it is associated with.
For non-Open Access articles published, all supplemental material carries a non-exclusive license, and permission requests for re-use of supplemental material or any part of supplemental material shall be sent directly to the copyright owner as specified in the copyright notice associated with the article.