
Abstract
Background
Esophageal Squamous Cell Carcinoma (ESCC) poses a significant health challenge in China due to its high incidence and mortality. Single-cell transcriptomics has transformed the approach to cancer research, allowing detailed analysis of cellular and molecular heterogeneity. The interaction between the transcription factor STAT1 and the tumor suppressor LHPP is crucial, potentially influencing cancer progression and therapeutic outcomes.
Objective
This study aims to explore the molecular mechanisms and cellular dynamics underlying ESCC, with a focus on the role of transcription factors, particularly STAT1, and its regulatory relationship with LHPP, in the pathogenesis of ESCC.
Methods
Utilizing single-cell transcriptomics data sourced from the public database GEO (GSE160269), we identified major cell types and their transcriptomic changes in ESCC patients. Differential gene expression profiles were examined to understand the dynamics of the tumor microenvironment (TME). A cohort of 21 ESCC patients was recruited to validate the findings. Furthermore, in ESCC cell lines, we validated the transcriptional regulatory relationship between STAT1 and LHPP.
Results
Our analysis identified six major cell types within the ESCC microenvironment, revealing significant changes in cellular composition and gene expression profiles associated with tumorigenesis. Notably, a novel association between STAT1's regulatory role over LHPP was observed, suggesting a complex regulatory loop in ESCC pathogenesis. Elevated STAT1 and reduced LHPP expression were confirmed in patient samples with STAT1 negatively regulates LHPP expression at the promoter level; when the promoter binding motif regions were mutated, the transcriptional repression ability on LHPP was weakened.
Conclusion
The study highlights STAT1 as a core regulator in ESCC, directly influencing LHPP expression. The findings offer novel insights into the molecular mechanisms driving ESCC, shedding light on the cellular alterations and gene regulation dynamics within the ESCC microenvironment. This research provides a foundation for developing targeted therapeutic strategies, potentially utilizing the STAT1-LHPP axis as a focal point in ESCC treatment and prognosis.
Keywords
Introduction
Esophageal squamous cell carcinoma (ESCC) stands as one of the foremost malignancies both globally and in China.1–3 Globally, ESCC accounts for a significant portion of cancer-related deaths, with its prognosis remaining grim due to late diagnosis and limited treatment options. 4 Meanwhile, China confronts an even more exacerbated burden. The nation harbors a substantial fraction of ESCC cases, making it a primary public health concern. 5 A combination of genetic predisposition, environmental factors, and dietary habits have contributed to its elevated prevalence in the Chinese demographic.6,7
To unravel the underlying complexities of cancers like ESCC, researchers have turned to sophisticated cancer databases. The inception of single-cell transcriptomics is particularly revolutionary. 8 Traditional bulk transcriptomics gives an averaged readout of cell populations, often masking the nuanced heterogeneity of cancer cells. In contrast, single-cell databases enable a granular view, illuminating individual cell behaviors and interactions, thereby enhancing the resolution of cancer understanding and offering detailed insights into its initiation and progression.9–11
Central to the transcriptional landscapes of cells are transcription factors (TFs), molecular entities that hold sway over gene expression patterns. 9 TFs, including the likes of STAT1, can be instrumental in shaping the course of cellular behaviors, from differentiation to proliferation, and in cancer contexts, tumorigenesis and metastasis. Particularly, STAT1 has been increasingly spotlighted for its role in various malignancies.12,13 As an integral component of the STAT family, STAT1 is involved in transmitting extracellular signals to the nucleus, consequently activating or repressing target genes, many of which have oncogenic or tumor-suppressive functions. 14 Additionally, STAT1 orchestrates the host's immune response to neoplastic cells, contributing to the immunosuppressive environment fostered by tumors.15,16 STAT1 is heterogeneous in ESCC, and it plays a complex role in modulating other signaling pathways. For instance, STAT1 attenuates STAT3 activity upon oncostatin M treatment by decreasing STAT3 transcriptional activity and its DNA-binding ability. Additionally, STAT1 signaling in ESCC cells regulates the expression and/or activity of NF-κB and STAT3, both of which are known to have oncogenic potential.16–18
Among a myriad of genes governed by transcription factors, LHPP stands out for its intriguing role in cancer dynamics. LHPP, also known as Phospholysine Phosphohistidine Inorganic Pyrophosphate Phosphatase, is a gene that encodes a phosphatase enzyme involved in the dephosphorylation of phospholysine and phosphohistidine residues. Emerging evidence suggests that LHPP plays a crucial role in various cellular processes, including cell proliferation, apoptosis, and tumor suppression. Dysregulation of LHPP expression has been implicated in the pathogenesis of several cancers, where its downregulation is frequently associated with tumor progression and poor prognosis.19–21 Recent studies have shown that LHPP mRNA levels are lower in both early and late-stage ESCC patients of Han ethnicity compared to adjacent non-cancerous tissues. Additionally, LHPP has been found to promote apoptosis in oral squamous cell carcinoma by decreasing the transcriptional activity of p-PI3K and p-Akt. However, the function and regulation of LHPP in ESCC remain largely unknown. 22 Previous researches have highlighted LHPP as a potential tumor suppressor, with its downregulation being linked to the exacerbation of oncogenic pathways in various malignancies. Understanding LHPP's functions and regulatory mechanisms could prove pivotal in deciphering the mysteries of ESCC progression.23–25
In this study, we validated the changes in epithelial, endothelial, and T cell populations during the progression of ESCC through a combination of single-cell and cancer databases, along with patient cohort data. Our findings highlight the potential predictive role of the negative regulation of LHPP by STAT1 in the disease's progression. By revealing the roles of key genes and pathways in the progression of ESCC, our study provides a valuable framework for future research and potential interventions aimed at combating this challenging cancer.
Materials and Methods
Construction of Cell Atlas of ESCC Patients
The raw data of healthy and tumor human clonal tissues were from GSE160269 in GEO database. 8 The R package Seurat (version 4.0.2) was used for construction of cell atlas of human ESCC tissues. In brief, the function “CreateSeuratObject” was used to load gene expression matrix of each sample. The function ‘SCTransfrom’ was used for finding high variable genes, normalization and scaling of the gene expression matrix for each sample, the ‘PrepSCTIntegration’ and ‘FindIntegrationAnchors’ functions were used for selecting the anchors for integration all samples. The function “IntegrateData” was used for the following integration. After integration, the function “ScaleData” was used to scale the integrated expression matrix, then the principle component analysis and Dimensionality reduction of dataset were performed by the functions “RunPCA” and “RunUMAP”, the functions “FindNeighbors” and “FindClusters” were used to cell clustering and identification. The function ‘FindAllMarkers’ (|avg_log2FC| ≥ 0.5 and p_val_adj ≤ 0.05) was used to calculate marker genes for each cell type.
Identification of DEGs Between Healthy and Tumor Group Across Tissues and Cell Compartments
The ‘FindMarkers’ function in Seurat was used to identify differentially expressed genes in tumor versus group healthy (tumor/healthy) of each cell type, which were based on normalized data and the Wilcoxon test. The screening criteria for significantly differentially expressed genes were selected by BH-adjusted P value < .05 and |log2FC| > 0.25.
Cell-Cell Interaction Analysis in ESCC Patients Using CellPhoneDB
CellPhoneDB were used for elucidating intercellular communication networks within the analyzed cell populations. Initially, we prepared a normalized single-cell RNA sequencing (scRNA-seq) dataset, ensuring it included annotations for cell types or clusters. This dataset was then uploaded to CellPhoneDB through the command-line interface. We utilized the cellphonedb method function to conduct the analysis, which involved the statistical assessment of potential ligand-receptor interactions between the defined cell types. The function operates by comparing the input data against a curated database of known ligand-receptor pairs and computing the likelihood of their interactions based on expression levels. Additionally, we set specific parameters for statistical significance (eg, p-value threshold) to refine our analysis. The output generated by CellPhoneDB, which includes a list of statistically significant interacting pairs along with their corresponding p-values and cell types, was further explored to identify key communication pathways pertinent to our study. This analysis provided valuable insights into the cell-cell communication landscape, aiding in the understanding of the biological processes under investigation.
Pseudo-time Trajectory Inference
To characterize the mobilization and of ESCC during tumor genesis, the R package Monocle2 was used to perform pseudotime trajectory inference for EC of healthy and tumor tissues. The top 3000 high variable genes were used to calculate the pseudotime. The functions “plot_pseudotime_heatmap” and “plot_genes_in_pseudotime” were used to perform time-related gene analysis.
Gene Set Score Analysis
The gene sets were downloaded from MSigDB (https://www.gsea-msigdb.org/gsea) and the ‘AddModuleScore’ function of Seurat was used to calculate gene set scores.
Microarray Data Analysis
To perform a comprehensive analysis combining single-cell data with other publicly available datasets, we sourced high-throughput sequencing data (HiSeq, RPKM format) for both ESCC tissues and healthy tissues from the UCSC Xena database (https://tcga-xena-hub.s3.us-east-1.amazonaws.com/download/TCGA.ESCA.sampleMap%2FHiSeq.gz). For our differential expression analysis, we selected a subset of 10 healthy and 10 ESCC samples. The DESeq2 software was employed to carry out the differential gene analysis. During this process, genes were designated as differentially expressed genes (DEGs) if they met the following specific criteria: an absolute log2 fold change (|log2FC|) greater than 0.25 and an adjusted P-value of less than 0.05. These stringent thresholds were established to ensure that only genes demonstrating statistically significant and biologically meaningful changes in expression were classified as DEGs.
Ethics Approval and Consent to Participate
The studies involving human participants was approved by the Institutional Ethics Committee of Huaian Hospital of Huaian City (KY-2022-014-01, date: 2022.02.24). Informed consent from each patient has been obtained by the principal investigator or co-investigators using an informed consent document. After obtaining written informed consent from the subjects, the principal investigator or co-investigator has confirmed that the research participants meet all inclusion criteria.
Patients and Tissues
ESCC patient’ biopsy samples with tumor and adjacent tissues were collected in the Department of Radiation Oncology, Huaian Hospital of Huaian City from 2022 to 2024. Biopsy samples were collected from a cohort comprising 21 patients diagnosed with ESCC (14 males and 7 females). The age range of the patients spanned from 28 to 62 years, and all were residents of the local Han Chinese population. Notably, they had not undergone any prior surgical treatments before the sample collection. Histopathological analysis of excised tumors or biopsy samples was used to confirm ESCC diagnoses. Biopsy specimens were collected and placed in liquid nitrogen for later use.
Cell Culture and Plasmids
The human esophageal squamous carcinoma cell lines KYSE-150 (YC-B002, RRID: CVCL_C3LZ) and EC9706(CL-0091, RRID: CVCL_E307) were provided by the Chinese Academy of Sciences Cell Bank Type Culture Collection (Shanghai, China). The LHPP promoter was cloned from the total DNA of EC9706 and constructed into the pGL3 expression vector using a rapid DNA ligation kit (beyotime, D7001M). Cells were transfected at 37 °C with silencing RNA STAT1 (si-STAT1), LHPP (siLHPP) and their negative controls (si-NC) by using Lipofectamine® 2000 (Invitrogen; Thermo Fisher Scientific, Inc., Waltham, MA, USA). The silencing RNA were acquired from GenePharma Co., Ltd (Shanghai, China).
Quantitative Real-time PCR
Biopsy specimens were subjected to physical homogenization and total RNA extracted by TRIzol Reagent (Invitrogen) according to the manufacturer's instructions. For cDNA synthesis, 5ug RNA was reverse transcribed with the high-capacity reverse transcription kit (Thermo Fisher). The qPCR reactions were performed using TaqMan gene expression and assays on ABI QuantStudio 5 (Applied Biosystems, Thermo-Fisher).
Western Blotting
Cells were lysed using SDS lysis buffer (containing 0.1 M Tris-HCl (pH = 7.0), 1% SDS and 2% 2-mercaptoethanol, supplemented with 1 x protease inhibitors (Roche, 45-4693159001). Protein was quantified using the BCA Kit (Tiangen). 20ug proteins were subjected to SDS-PAGE electrophoresis. The PVDF membranes (Millipore) was blocked with 5% skim milk and then incubated overnight at 4°C with the following antibodies: mouse monoclonal antibody against GAPDH (1:2500 dilution; Santa Cruz Biotechnology; sc365062); Rabbit monoclonal antibody against STAT1 (1: 1500 dilution; Cell Signaling Technology; #9172);LHPP(1: 500 dilution, abcam, ab254788) Following incubation with HRP-conjugated secondary antibodies, the membrane was visualized using an enhanced chemiluminescence (ECL) kit (Thermo) and quantified with ImageJ software.
Colony Formation Assay
The KYSE-150 cells were and seeded into 24-well plates with 600 cells per well, and then cultured in RPMI-1640 (Gibco 11875093, USA) supplemented with 10% fetal bovine serum (Gibco 1009141, Australia) and incubated for 10 days at 37 °C. The cells were then cleaned by using PBS. They received the fixing in 4% methanol and then the dying with 0.1% crystal violet. The photograph was taken and analysis by ImageJ.
Statistical Analysis
Data are statistically analyzed using the GraphPad Prism 8.0 software. Results are presented as the mean ± SEM. Statistical analyses were performed using a two-tailed Student's t-test to compare the differences between different groups. P values < .05 was considered statistically significant (*). ** indicated P < .01, *** indicated P < .001 and *** indicated P < .001.
Results
Mapping Cellular Dynamics in Esophageal Squamous Cell Carcinoma Through Single-Cell RNA-Sequencing
To dissect the intricate alterations within the ESCC microenvironment, we leveraged single-cell RNA-sequencing datasets from patient-derived samples, accessible through public repositories. 8 A meticulous examination of 44,206 cells from both tumorous and adjacent non-tumorous tissues enabled the delineation of six predominant cell types: epithelial cells (AOC1), endothelial cells (PECAM1), fibroblasts (PDGFRA), myeloid immune cells (CD14), T cells (CD3D), and B cells (CD39) (Figure 1A to C). To validate these identified cell populations, we analyzed the expression levels of classic marker genes (Figure 1 B & C), revealing that these markers were most specifically expressed in their respective cell types. Furthermore, by constructing gene sets for each cell type and performing functional annotations, we found that the biological functions of these marker genes were closely aligned with the biological roles of their respective cell types. These findings collectively confirm the accuracy of our cellular taxonomy and underscore the reliability of our approach in capturing the cellular heterogeneity within the ESCC microenvironment (Figure 1D).

Diversity of cell types identified by scRNA-seq analysis. (A) Umap plot showing different cell types (left) and samples distribution (right) in ESCC tissues. (B) Dot plot showing the gene expression signatures of the classic marker genes of each cell type. (C) Umap plots showing the expression profiles of indicated cell-type-specific marker genes. The color key from gray to red indicates low to high gene expression levels. Epithelial cells (AOC1), endothelial cells (PECAM1), fibroblast cells (PDGFRA), myeloid immune cells (CD14), T cells (CD3D) and B cells (CD39). (D) Heatmap showing the gene expression signatures of the top 50 cell-type-specific marker genes for each cell type, with corresponding functional annotations on the right. The color key from blue to red represents low to high gene expression levels. (E) Bar plot showing the cell proportion distribution of each cell type in healthy and tumor tissues. (F) Bar plot showing the fold change level of cell proportion during lesion.
Our analysis revealed a marked escalation in the fraction of epithelial cells within the tumorous landscape (Figure 1E & F), indicative of the neoplasm's growth and the proliferative index, which are reflective of the malignancy's stage and expansion capabilities. The concurrent increase in endothelial cell populations points to an active angiogenic process, a critical factor for tumor nourishment and growth. This vascular augmentation within the tumor not only facilitates nutrient and oxygen supply but also potentially creates conduits for metastatic dissemination.
The tumor stroma also exhibited pronounced fibrotic characteristics, with an increased fibroblast presence (Figure 1E & F), implicating these cells in the structural and functional modification of the tumor milieu, which might influence the invasiveness and treatment response of the cancer.
A particularly disconcerting observation was the reduction in T cell proportions within the tumor niche (Figure 1E & F), an essential component of the anti-tumor immune response. This decrease suggests that the tumor is effectively evading immune surveillance, which could lead to unhindered tumor progression and highlights the need for a deeper understanding of the immune landscape in ESCC.
Collectively, the data shed light on the dynamic cellular interplay within the ESCC microenvironment, highlighting the proliferative epithelial cells, the angiogenic endothelial cells, and the fibrogenic fibroblasts, against a backdrop of a compromised T cell-mediated immune response. These insights not only deepen our understanding of the biological underpinnings of ESCC but also serve as a foundation for the development of targeted therapeutic approaches that address these cellular dynamics.
Profiling Transcriptomic Variations Among Distinct Cell Types in the Progression of ESCC
Our detailed investigation into the gene expression alterations among distinct cell types during the advancement of ESCC revealed substantial transcriptional modulation, with 1482 genes showing enhanced expression and 1369 exhibiting a decline. These differentially expressed genes were identified based on a stringent criteria comparing ESCC samples with healthy controls, where genes with a Benjamini-Hochberg (BH) adjusted P value < .05 and an absolute log2 fold change (|log2FC|) greater than 0.25 were considered significant. This significant reprogramming of the genetic landscape underscores the cellular adaptation to oncogenic transformation (Figure 2A-F).
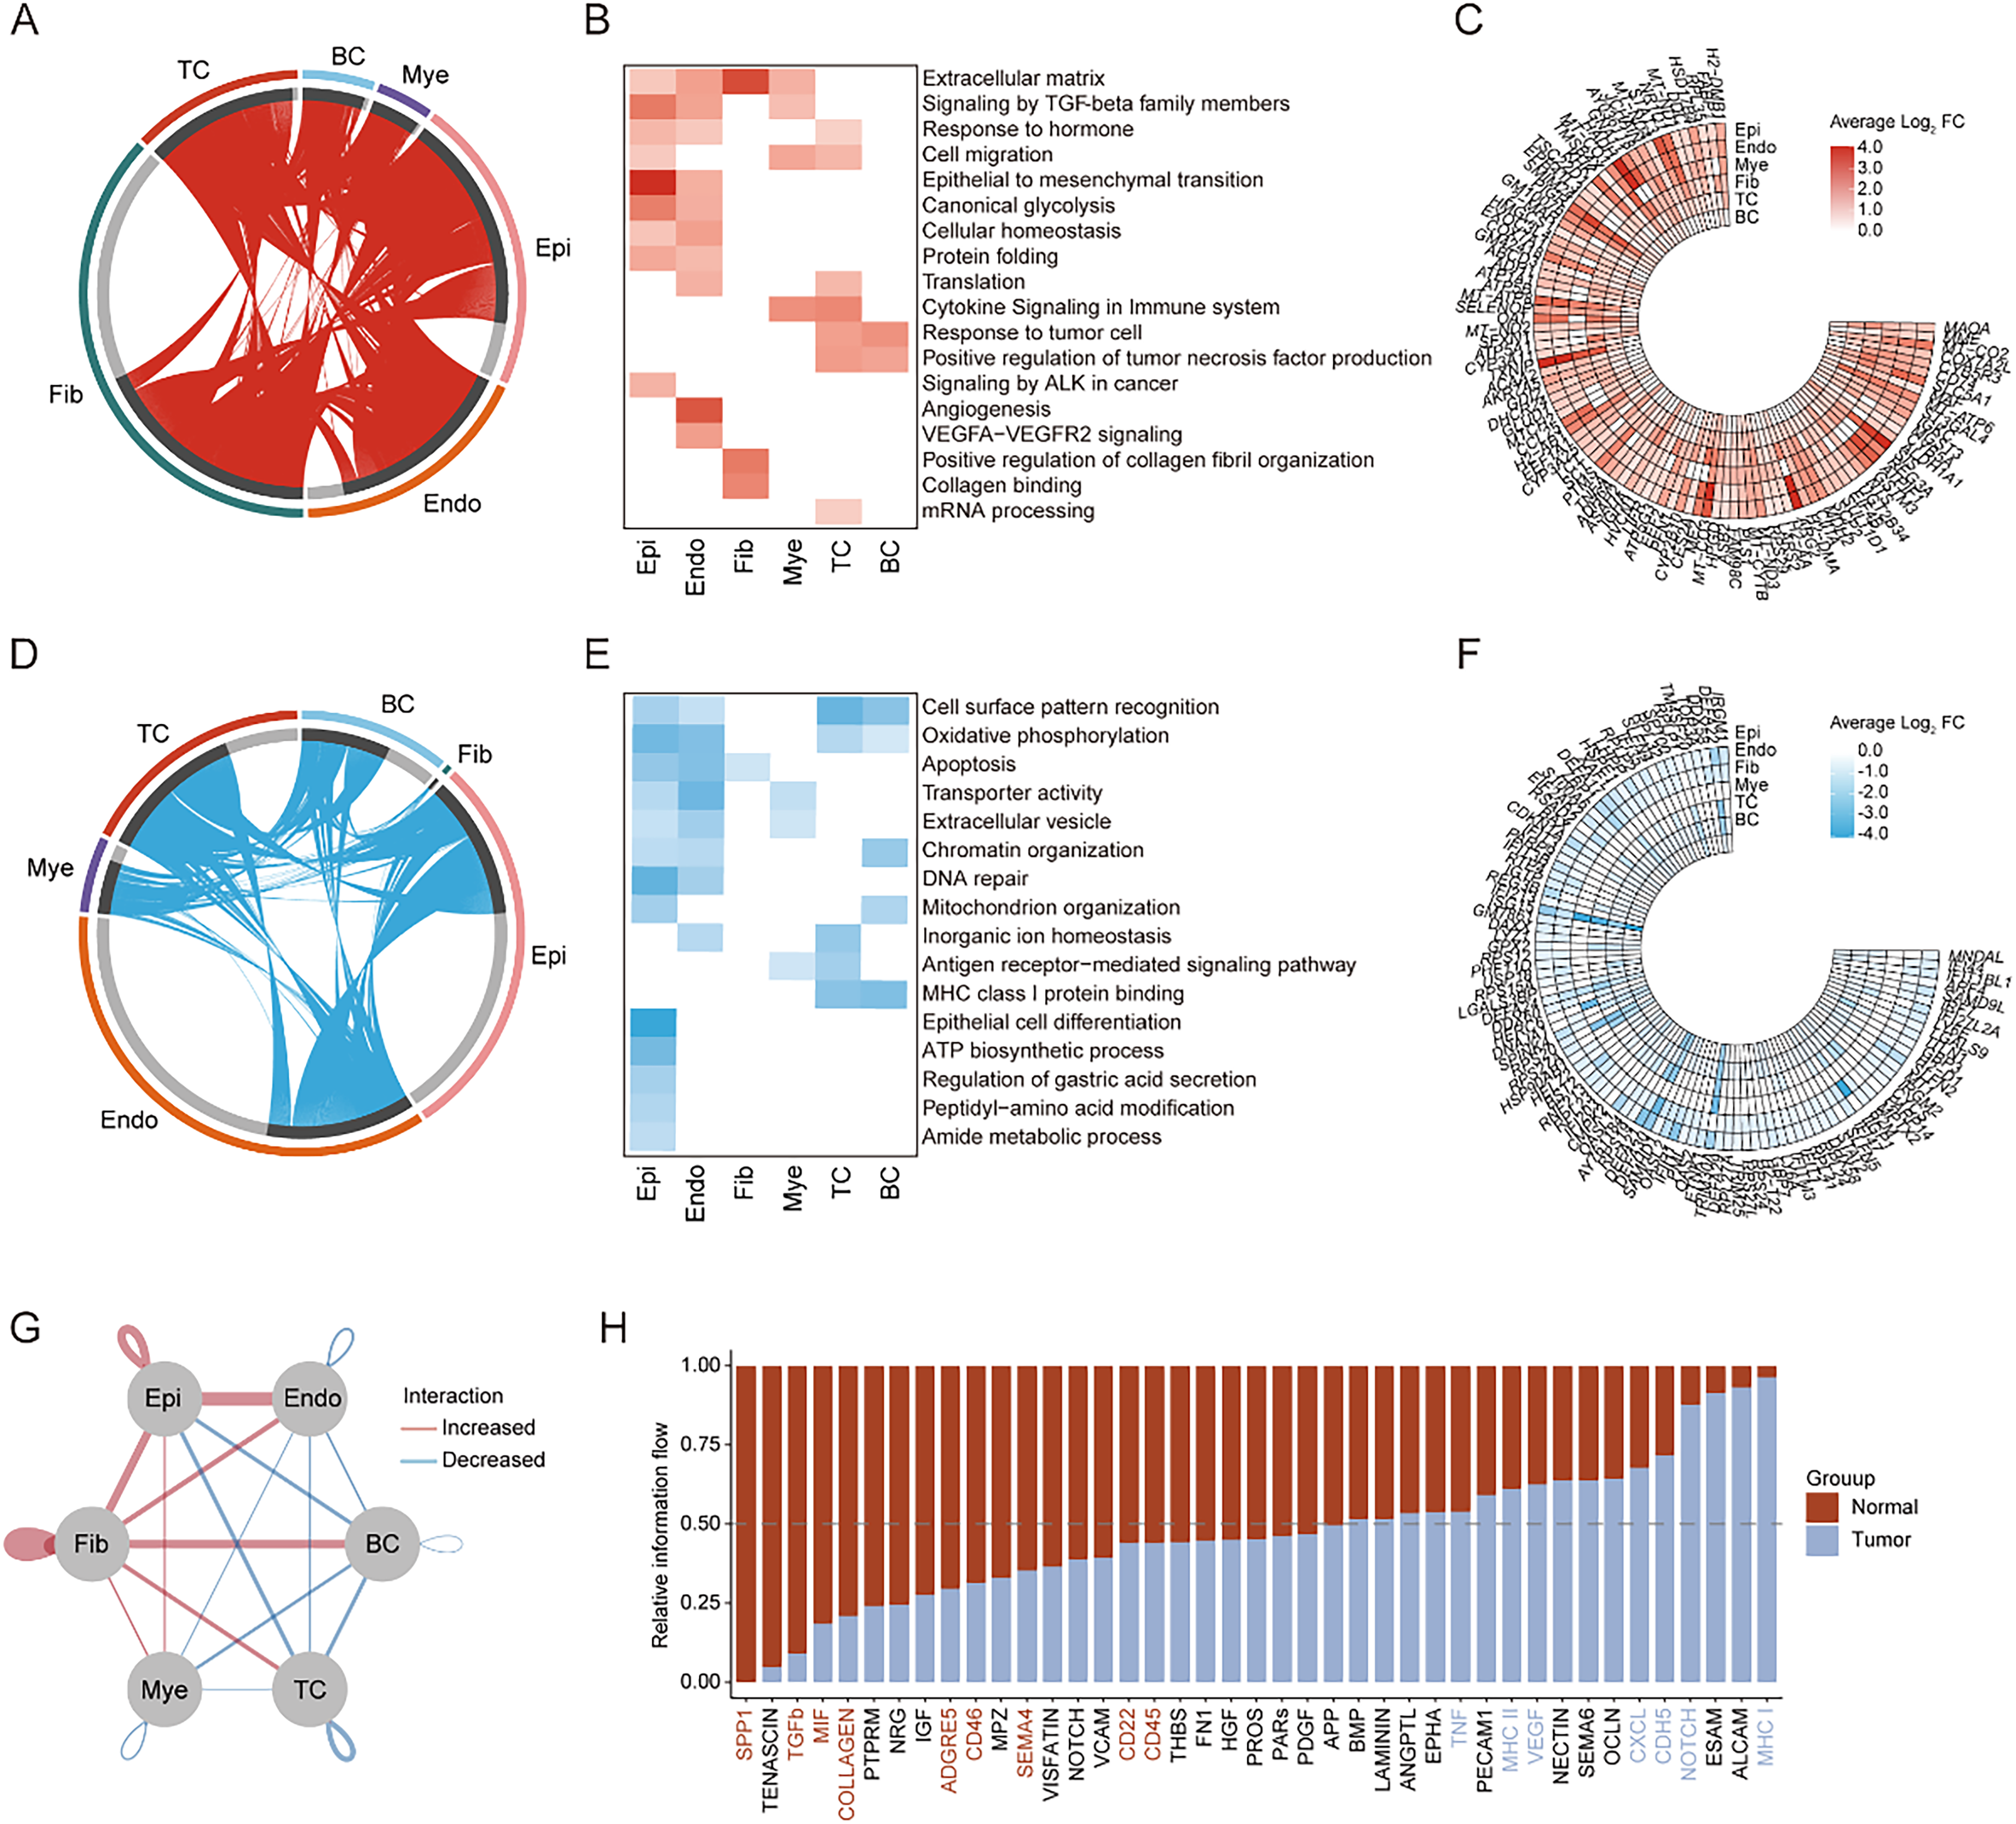
Changes in the transcriptional profiles of different cell types during tumor genesis. (A) Chord plot showing the distribution of upregulated DEGs for each cell type between healthy and tumor groups (tumor/healthy). (B) Heatmap showing the gene function annotations of upregulated DEGs. (C) Ring heatmap showing the top 100 upregulated DEGs during tumor genesis. (D) Chord plot showing the distribution of downregulated DEGs for each cell type between healthy and tumor groups (tumor/healthy). (E) Heatmap showing the gene function annotations of downregulated DEGs. (F) Ring heatmap showing the top 100 downregulated DEGs during tumor genesis. (G) Network diagram depicting interactions among cell types within the ESCC tumor microenvironment. Red lines represent increased interactions, and blue lines represent decreased interactions compared to normal tissue. (H) Bar graph displaying the relative interaction flow between various signaling pathways in tumor (red) and normal (blue) tissues. Pathways are ordered by their interaction flow in the tumor environment.
Upon examining genes with increased expression, a pattern emerged highlighting the activation of genes linked to fibrotic processes, as evidenced by the enriched “Extracellular matrix” and “Signaling by TGF-beta family members,” along with genes driving “Epithelial to mesenchymal transition (EMT).” These upregulated pathways suggest a reinforced fibrotic milieu within cancerous tissues. Notably, the escalation of EMT-related genes marks the morphological reprogramming of epithelial cells pivotal in cancer pathogenesis. Additionally, the marked elevation of “Canonical glycolysis” in epithelial and endothelial cells signals a metabolic transition conducive to cancer progression. Endothelial cells, in particular, showed a distinct upregulation in angiogenic genes, including “Angiogenesis” and “VEGFA-VEGFR2 signaling,” indicative of active vascular remodeling to support the growing tumor. Enhanced expression in immune cells, specifically T cells and B cells, in “Response to tumor cell” and “Positive regulation of tumor necrosis factor production” pathways, reflects a robust immunogenic stance against tumorigenic cells (Figure 2A-C).
Conversely, the observed reduction in gene expression related to “Cell surface pattern recognition” across epithelial and endothelial cells may represent strategic immune evasion by the tumor. A metabolic shift was further suggested by the downregulation of “Oxidative phosphorylation,” potentially favoring glycolytic pathways. Additionally, a decrease in genes critical for “Apoptosis,” “DNA repair,” and “Chromatin organization” implies potential survival mechanisms favoring malignant cell proliferation. Moreover, the attenuated expression in immune-related pathways such as “Antigen receptor-mediated signaling pathway” and “MHC class I protein binding” raises concerns about the immune system's effectiveness in targeting and eliminating cancer cells (Figure 2D-F).
The observed gene expression dynamics highlight the transformative state of the ESCC microenvironment. Elevated gene expression within fibroblasts, epithelial, and endothelial cells suggested an adaptive response resulting in fibrotic and metabolic alterations. Conversely, the downregulation of specific genes within endothelial, epithelial, and T cells may reflect a strategic adaptation by these cells within the tumor context. Collectively, these changes portray a complex and nuanced cellular response within the ESCC landscape, illustrating the need for an intricate understanding of the molecular and cellular mechanisms at play in the progression of ESCC.
Microenvironmental Changes During Tumorigenesis
In our endeavor to further elucidate the tumor microenvironment (TME) changes during tumorigenesis, we delved into the intricate cell-cell communication mechanisms among various cell types. Notably, we observed a marked amplification in the interactions between Epi, Endo, and Fib throughout the tumor development process. This increase underscores the mutual enhancement between tumor tissues and the surrounding neovasculature, as well as the heightened degree of fibrosis. Contrarily, immune cells, especially TC and BC, displayed a pronounced decline in their interactions with other cellular components (Figure 2G). This decrement further alludes to the tumor cells’ adeptness at evading immune surveillance. In summary, our findings highlight the pivotal shifts in cell-cell communications, suggesting a synergistic promotion of tumor progression and angiogenesis, accompanied by a diminishing immune-cell engagement within the tumor microenvironment.
From a global standpoint, our cell-cell communication analysis unveiled distinct shifts in several pathways within the TME. Predominant among these were the marked upregulations in the SPP1, TGFbeta, MIF, COLLAGEN, and CD45 pathways, juxtaposed with the conspicuous downregulation of the TNF, MCHI & MHCII, CXCL, CDH5, and NOTCH pathways (Figure 2H). These perturbations elucidate the nuanced microenvironmental changes that occur as the tumor progresses. Thus, our findings provide a comprehensive understanding of the dynamic interplay between various signaling pathways and their cell-specific activities. The differential regulations across these pathways not only highlight the tumor's adaptive mechanisms but also point to the evolving communications within the TME, potentially offering therapeutic insights.
Altered Epithelial Cell Dynamics During ESCC Progression
In our comprehensive investigation into the specific alterations that epithelial cells undergo during ESCC development, we applied pseudotime analysis to decipher the various cellular states throughout the carcinogenic trajectory of these cells. Remarkably, our analysis identified three distinct cellular states, each illuminating different aspects of epithelial cell behavior during ESCC progression: “Cell state 1” was observed in both normal and ESCC tissues, likely representing standard epithelial cells. “Cell state 2,” found predominantly in normal tissues, appeared to reflect the usual differentiation pathway of epithelial cells. In contrast, “Cell state 3,” predominantly in ESCC tissues, seemed to signify epithelial cells undergoing malignant transformation (Figure 3A & B). The transition from “cell state 1” to “cell state 2” mirrors typical physiological differentiation, while the shift to “cell state 3” indicates the pathological shift from normal to cancerous states, highlighting the complex evolution of epithelial cells from normality to malignancy in ESCC.
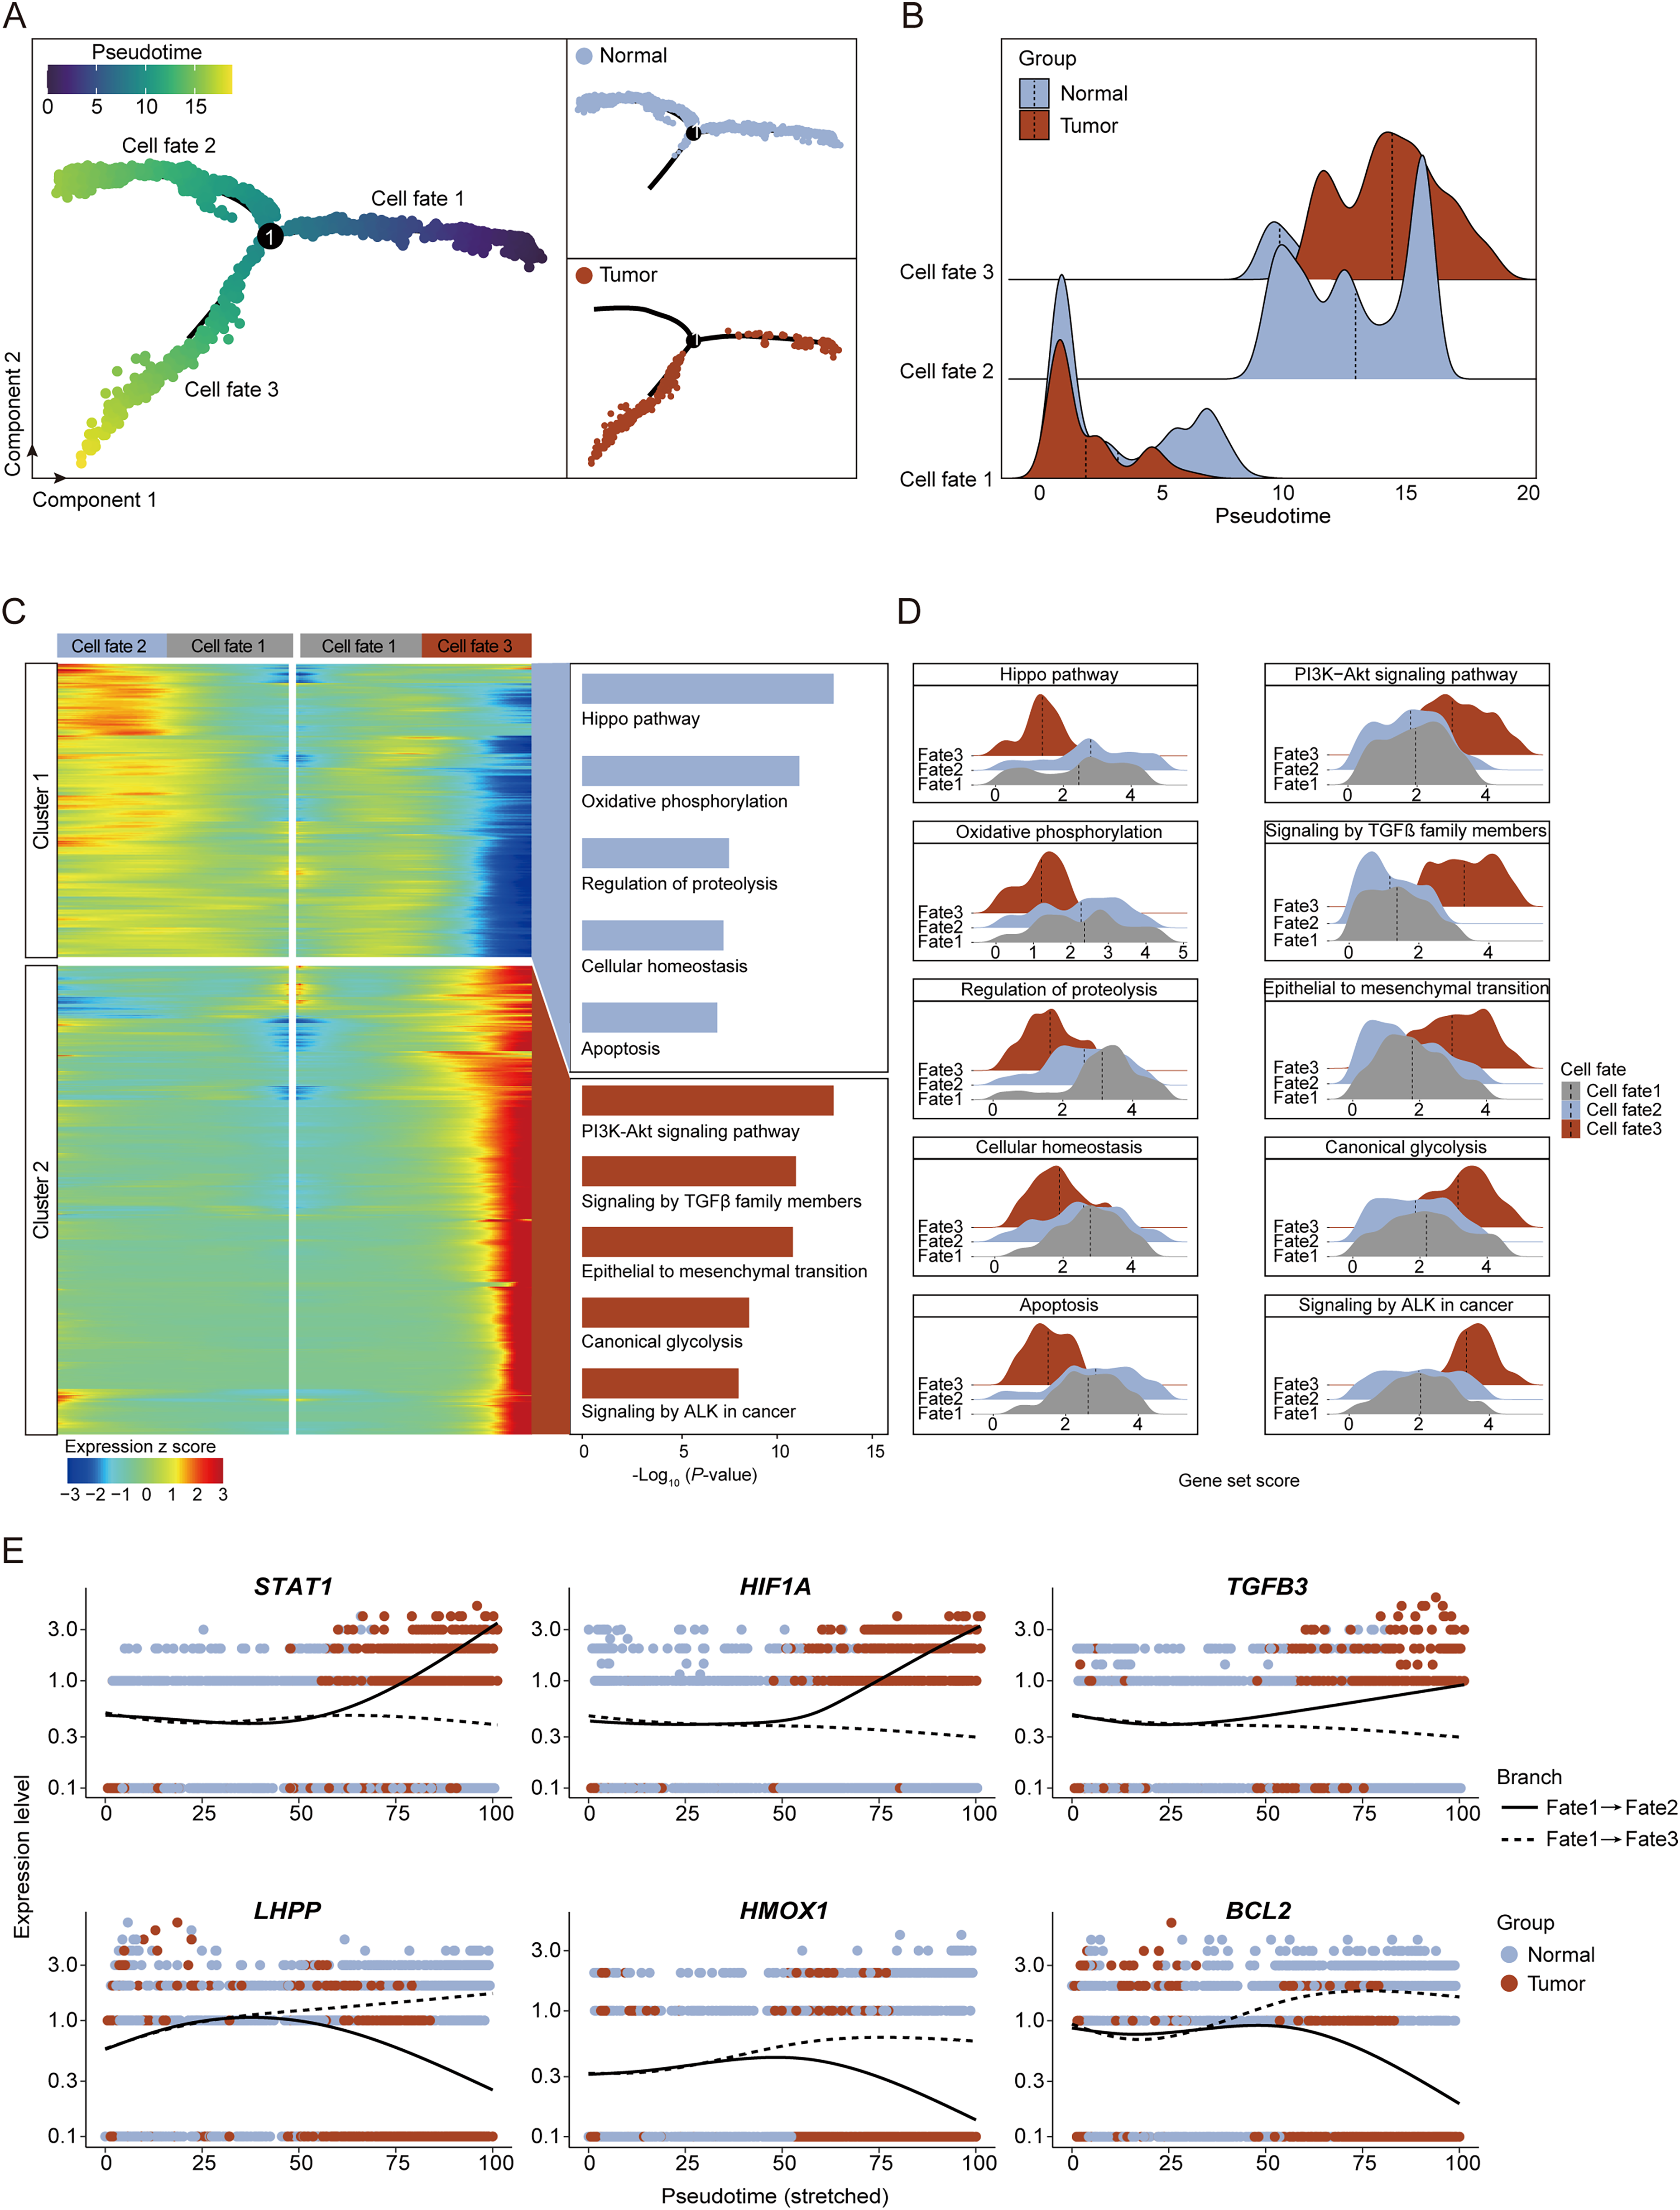
The cellular and molecular dynamics of endothelial cells during tumor genesis. (A) Pseudotime trajectory analysis of ESCC. Left, pseudotime scores of ESCC. Top right, the distribution of ESCCs in healthy group. Bottom right, the distribution of ESCCs in tumor group. (B) Ridge plot showing the cell number distribution of healthy and tumor ESCC along pseudotime trajectory of Figure 3A. (C) Heatmap showing the time-related gene expression profiles during tumor genesis, with gene function annotation on the right. (D) Ridge plots showing the expression score of gene set from different clusters in Figure 3C of healthy and tumor groups, with gray for cell fate1, blue for cell fate2 and red for cell fate3. (E) Scatter plots and trajectory plots showing the expression level of top genes in Figure 3C, with blue for normal tissue and red for tumor tissue.
In our quest to understand the dynamic gene expression changes during ESCC development, we examined the gene expression variations along two distinct differentiation trajectories, revealing two critical gene clusters with specific roles in epithelial cell transformation in ESCC (Figure 3C-D).
Cluster 1 congregates genes that exhibit a downtrend in expression within the ESCC milieu while maintaining or augmenting expression during benign differentiation. This cluster features genes that are cardinal for ESCC progression, including those associated with the Hippo pathway, whose suppression hints at an ESCC-induced subversion of growth control and tissue architecture. Notably, genes governing Oxidative phosphorylation diminish in expression, reflecting a metabolic reprogramming towards glycolysis, quintessential for cancer cell proliferation in ESCC. The Regulation of proteolysis gene group suggests a possible ESCC-induced disruption in proteostasis, potentially elevating the metastatic propensity. A decrement in genes involved in Cellular homeostasis signals a perturbation in intracellular equilibrium, pivotal in ESCC pathogenesis. Moreover, the attenuation of Apoptosis-associated genes indicates an ESCC-favored evasion of cell death, furthering cellular immortality.
Conversely, Cluster 2 enlists genes that are upregulated during ESCC development, embodying genes pivotal to oncogenesis. This includes the PI3K-Akt signaling pathway, a pivotal conduit for cell survival and proliferation, whose upregulation portends an escalated potential for ESCC progression. The elevation in genes implicated in Signaling by TGFβ family members accentuates a reinforced crosstalk with TGF-β, a key modulator of cell fate and oncogenesis. An upsurge in genes driving the Epithelial to mesenchymal transition denotes the critical phenotypic shift endowing epithelial cells with invasive and migratory capabilities, a cornerstone of ESCC metastasis. The accentuated expression of Canonical glycolysis genes indicates a metabolic pivot towards the glycolytic phenotype, a strategic adaptation of ESCC cells. Lastly, the amplification in genes related to Signaling by ALK in cancer underscores a potential oncogenic signaling nexus within ESCC.
In the intricate landscape of ESCC, our focused gene expression analysis has identified pivotal genes that serve as molecular signposts in the transition from normalcy to malignancy (Figure 3E). The genes STAT1, HIF1A, and TGFB3 emerge as upregulated sentinels in the tumorigenic process, maintaining relative stability in non-malignant tissues. STAT1, with its diverse roles in transcriptional regulation, appears to be a cornerstone in ESCC progression, potentially orchestrating cellular proliferation and evading immune detection. The pronounced elevation of HIF1A expression, a critical regulator of the cellular response to oxygen deficit, underscores its possible contribution to neovascularization and the aggressive nature of tumor cells within the oxygen-starved niches of ESCC. Moreover, TGFB3's role in the TGF-β signaling cascade implicates it in modulating immune responses and promoting oncogenic growth. In stark contrast, the genes LHPP, HMOX1, and BCL2 are significantly downregulated in the ESCC milieu, signifying a potential shift in their tumor-regulatory roles. LHPP's reduced expression points to an attenuation of its tumor-suppressive influence, which may play into the hands of ESCC pathogenesis. The curtailed expression of HMOX1 could signal a breach in the antioxidative fortress, potentially escalating oxidative stress—a condition that might be exploited by proliferating ESCC cells. Additionally, the suppressed expression of BCL2, a gene classically involved in cell death inhibition, suggests a nuanced vulnerability of ESCC cells to apoptotic signals, a phenomenon that could be pivotal to understanding ESCC cell survival dynamics.
In conclusion, these dynamic gene expression changes in these clusters provide profound insights into the complex cellular transformations occurring during ESCC development. This study elucidates the intricate molecular mechanisms driving these processes and offers promising directions for further research and potential therapeutic strategies in the context of ESCC.
STAT1 was Identified as a Core Regulator in ESCC Progression
To delve deeper into the underlying regulatory mechanisms of ESCC pathogenesis, we leveraged a differentially expressed genes (DEGs) list derived from the ESCC disease database (https://tcga-xena-hub.s3.us-east-1.amazonaws.com/download/TCGA.ESCA.sampleMap%2FHiSeq.gz) and conducted a comprehensive integrative analysis with our scRNA-seq dataset (Figure 4A & B). Our analysis unveiled 14 commonly upregulated genes (STAT1, VEGF, MMP9, SPP1, HIF1A, TGFB1, EZH2, EGFR, PIK3CA, KRAS, HER2, MMP3, CDH2, CTNNB1) and 8 downregulated genes. Particularly noteworthy was the pronounced downregulation of LHPP, which encodes a phosphatase enzyme involved in the dephosphorylation of phospholysine and phosphohistidine residues. Previous studies implicated its downregulation is frequently associated with tumor progression and poor prognosis. Subsequent correlation analysis between LHPP and transcription factors of the differentially expressed genes revealed a significant negative association with STAT1, while displaying a positive correlation with PPARA (Figure 4C & D).

STAT1 was identified as a core regulator for ESCC. (A) Volcano plot showing the DEGs distribution in rescue, with red for upregulated DEGs and blue for downregulated DEGs. (B) Venn plot showing the overlap between DEGs in scRNA-seq data and public ESCC data. (C) The correlation between the expression levels of LHPP with STAT1 in epithelial cells from scRNA-seq data. (D) The correlation between the expression levels of LHPP with PPARA in epithelial cells from scRNA-seq data. (E) The relative mRNA levels of STAT1, MMP9, LHPP and PCK1 were detected in 21 paired ESCC patient tissues.
To validate our findings, we recruited a cohort of 21 cancer patients for histological confirmation, revealing significant mRNA upregulation of STAT1 and MMP9, coupled with downregulation of LHPP and PCK1 (Figure 4E). However, alterations in PPARA expression were not statistically significant. These findings suggest a potential transcriptional inhibitory role of STAT1 on LHPP expression.
STAT1 Negatively Regulates LHPP Expression in ESCC
To further explore the regulatory roles of STAT1 in ESCC, we conducted transcription factor prediction based on these differentially expressed genes. Our results showed the most prominent TFs were STAT1, SOX2, FOXO3, and PPARA, suggesting their pivotal roles in gene regulation within ESCC (Figure 5A). Among the STAT1-regulated pathways involving LHPP, significant pathways include those related to histidine metabolism, phosphatase activity, and nucleotide catabolism. Alterations in these pathways could impact the metabolic reprogramming and stress response mechanisms in ESCC, potentially contributing to tumor progression and the cancer cells’ ability to evade apoptosis and sustain proliferative signaling (Figure 5B). Coupled with the prediction analysis of the STAT1 transcription factor binding motif, we identified a binding site for STAT1 in the promoter region of LHPP (Figure 5C).

STAT1 negatively regulates LHPP expression in ESCC cell lines. (A) Network diagram of transcription factors showing the interactions between the upregulated transcription factors (red), downregulated transcription factors (blue), and their target differentially expressed genes represented by gray dots. The size of each dot corresponds to the number of target genes associated with each transcription factor, indicating the scale of their regulatory impact. (B) Bar plot showing enrichment analysis of pathways containing STAT1 target genes that include LHPP. (C) Representation predicted binding motif of STAT1. (D) Schematic Representation of the LHPP Promoter Activity Assay. (E) Western blot analysis displaying the overexpression levels of STAT1 proteins in EC9706 and KYSE-150. GAPDH serves as a loading control. (F) Luciferase reporter assay results showing the effect of STAT1 on the LHPP promoter activity in EC9706 and KYSE-150. n = 3 biological replicates. (G) LHPP promoter mutation analysis highlighting a specific sequence mutation from CTCTGGGAAG to CTCTGGCCCG. (H) Luciferase reporter assays illustrating the lack of suppressive activity in promoter Mutation compared to the wild-type promoter in the presence of STAT1. n = 3 biological replicates. (I) Western blot analysis demonstrating the protein expression levels of STAT1 and LHPP following siRNA-mediated knockdown in KYSE-150. GAPDH serves as a loading control. (J) Colony formation assays quantifying the proliferative capacity of KYSE-150 subjected to siRNA-mediated knockdown by si-LHPP compared to non-targeting control (siNC). n = 3 biological replicates.
In the ESCC cell line EC9706 and KYSE-150, we employed Luciferase reporter assays to validate the binding of STAT1 to the LHPP promoter region (Figure 5D). Our result confirmed the activation of the LHPP promoter in the presence of overexpressed STAT1, indicating a functional binding of STAT1 to this specific promoter region (Figure 5E-F). These findings in the progression of ESCC disease indicate that STAT1 negatively regulates LHPP expression by binding to its promoter region, suggesting a significant transcriptional inhibitory role that contributes to the pathophysiology of the disease. To further dissect the mechanism underlying STAT1's influence on LHPP promoter activity, we introduced a point mutation at the putative STAT1 binding site within the promoter region (Figure 5G). This mutation altered the consensus sequence, hypothesized to be critical for STAT1's interaction. The luciferase activity measurements post-mutation, shown in Figure 5H, revealed a significant reduction to near-baseline levels, underscoring the essential role of this binding site for STAT1-mediated transcriptional regulation. To explore the regulatory relationship between STAT1 and LHPP, we conducted western blot analysis following siRNA-mediated knockdown of STAT1. Knockdown of STAT1 led to an increase in LHPP expression, as shown in Figure 5I. In functional assays, cells transfected with si-LHPP exhibited a significantly higher colony formation rate compared to control cells (si-NC), indicating that the loss of LHPP enhances the proliferative capacity of the cells (Figure 5J). This suggests that LHPP acts as a tumor suppressor in this context, and its downregulation may contribute to the oncogenic processes driven by STAT1.
Collectively, our findings highlight the profound capability of single-cell genomics to demystify the complex molecular landscape of ESCC. The identification of pivotal transcription factors such as STAT1, and their associated expression patterns, not only deepens our comprehension of the disease's pathophysiology but also directs us towards more precise and potentially effective therapeutic interventions. Importantly, the discernment of STAT1's regulatory role suggests its critical influence in the progression of ESCC, offering a promising target for future treatment strategies.
Discussion
Single-cell sequencing has provided a more refined view of gene regulatory networks and a vivid perspective of cellular interactions in cancer research, significantly enhancing our understanding of the complex tumor microenvironment. 26 Recent integrative single-cell analyses of ESCC have identified numerous risk predictors, particularly in patients who have undergone surgery and chemotherapy. Cell-cell communication analysis from these studies has uncovered extensive interactions between CCL5 and its receptor CCR5 across various immune cells in tumors with baseline pathological complete response. Additionally, multiplex immunostaining combined with spatial transcriptome analysis revealed significant upregulation of immune response-associated genes in myeloid cells following radiotherapy. 27 Notably, a subset of tumor-associated myeloid cells infiltrating the tumor microenvironment, marked by PD-L1 positivity, exhibited increased expression of immunostimulatory genes (HMGB1 and ISG15), immunosuppressive genes (SIRPA and IDO1), and protumor genes (CXCL8, CCL3, IL-6, and IL-1β). These findings suggest that these genes could serve as potential targets for immunotherapy, especially in combination with PD-L1 inhibitors. 28
In this study, we validated the changes in epithelial, endothelial, and T cell populations during the progression of ESCC through a combination of single-cell and cancer databases, along with patient cohort data. Our findings highlight the potential predictive role of the negative regulation of LHPP by STAT1 in the disease's progression. Our single-cell transcriptomic analysis has revealed major cellular shifts within the ESCC microenvironment. The observed increase in epithelial cells highlights the aggressive nature of the carcinoma, as these cells are the primary contributors to tumor mass. The concomitant surge in endothelial cells is indicative of angiogenesis, which is critical for tumor growth and provides potential routes for metastasis. The prevalence of fibroblasts suggests an enhanced fibrotic reaction, which is often associated with tumor stiffness and can influence the invasive and metastatic potential of the cancer. These changes suggest that the microenvironment of ESCC is not merely a bystander but actively participates in the disease's progression.
The decline in T cells within the tumor milieu is particularly concerning. As the sentinels of the immune system, T cells play a crucial role in recognizing and destroying cancer cells. 29 Their reduced presence points to a possible immune evasion strategy by the tumor, which could be a significant obstacle for immunotherapeutic approaches.
The characterization of cell-type-specific transcriptomic alterations during ESCC progression reveals significant upregulation of genes involved in processes such as fibrosis, EMT, and glycolysis. These findings are consistent with the observed cellular composition changes, where the tumor environment is becoming more conducive to cancer growth and survival. The downregulation of genes involved in immune recognition, apoptosis, and DNA repair within the tumor suggests mechanisms that may contribute to the cancer's resilience and persistence. 30
The differential expression patterns of the genes STAT1, HIF1A, TGFB3, LHPP, HMOX1, and BCL2 underscore the complexity of the tumorigenic process. The upregulation of STAT1, a transcription factor known for its role in cell survival and immune evasion, along with HIF1A and TGFB3, suggests a cellular environment ripe for tumor growth and immune system suppression. Conversely, the downregulation of LHPP, HMOX1, and BCL2 indicates a potential disruption in tumor-suppressive functions, oxidative stress management, and apoptotic processes, respectively.
The role of STAT1 is further emphasized by its identification as a core regulator in ESCC. Our transcription factor analysis and subsequent validation by qPCR analysis confirm the significant upregulation of STAT1 in ESCC tissues. The negative correlation between STAT1 and LHPP expression suggests a possible direct regulatory relationship.
These findings collectively enhance our understanding of the cellular and molecular dynamics of ESCC. The elucidation of cell-type-specific changes and gene expression profiles provides critical insights into the disease's biology and suggests potential therapeutic targets. For example, strategies that could reverse the immunosuppressive TME, target the metabolic shifts in cancer cells, or inhibit the pro-tumorigenic activities of pathways regulated by STAT1 may prove to be beneficial. However, our study is not without its limitations.
While we have made significant progress in validating the regulatory interaction between STAT1 and LHPP, our research has yet to extend into animal models to examine their expression in vivo or to establish potential tumor intervention models. This is an important next step, as in vivo studies could provide more comprehensive insights into the functional roles of STAT1 and LHPP in the context of ESCC. Furthermore, clinical plasma samples from patients, given their simplicity and sensitivity, may serve as crucial tools for molecular target detection, presenting another avenue for future investigation. 31 Single-cell omics research has offered a more detailed and precise perspective on clinical diseases, enabling the identification of subtle cellular heterogeneities that might be overlooked by bulk analysis. Additionally, future studies leveraging spatial transcriptomics could map disease processes in a manner akin to charting an intricate landscape, potentially revealing novel therapeutic targets and furthering our understanding of the disease's underlying mechanisms. 32
Conclusion
Our multi-faceted analysis paints a detailed picture of the ESCC landscape, from the cellular composition of the TME to the intricate gene expression changes driving the disease. Our study highlights STAT1 as a core regulator in ESCC, directly influencing LHPP expression provides a valuable framework for future research and potential interventions aimed at combating this challenging cancer.
Footnotes
Acknowledgements
The authors would like to thank all staff and volunteers who contributed to this study.
Author Contributions
Xia Chen: designed and supervised the study, performed the experiments and related analyses, and drafted the manuscript; Zhiyun Xu and Wubi Zhou: performed bioinformatic analysis and manuscript writing; Jian Huan and Dawei Bao: writing – review & editing; all authors have read and approved the article.
Consent for Publication
All authors are consentient for publication.
Declaration of Conflicting Interests
The authors declared no potential conflicts of interest with respect to the research, authorship, and/or publication of this article.
Availability of Data and Materials
The datasets used and/or analyzed in the current study are available from the corresponding author upon reasonable request. The raw data of healthy and tumor human tissues were from GSE160269 in GEO database. The analysis code related to this study has been uploaded to the GitHub repository and is accessible at ![]() .
.
Funding
The authors received no financial support for the research, authorship, and/or publication of this article.