
Abstract
Introduction
Hematological malignancies, which arise from bone marrow cells and the lymphatic system, represent a significant global health issue. According to the Global Cancer Statistics in 2018, there were 1,186,598 new cases and 690,002 deaths reported due to hematologic malignancies, which encompass condition such as leukemia, lymphoma and multiple myeloma. 1 The spectrum of hematological malignancies is varied and includes acute myeloid leukemia (AML), 2 chronic myeloid leukemia (CML), 3 acute lymphocytic leukemia (ALL), 4 chronic lymphocytic leukemia (CLL), 5 diffuse large B cell lymphoma (DLBCL), 6 mantle cell lymphoma (MCL), 7 multiple myeloma (MM), 8 Hodgkin lymphoma (HL), 9 follicular lymphoma (FL), 10 Burkitt lymphoma (BL), 11 among others.
Despite differences in incidence rates among these malignancies, a combination of genetic and environmental factors is recognized as their primary underlying causes. Treatment approaches are typically multifaceted, involving chemotherapy, radiation therapy, and targeted therapies. Hence, the identification of molecular markers that can enhance the diagnosis and treatment of hematologic malignancies is of utmost importance. Circular RNAs (circRNAs), which are a subclass of non-coding RNAs, are characterized by their unique closed circular structure that lacks a 5′ end cap or 3′ end poly-(A) tail. These molecules have garnered attention due to their stability, high conservation across species, and tissue-specific expression, enabling them to resist the degradation processes that ofen affect linear RNAs. Increasing evidence suggests that circRNAs play a significant role in carcinogenesis, emphasizing their importance in pathology of disease.12,13 The aim of this study is to explore the diagnostic and prognostic potential of circRNAs in hematologic malignancies, focusing on their capacity as molecular markers that could improved diagnosis and therapeutic strategies. By exploring the roles of circRNAs in hematologic malignancies, this research aspires to provide valuable insights that could enhance the development of precision medicine in oncology.
Materials and Methods
Protocol
This study was registered in PROSPERO (CRD42020188627) and was conducted according to the preferred reporting items for a systematic review and Meta-Analysis of Diagnostic Test Accuracy Studies (PRISMA-DTA) guidelines. 14 Data enrollment and processing adhered to the guideline set forth by the Francis A. Countway Library and the Health Information Research Unit.
Literature Search
We conducted a comprehensive literature search across various databases including Google Scholar, MEDLINE, Scopus, PubMed, Embase, ScienceDirect, Ovid-Medline, Chinese National Knowledge Infrastructure, WanFang and SinoMed. The search was conduct using medical subject headings (MeSH), Entree, and text word from the inception of the databases up to June 12, 2024, without any language limitations. The search terms included “hematologic malignancy”, “hematologic neoplasm”, “leukemia”, “leucocythaemia”, “leucocythemia”, “circular RNAs”, “circRNA”, “circular RNA”, “closed circular RNA”, and “circular intronic RNA”. For non-English publications, we plan to utilize voluntary interpreters to provide PDF full-text access through Cochrane Task Exchange. Additionally, a manual search of relevant reviews, conference abstracts, commentary editorials, and letters was also conducted. Any inconsistencies identified during the review process were referred to a third reviewer for a final determination.
Enrolled Criteria
Eligible studies for the meta-analysis were required to meet the following criteria: The studies must be diagnostic in nature or provide hazard ratios (HR) with 95% confidence intervals (CIs) for overall survival (OS) that include sensitivity (SEN), specificity (SPE), and area under the curve (AUC). Studies assessing the diagnostic and/or prognostic significance of circRNA signatures were included. Data that could be calculated or extracted from the publication, such as information from experimental and control groups, were also eligible. The exclusion criteria included: Studies utilizing non-human models. Studies that did not include a control group. Articles categorized as commentaries, reviews, editorials, or similar types.
Data Extraction
Data from the eligible studies were extracted independently by two authors. The extracted information included: first author, country of publication, year of publication, Number of cases and controls, circRNA detection methods, samples sources(serum or plasma), circRNA name, circRNA expression signatures, SEN and SPE, true positive (TP), false positive (FP), false negative (FN) and true negative (TN) rates, cutoff values and AUC values, follow-up time, HR with 95% CI for OS. The extracted data were obtained and analyzed using RevMan 5.3 (Cochrane, London, UK) or STATA (College Station, USA). The quality of the included studies was assessed using the 14-item Quality Assessment of Diagnostic Accuracy studies (14-item QUADAS) and the Newcastle-Ottawa Scale (NOS).
Heterogeneity Analysis
Heterogeneity among the studies was evaluated using Chi-squared (Chi2) tests and I2 statistics, along with L’Abbe and Galbraith plot analysis. Specifically, the Chi2 tests and the I² statistic were employed to assess the variability between studies. An I² value of less than 50% was interpreted as indicative of no significant heterogeneity among the studies.
Quality and Bias Assessment
The quality and risk of bias assessment were performed independently by two reviewers. For the diagnostic studies, the QUADAS checklist with 14 criteria was employed. 15 Each criterion was rated for risk of bias as “low”, “high” or “unclear”. The scoring for these risk levels was as follows: “low” risk was assigned a score of “1”, “high” risk received “0”, and “unclear” risk was marked as “U”. A cumulative score greater than 8 on the NOS indicated a low risk of bias in the studies evaluated. 16 For bias assessments, the NOS checklist assessed selection, comparability, and outcome, with a cumulative score of 9 applicable to retrospective cohort studies. Studies that achieved an overall evaluation score exceeding 6 were classified as high quality.
Statistical Analysis
Data extraction and effect size calculations were conducted using STATA 16.0 (Stata Corp, TX, USA) and RevMan 5.3 (Nordic Cochrane Center, Copenhagen, Denmark). Endnote 7 (Clarivate Analytics, London, UK) was employed to identify duplicate entries among the enrolled studies. When no significant heterogeneity was detected among studies, a fixed-effect model was chosen for aggregating pooled results. The pooled SEN and SPE, summary receiver operating characteristics (SROC), AUC, positive likelihood ratio (PLR), negative likelihood ratio (NLR), diagnostic odds ratio (DOR) along with corresponding 95% CIs were calculated. In the prognostic meta-analysis, the hazard ratios (HRs) and their respective 95% CIs were analyzed. To assess potential publication bias across the studies, Deek's funnel plot asymmetry test, visual funnel plot, and the Egger and Begg tests were conducted, with a p-value less than 0.05 being considered statistically significant.
Results
Literature Search
The literature search yielded a total of 2228 publications from various online databases. After removing duplicates, 969 articles remained. An initial screening of titles and abstracts led to the exclusion of 292 articles. From the remaining 385 publication, a full-text eligibility evaluation identified 156 non-randomized controlled trials, 107 animal studies and 49 reviews, all of which were subsequently discarded. Ultimately, 73 studies were included in the final analysis: 40 studies focused on diagnosis,17–56 and 63 studies on prognosis,17–22,24,26,29,31–39,41,43–49,51–53,55–88 as detailed in the PRISMA standards (Figure 1).

Study enrollment procedure in terms of the standards of the PRISMA diagram. PRISMA: preferred reporting items for systematic reviews and meta-analyses.
Study Characteristics and Quality Assessment
The main characteristics of studies included in the diagnostic and prognostic analysis are summarized in Table 1 and Table 2. The publication years for these studies ranged from 2018 to 2024, encompassing a pooled patient population of 11,366 individuals. This included 4314 cases for the diagnostic synthesis and 7052 cases with survival data for the prognostic meta-analysis. Additionally, 1794 and 4289 healthy controls were included in the diagnostic and prognostic synthesis, respectively. The follow-up period varied from 10 to 300 months, providing a robust foundation for our analyses, as shown in supplementary Figure S1 and Tables S1 and S2.
Main Characteristics of Studies for Diagnosis Analysis.

CML, chronic myeloid leukemia; CLL, chronic lymphocytic leukemia; AML, acute myelogenous leukemia; DLBCL, diffuse large B cell lymphoma; MCL, mantle cell lymphoma; FL, follicular lymphoma; BL, Burkitt lymphoma; MM, multiple myeloma; U, upregulated expression; D, downregulated expression; SEN, sentivity; SPE, specifity; AUC, area under the curve; TP, true positive; FP, false positive; FN, false negative; TN, true negative.
Clinical Characteristics of Articles Enrolled in the Prognosis Analysis
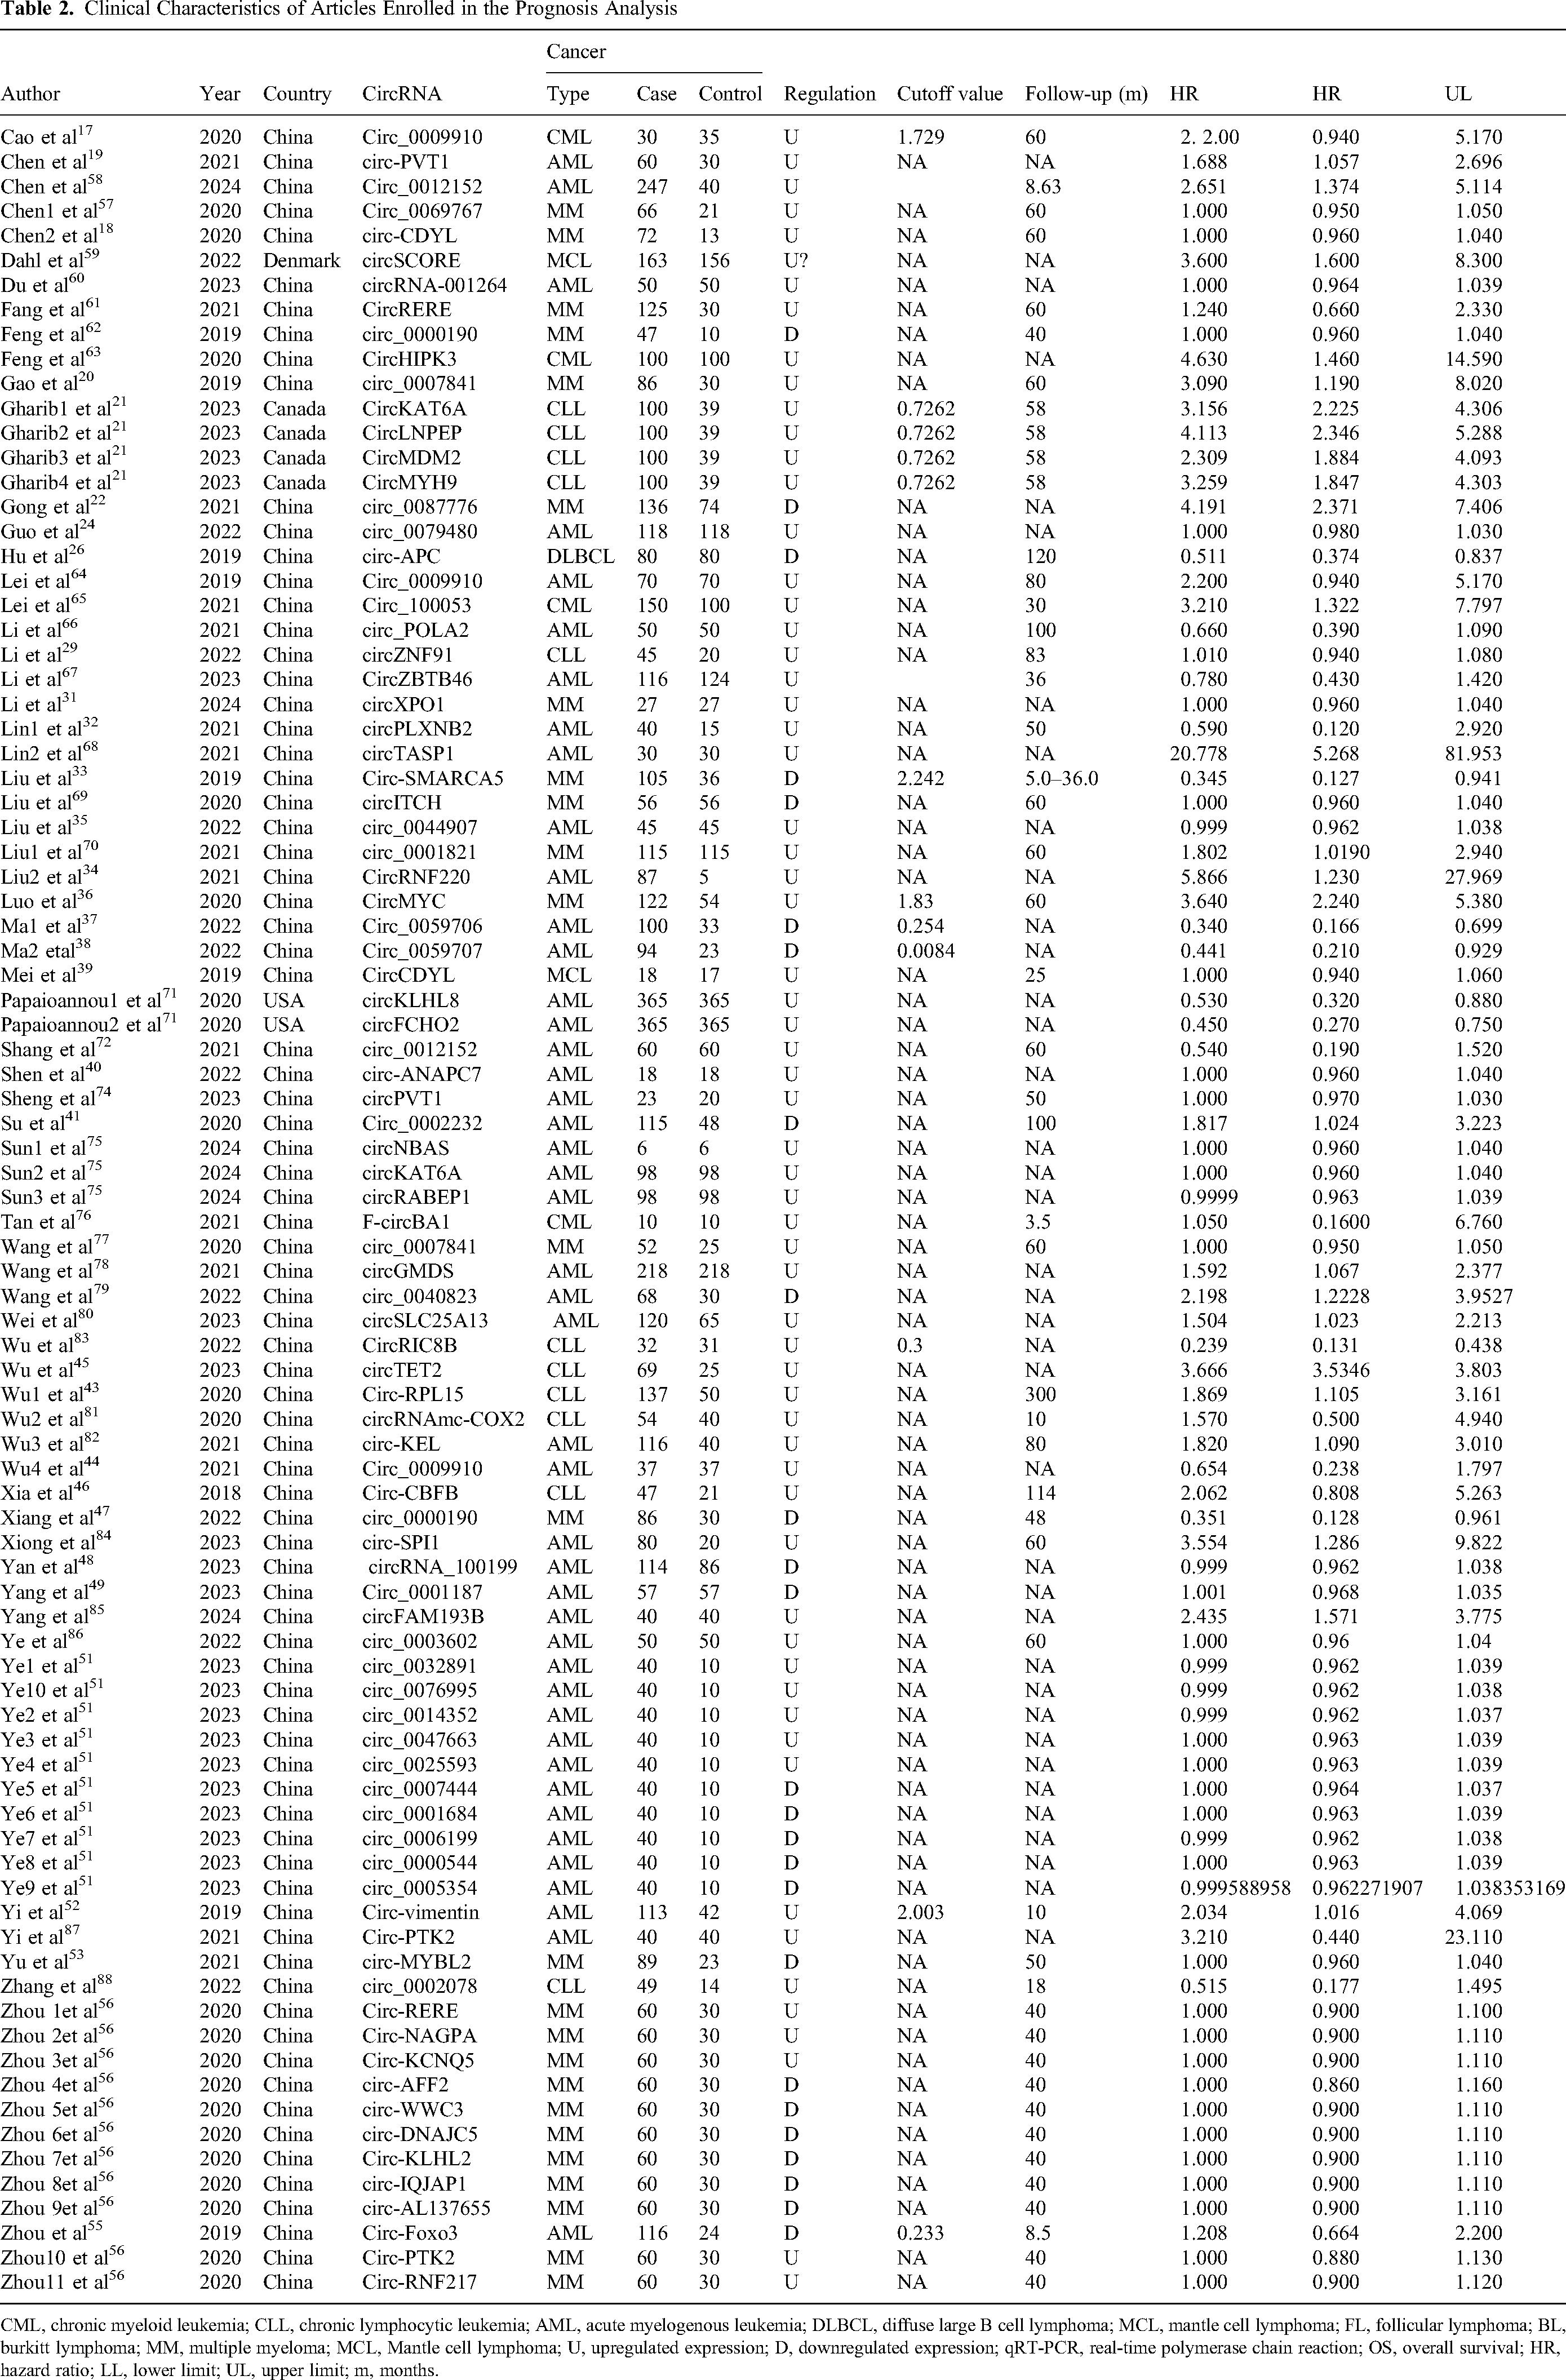
CML, chronic myeloid leukemia; CLL, chronic lymphocytic leukemia; AML, acute myelogenous leukemia; DLBCL, diffuse large B cell lymphoma; MCL, mantle cell lymphoma; FL, follicular lymphoma; BL, burkitt lymphoma; MM, multiple myeloma; MCL, Mantle cell lymphoma; U, upregulated expression; D, downregulated expression; qRT-PCR, real-time polymerase chain reaction; OS, overall survival; HR, hazard ratio; LL, lower limit; UL, upper limit; m, months.
Diagnostic Accuracy Analysis
A total of 39 publications were identified that examined the clinical value of circRNAs in diagnosis. These studies included 4314 cases of leukemia and 1794 control cases. The forest plots illustrating pooled SEN, SPE, SROC curve and Fagan's plot are displayed in Figure 2. Specifically, the pooled SEN and SPE were each found to be 0.79 (95% CI, 0.75–0.83). The SROC curve illustrated an AUC was 0.86 (95% CI, 0.83–0.89) (Figure 2C). Using Fagan's nomogram, a pre-test probability of 20% was determined (Figure 2D). In supplementary Figure S1, the forest plots of pooled PLR, NLR, diagnostic score and DOR were presented. The PLR and NLR were calculated to be 3.82 (95% CI, 3.23–4.52) and 0.26 (95% CI, 0.22–0.32), respectively, (Figure S1A). The summary assessment found that the circRNA diagnostic score leukemia was 2.67 (95% CI, 2.42–2.92)with a DOR of 14.43 (95% CI, 11.21 −18.59) (Figure S1B). A likelihood ratio scattergram was employed to evaluate the clinical utility of various diagnostic tests, which were categorized into four quadrants (Figure S1C). Most studies fell into the lower right quadrants, indicating a consistent trend of circRNAs being useful for diagnosing hematologic malignancies, although one study showed an outlier. These results strongly suggest that circRNAs are promising diagnostic tools for detecting of hematologic malignancies, enhancing diagnostic accuracy and overall clinical management.

Diagnostic accuracy analysis. Forest plots of pooled sensitivity (A), specificity (B), SROC curve (C) and Fagan's plot (D) for the overall combined diagnostic effect size. SROC: summary receiver operating characteristic.
Diagnostic and Prognostic Value of circRNA Expression Inhematologic Malignancy
The relative ratio (RR) and corresponding 95%CI from 39 diagnostic studies yielded a pooled RR of 2.12 (95% CI: 2.01–2.22, P < 0.001) (Figure 3A). For overall survival analysis, data from 65 studies were used to calculate HRs based on Kaplan-Meier curves. The analysis of oncogenic and tumor-suppressor circRNAs provided a pooled HR of 1.02 (95% CI: 1.00–1.05, P < 0.00001) (Figure 3B).
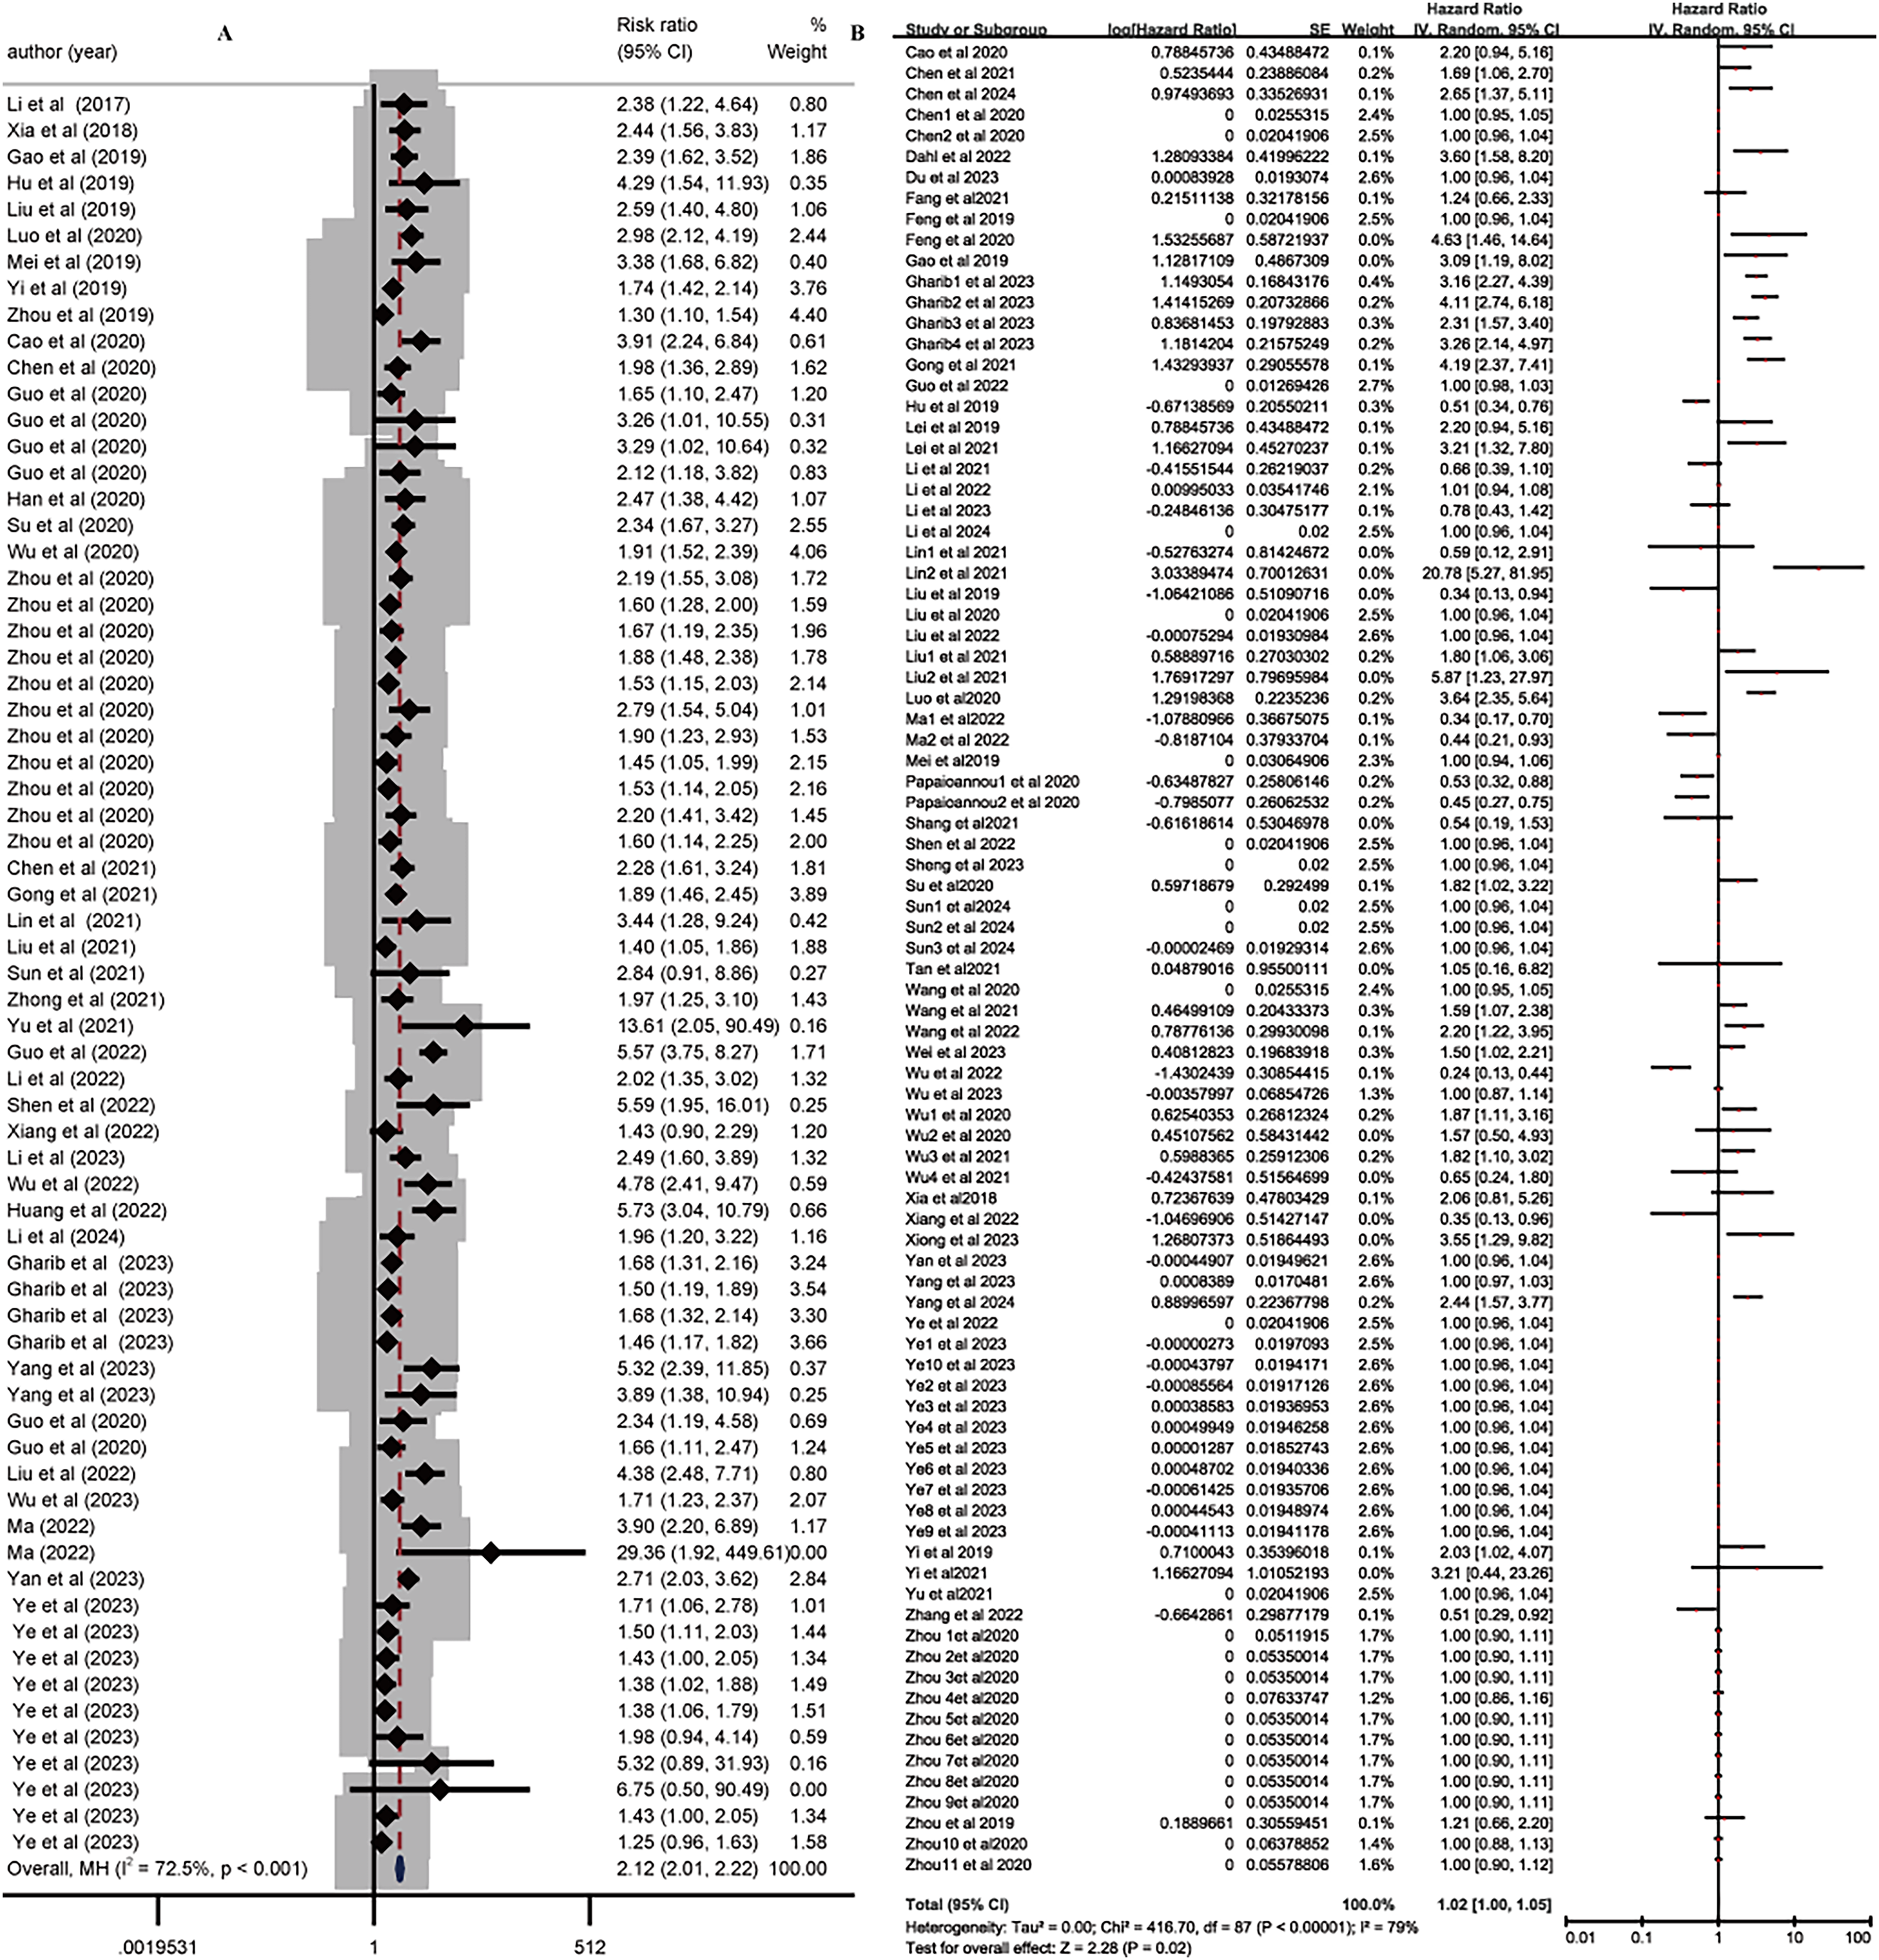
Diagnostic and prognostic value of circRNA expression in cancer. Diagnostic value (RR) of circRNA expression in different cancer (A). Forest plots for HR according to circRNA expression in cancer(B). circRNA: circular RNAs; RR: risk ratio; HR: Hazard ratio.OS: overall survival.
Influence Analysis and Subgroup Study
Influence analysis was conducted to identify outlier values among combined effect sizes. The fixed effect estimates indicated no outlier in either in diagnostic and prognostic studies (Figure 4A and 4B), reinforcing the reliability of our results. A stratified analysis based on clinicopathologic features revealed relationships between circRNA expression and clinical characteristics in diagnosing and prognosing patients with leukemia (Figure 5). In addition, further evaluation of the reasons for influence analysis in diagnosis and prognosis revealed that there were diagnostic abilities in different subgroups (the RR value of myeloid leukemia: 2.37, 95% CI:2.19–2.57, P < 0.001; circRNA of lymphoid leukemia: 1.86, 95% CI: 1.70–2.03, P = 0.026; circRNA of multiple myeloma: 2.01, 95% CI:1.84–2.19) (Figure 5A). Additionally, varying prognoses in different subgroups were observed: myeloid leukemia: HR value of 1.01 (95% CI: 0.99–1.03, P < 0.001); lymphoid leukemia: HR value of 1.25 (95% CI: 1.10–1.43, P < 0.001); multiple myeloma: HR value of 1.01 (95% CI:0.98–1.05) (Figure 5B). These findings demonstrate significant correlations between clinicopathological factors and circRNA expression levels in patients with leukemia.

Sensitivity analysis. The sensitivity analysis of the overall combined diagnostic meta-analysis (A) and prognostic meta-analysis (B).

Subgroup analysis of diagnostic and prognostic meta-analysis in different types of hematological malignancies. Subgroup study for RR value and OS according to different types of hematological malignancies in diagnostic meta-analysis (A) and prognostic meta-analysis (B). RR: relative risk; OS: overall survival.
Publication Bias and Sensitivity Analyses
The Deeks’ test revealed no evidence of publication bias in the diagnostic studies (P = 0.29, Figure 6A). Egger's tests of diagnostic and prognostic articles indicated no publication biases, as depicted in Figures 6B and 6C. Quality evaluations of diagnostic and prognostic accuracy for the studies included in the analysis are shown in figure S2. L’Abbe and Galbraith plots asymmetry tests further confirmed the absence of publication bias in diagnostic studies (Figures S2A and S2B), while Galbraith plot asymmetry for prognostic studies is displayed in Figure S2C.

Funnel plots of publication bias. Deeks’ funnel plot asymmetry test and Egger’ s funnel plot for diagnostic studies (A and B); Egger’ s funnel plot for prognostic tests (C).
Discussion
The diagnosis of malignant leukemia continues to rely on biomarker, yet the SEN and SPE of these markers often fall short of optimal standards. As a result, many patients are diagnosed only at advanced stages of the disease, when leukemia is associated with higher mortality rates and significant financial burdens. Thus, the development of highly sensitive biomarkers is critical for the early detection of hematologic malignancies. In recent years, circular RNAs (circRNAs) have emerged as promising biomarkers in various types of malignant tumors, including liver and bladder cancers. The unique closed-loop structure of circRNAs contributes to their stability compared to linear RNA, making them attractive candidates for diagnostic and prognostic applications.89,90 While there was a traditional review of circRNAs in hematological malignancies in 2019, it did not adhere to the relevant Equator network guidelines and lacked comprehensive visual representation. 91 Previous meta-analyses have focused on specific conditions like multiple myeloma, 92 but our study represents the first comprehensive meta-analysis examining circRNAs across all hematological malignancies. Our findings reveal the potential of circRNAs as effective diagnostic and prognostic biomarkers for hematologic malignancies in clinical settings. If circRNAs can be validated as reliable markers for early diagnosis, both patients and clinicians stand to benefit significantly from their implementation. In summary, the integration of circRNAs into diagnostic and prognostic frameworks could enhance early detection strategies for malignant leukemia, ultimately improving patient outcomes and reducing the financial impact of late-stage disease diagnosis. Further research is essential to fully understand the clinical applications of circRNAs in hematologic malignancies.
This meta-analysis was constructed using 73 qualifying studies retrieved from various databases.To our best knowledge, this represents the inaugural meta-analytic examination of hematologic malignancies. Our synthesized meta-analytic metrics for circRNAs—SEN, SPE, and DOR were 79.00%, 79.00%, and 14.43, respectively. SEN and SPE are pivotal indicators of diagnostic accuracy, while the DOR encapsulates the combined impact of both. The DOR value of 14.43 for circRNAs indicates a highly significant diagnostic utility for hematologic malignancies patients. The PLR and NLR were 3.82 and 0.26, respectively. The PLR implies that hematologic malignancies patients are 14.43 times more likely to test positive for circRNAs than healthy individuals, while the NLR suggests a 26.00% chance of a false-negative outcome from circRNA signature detection. The AUC or the circRNA's combined receiver operating characteristic (ROC) curve in diagnosing hematologic malignancies was 0.86. The AUC of SROC is a measure of the overall diagnostic test performance, with values ranging from 0.75 to 0.92 considered acceptable and indicative of excellent performance. The AUC indicates that circRNAs may be reliable for diagnosing hematologic malignancy diagnostic. But publication bias was detected across the studies included in this meta-analysis, thus subgroup was analyzed in diagnostic and prognostic articles. Myeloid, lymphoid leukemia, and multiple myelom circRNA showed that they were different. Specially, lymphoid leukemia had a negative impacct on prognosis (HR = 1.25, 95% CI: 1.10–1.43, P < 0.001). While Subgroup analysis based on circRNA expression levels were conducted for prognostic studies, revealing that down-expression an overexpression of circRNAs was associated with no different prognosis (Figure S3). The impact of circRNAs on prognosis varied by geographic origin, with foreign studies a negative effect (HR = 1.88, 95% CI: 0.99–3.57, P < 0.001; Figure S4). Additionally, circRNAs of different leukemia were significantly different in different years. The circRNA is bad favorable prognosis in 2021 and 2022. (HR: 1.61 and 0.98, 95% CI: 1.16–2.24 and 0.92–1.04, P < 0.05, respectively; Figure S5). Thus, circRNAs may emerge as potential markers for both diagnosis and prognosis in hematological malignancies. This study, however, has several limitations. Firstly, the data mainly originated from China, with limited representation from other regions. Secondly, the study is at the manuscript level rather than the patient level, precluding access to detailed raw data from the authors. Thirdly, demographic factors such as gender, age, and ethnicity may influence the interpretation of the meta-analysis results. Lastly, the studies on circRNAs as diagnostic and prognostic biomarkers in leukemia are relatively recent, and the number of studies could affect the meta-analysis outcomes.
The current meta-analysis indicated that circRNAs have the potential to serve as valuable diagnostic and prognostic markers in hematologic malignancies. Additionally, the molecular mechanism of circRNAs in leukemia necessitates further investigation. Thus, future large-scale prospective studies are essential to definitively establish reliable diagnostic and prognostic biomarkers for hematologic malignancy. Consequently, it is hypothesized that circRNAs could be utilized by clinician for precise diagnostics and prognostics in the future.
Supplemental Material
sj-doc-1-tct-10.1177_15330338241285149 - Supplemental material for Circular RNA as Diagnostic and Prognostic Biomarkers in Hematological Malignancies:Systematic Review
Supplemental material, sj-doc-1-tct-10.1177_15330338241285149 for Circular RNA as Diagnostic and Prognostic Biomarkers in Hematological Malignancies:Systematic Review by Liyun Gao, Junfei Fan, Jiayin He, Wenyan Fan, Xiangxin Che, Xin Wang and Chunhua Han in Technology in Cancer Research & Treatment
Footnotes
Acknowledgements
Not applicable.
Availability of Data and Materials
Data and materials will be provided to those who are interested in this meta-analysis by the correspondence.
Authors’ Contributions
Liyun Gao contributed to the study conception. Materials were prepared by Junfei Fan. Data collection and analysis were performed by Jiayin He. The first draft of the manuscript was written by Xiangxin Che. Wenyan Fan and Xin Wang modified the manuscript. Chunhua Han designed the study. All authors read and approved the final manuscript.
Declaration of Conflicting Interests
The authors declared no potential conflicts of interest with respect to the research, authorship, and/or publication of this article.
Funding
The author(s) disclosed receipt of the following financial support for the research, authorship, and/or publication of this article: This work was funded by the grants of the National Natural Science Foundation of China (81502843, 81360447), Jiangxi Natural Science Foundation Project (20202BAB206067, 20232BAB206141), Jiujiang base and talent plan-high level scientific and technological innovation talent project (S2020QNZZ011), Future project of Jiujiang administration of traditional Chinese medicine (2021b697), Special Research Project of Jiangxi Cognitive Science and Interdisciplinary Research Center (RZYB202206), Science and Technology Plan Project of Jiangxi Provincial Health Commission (SKJP220225877, 202311158). Innovation and Entrepreneurship Training Program for College Students (202311843003), Department of Science and Technology of Hubei Province with the Project (2022BCE045), Talent Introduction Projects of Hubei Polytechnic University (22xjz16R).
Ethics Approval and Consent to Participate
Our study was approved by The Mercy Health Research Ethics Committee (approval no. XYZ123).
Patient Consent for Publication
All patients provided written informed consent prior to enrollment in the study.
Supplemental Material
Supplemental material for this article is available online.
References
Supplementary Material
Please find the following supplemental material available below.
For Open Access articles published under a Creative Commons License, all supplemental material carries the same license as the article it is associated with.
For non-Open Access articles published, all supplemental material carries a non-exclusive license, and permission requests for re-use of supplemental material or any part of supplemental material shall be sent directly to the copyright owner as specified in the copyright notice associated with the article.