
Abstract
Introduction
Breast cancer ranks among the most prevalent types of cancers and stands as the foremost cause of cancer-related mortality in women globally, accounting for approximately 2.3 million new cases and 0.685 million deaths in 2020. 1 According to 2016 cancer registry data in China, the incidence rate for breast cancer is 45.37/100,000, with a mortality rate of 10.62/100,000, accounting for 16.7% and 8.1% of all cancers in female. 2 Early-stage breast cancer generally has a better prognosis. According to data from the American Cancer Society, the 5-year survival rate is over 96% for stage I, whereas it is less than 31% for stage IV. 3 A multi-center study in China also found that the 5-year survival rates for patients with stage I, II, III, and IV were 96.5%, 91.6%, 74.8%, and 40.7%, respectively. 4 However, in China, 21.6%% of the clinic patients were in stage III and IV, 5 there is an urgent need to develop specific biomarkers for the treatment of breast cancer patients.
Mammalian cells possess heparanase (HPSE), which cleaves heparan sulfate (HS) chains at specific intrachain sites, regulates the remodeling of the basement membranes and controls various biological processes related to tumor progression. Studies have shown that HPSE is associated with the prognosis of various cancers, including gastric cancer, 6 pancreatic cancer, 7 Glioblastoma Tumors, 8 melanoma, 9 hepatocellular carcinoma, 10 esophageal cancer 11 and breast cancer. 12 Our previous study also indicated that increased HPSE expression is associated with poor Overall survival, Post Progression survival, Relapse Free survival, and Distant Metastasis Free survival rates in breast cancer. High HPSE expression contributes to increased immune infiltration levels of macrophages, CD8+ and CD4+ T cells and B cells. By up-regulating IL-10, it leads to M2 polarization (CD163, VSIG4) in macrophages, thereby promoting tumor growth. In breast cancer, HPSE may serve as a novel biomarker for immune infiltration and prognosis. 13 In this study, we will further explore the prognostic value of HPSE and its relationship with immunotherapy response in patients with breast cancer, to improve the effectiveness of immunotherapy and increase the survival outcomes for breast cancer patients.
Materials and Methods
BRCA Datasets and Preprocessing
The TCGAbiolinks 14 package, based on R software, was utilized to download RNA sequencing data (fragments per kilobase of transcript per million mapped reads [FPKM] values) and clinical information from the The Cancer Genome Atlas (TCGA)-breast invasive carcinoma (BRCA) cohort. Subsequently, FPKM values were converted into transcripts per kilobase million (TPM) values which are more comparable to the results from microarray experiments. The corresponding somatic mutation data of patients in the TCGA- BRCA cohort were downloaded from the cBioportal database. Additionally, we obtained some clinical data from the BEST dataset (https://rookieutopia.com/app_direct/BEST/).
Immune Cell Infiltration Estimated by Single-Sample Gene Set Enrichment Analysis (ssGSEA) Algorithm
By using the single-sample gene set enrichment analysis (ssGSEA) method, we measured the infiltration levels of 24 immune cell types in the tumor microenvironment. Based on published papers,15,16 specific marker genes were identified for each type of immune cell.. In our study, we included 24 immune cells associated with immunity in the deconvolution approach, 17 and genes related to immunity were extracted from recently published studies.18,19
Drugs Analysis
Cancer cell line drug sensitivity data were obtained from the Cancer Therapeutics Response Portal (CTRP, https://portals.broadinstitute.org/ctrp.v2.1/) 20 and the PRISM database (https://www.theprismlab.org/). 21 Both datasets provide the area under the dose-response curve (Areas Under the Curve [AUC]) to measure drug sensitivity, with lower AUC values indicating greater sensitivity. K-Nearest Neighbor (K-NN) imputation was applied to obtain missing AUC values. A ridge regression model yielded drug sensitivity estimates for every patient in the three datasets. Human cancer cell line expression profiles were obtained from the Broad Institute Cancer Cell Line Encyclopedia (CCLE) database (https://sites.broadinstitute.org/ccle). 22
Nomogram Analysis
To assess the performance of HPSE as a predictor of OS in BRCA patients, based on the results of multivariate cox regression analysis, a nomogram was constructed using the rms package+ in R software. A prognostic risk score was developed considering the stage and HPSE. The higher total points indicate the worse prognosis. 23 Using nomograms, we predicted overall survival ability to evaluate the association between BRCA risk score and overall survival in patients. Points were assigned to each variable based on Cox regression coefficients. Drawing a vertical line between the total points axis and the 1, 3, 5, and 10 years probability axes allowed us to determine the survival probability.
In Vivo Studies
All in vivo experiments were approved by the Animal Ethics Committee of Beijing Hospital of Traditional Chinese Medicine (approval number: 2019100201). Murine triple-negative breast cancer cell line 4T1 (Cell Bank of the Chinese Academy of Sciences, Shanghai,China) were cultured in Dulbecco's Modified Eagle Medium (DMEM) containing 10% fetal bovine serum plus 1% penicillin-streptomycin solution. The cell was authenticated by short tandem repeat. Balb/C mice, 8-10 weeks old, female (n = 7), purchased from Vital River company, were bred in the SPF laboratory animal room. Because the 4T1 cell model was mature in our laboratory, we selected the 4T1 cell line for modeling.
The murine triple-negative breast cancer cell line 4T1 was treated with heparinase III (GlycoNovo E-REHEPIII) at 25 mIU/mL to establish the HPSE high expression group. Tumor cells were injected into the mammary pads of Balb/C mice in situ, following the same procedure as previously described. 24 Female BALB/c mice were anesthetized with isoflurane gas and inoculated with 50 µL cell suspension (5 × 10⁵) under the fourth mammary fat pad on the right side of each mouse. In addition, the HPSE inhibitor OGT2115 (MedChemExpress, cat#HY-100898) was prepared as a 1 mM storage solution and diluted at 1:20 for 200 μL intraperitoneal injection, constituting the HPSE low expression group. Control group is the control of HEPIII group. And 5% DMSO solution was used as the solvent control group of OGT2115 group. The end point was when there was necrosis in the tumor center or when the body weight of the mice decreased by 10%. After the experiment the mice were euthanized by an overdose of 2% sodium pentobarbital (150 mg/kg), and cervical spondylolysis was performed to confirm the death. The reporting of this study conforms to ARRIVE 2.0 guidelines. 25 And our care about the mice followed the Guide for the Care and Use of Laboratory Animals, we make efforts to minimize the number of animals utilized and to decrease their suffering. 26
Mouse mammary gland tissue was fixed in 10% neutrally buffered formalin at room temperature for 24 h and then underwent paraffin-embedding. 3 μm paraffin sections were cut for IHC staining: The slides were deparaffinized with xylene and a descending alcohol series, followed by heating in 10 mM citrate buffer for 20 min. To block nonspecific binding, goat serum was applied at 37 °C for 1 h after 10 min of hydrogen peroxide treatment. Rabbit anti-PD-L1 (1:100; 64988 T, CST), anti-TNF-α (1:50; YM3478, Immunoway), and Mouse anti-CTLA-4 (1:100; sc-376016, SCBT) antibodies were incubated overnight at 4 °C and horseradish peroxidase (HRP)-conjugated secondary antibodies were then added. The samples were scanned using PRECICE 500B fully automatic slice scanner and digitized images were managed using i-Viewer software. The positive region was calculated by Image J with the IHC tool plug-in.
Statistical Analysis
This study utilized R-4.0.4 for statistical analyses. For quantitative data, Student's t-tests were employed to assess statistical significance, while Wilcoxon rank-sum tests were used for non-normally distributed data. . And data were analyzed using one-way ANOVA followed by Bonferroni post hoc test for multiple comparisons if the collected data assumed normal distribution and equal variances. If the data did not assume normal distribution or equality of variances, Kruskal-Wallis followed by Dunn's multiple comparisons test was used. Survival analyses were conducted utilizing the Kaplan-Meier method and the Cox proportional hazards model. The “Survival” and “Survminer” packages were utilized to assess the association between factors and prognosis. To categorize the utilized BRCA samples into subtypes, the “survival” package's surv-cutpoint function was applied. Correlation analysis in the present study was evaluated using either Pearson or spearman correlation coefficients and conducted with the Corrplot package in R software. SPSS 23.0 was employed to analyze the positive rate of IHC according to tissue staining tests.
Results
The Relative Expression Level of HPSE in Breast Cancer
We compared the expression level of HPSE in breast cancer using the TCGA database, which includes 1090 patients. According to the results, cancer tissues exhibited a higher level of HPSE transcription compared normal tissues (Figure 1A).
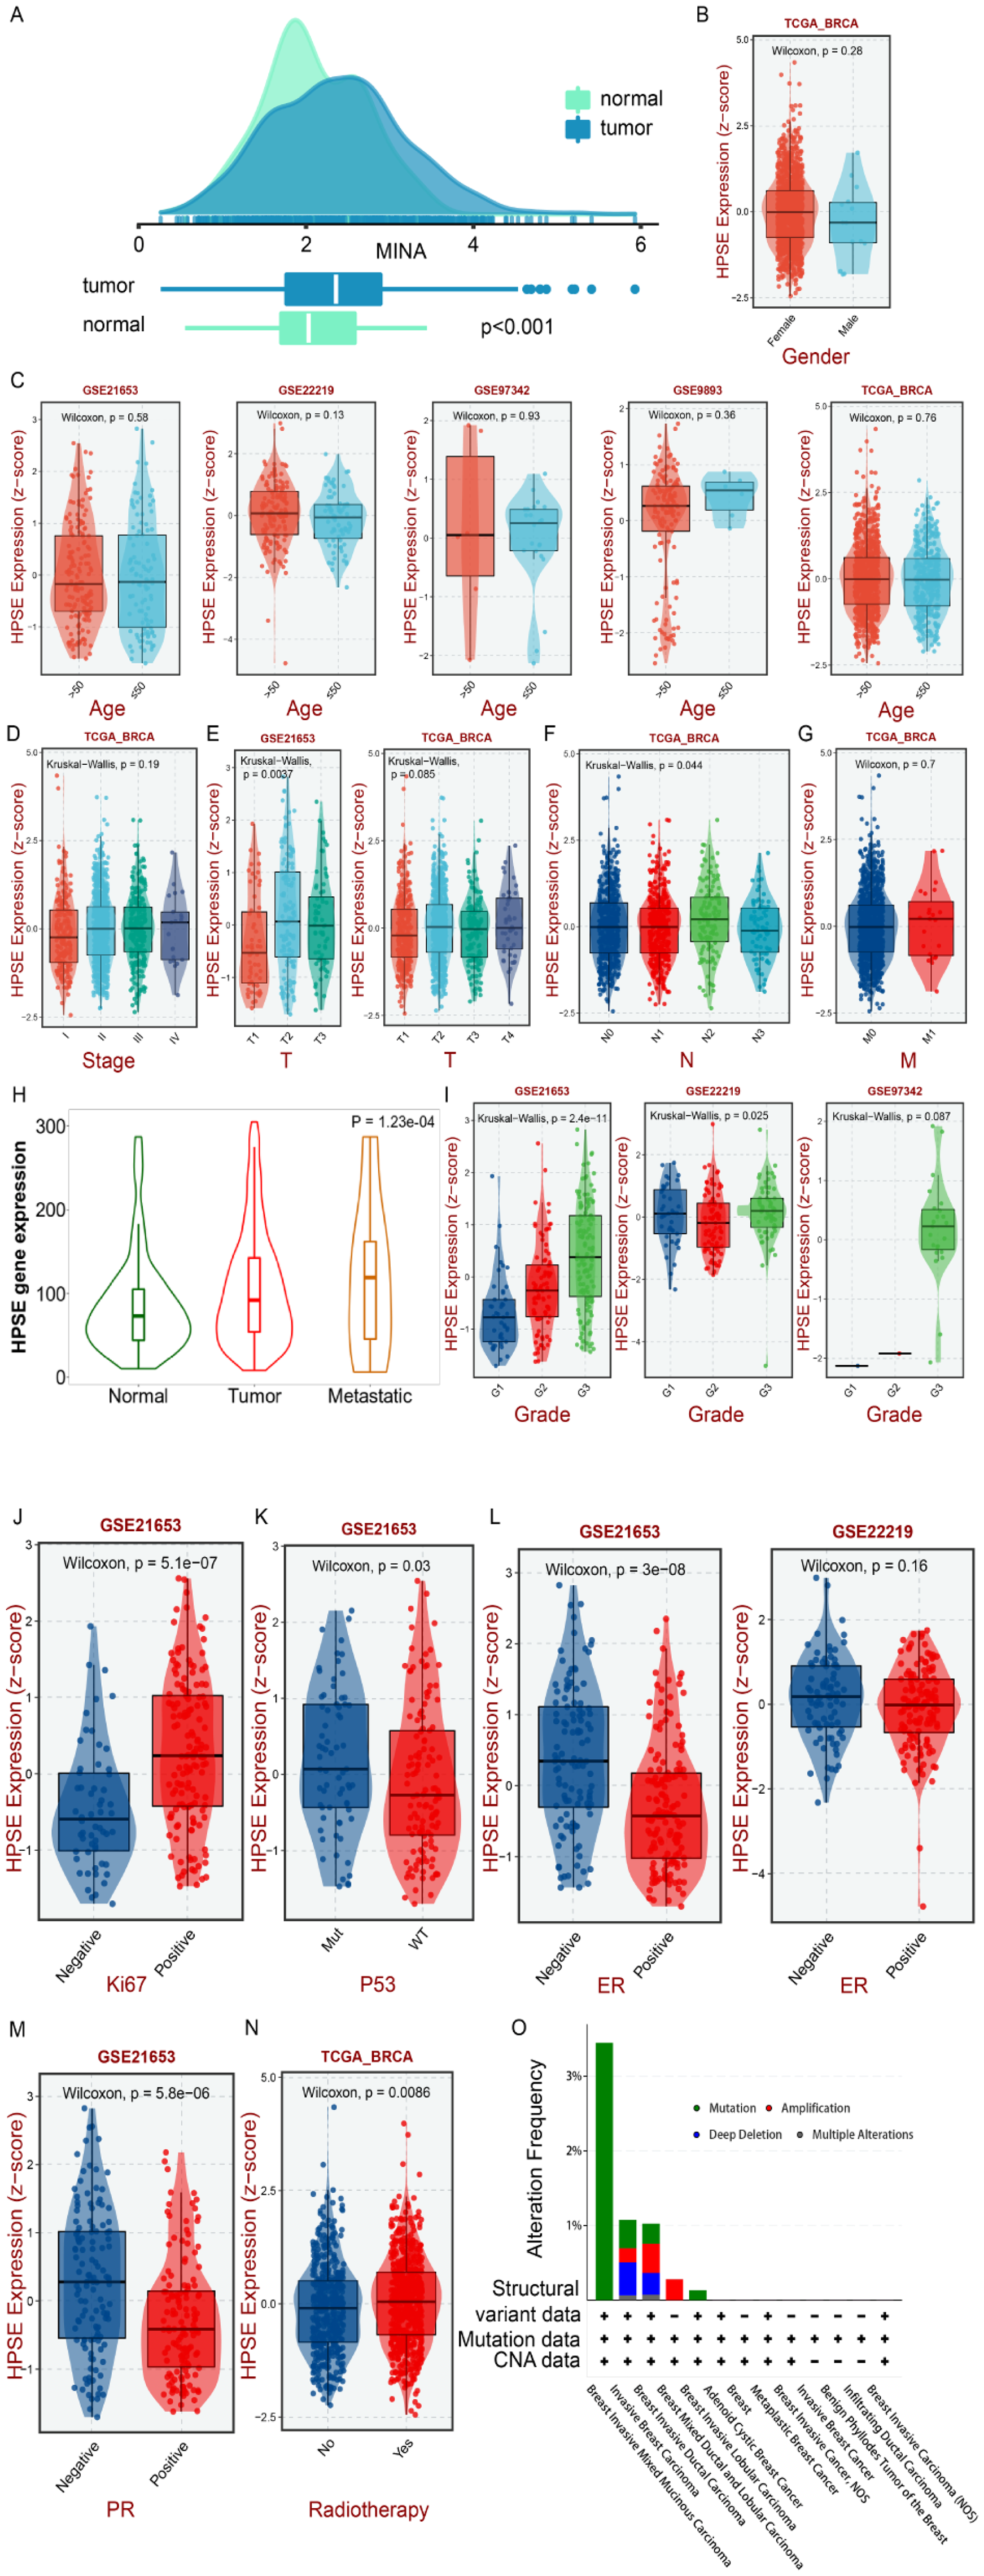
Expression level of HPSE in breast cancer. An expression level of HPSE in tissues. (B-I) Expression of HPSE in different gender, ages, stages, T, N, M, metastatic, and grade groups. (J-M) The expression level of HPSE in KI67, TP53, ER, and PR mutant groups. (N) The expression level of HPSE in patients with radiotherapy. (O) Alteration frequency plot of HPSE in breast cancer with different histological subtypes.
Next, we utilized the online database to analyze the relationship between HPSE gene expression levels and clinical characteristics on the BEST website (https://rookieutopia.com/app_direct/BEST/#PageHomeAnalysisModuleSelection), the analyzed included the TCGA database, GSE21653 database, GSE2219 database, GSE97342 database, and GSE9893 database. According to the results, the expression level of HPSE was unrelated to gender and age (Figure 1B, C). In the clinical stage, it tended to increase with the rise in clinical stage (Figure 1D). Additionally, our results indicated that the expression level of HPSE was associated to T stage, N stage, metastasis, and grade (Figure 1E, F, H, I). In the lymph node metastasis group, the expression level of the HPSE gene was significantly up-regulated. As the malignant degree increased, so did expression level of HPSE. At the same time, we also analyzed the expression level of HPSE in the KI67 expression group, p53 mutation group, ER mutation group, and PR mutation group. The expression level of HPSE was high in the KI67 high expression group, and the p53 mutation group (Figure 1J, K), and the expression level of HPSE was also higher in the ER-negative group and PR-negative group (Figure 1L, M). Our results also showed that the expression level of HPSE was higher in patients who underwent radiotherapy (Figure 1N), and the mutation frequency was higher in Breast Invasive Mixed Mucinous Carcinoma (Figure 1O).
Relationship Between HPSE and Prognosis of Patients with Breast Cancer
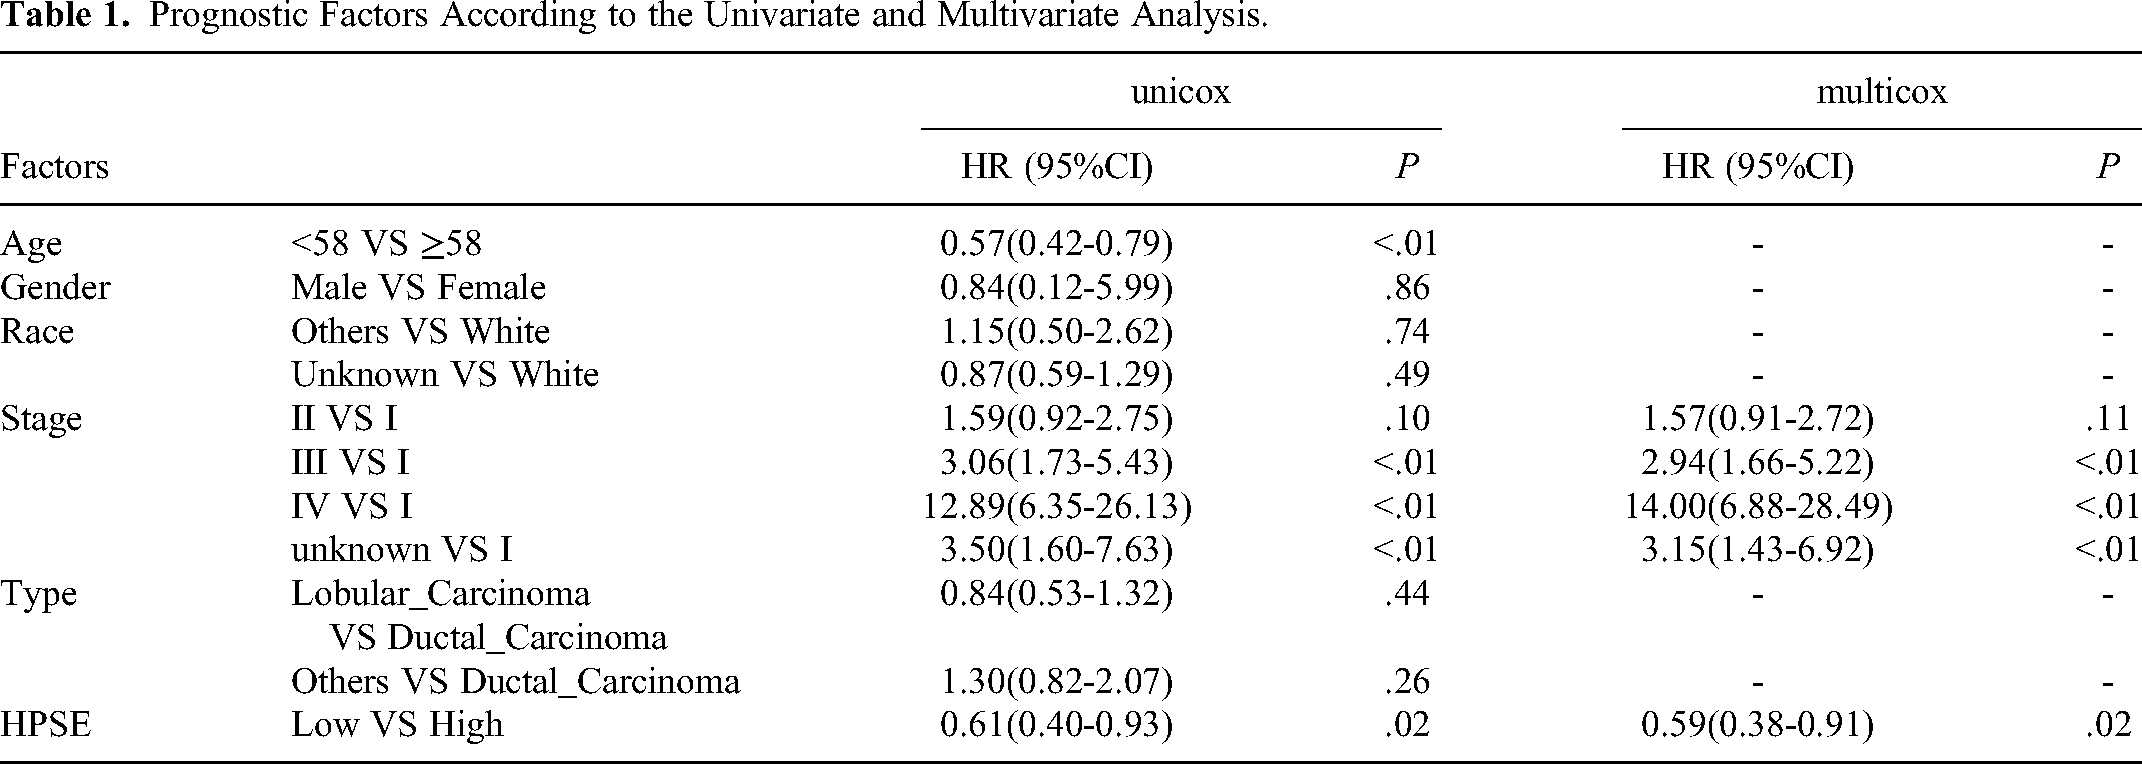
To evaluate the relationship between HPSE expression and breast cancer patients, an analysis of the TCGA database, containing 1090 breast cancer patients. First, we assessed the relationship between the expression of the HPSE gene and the prognosis of patients with breast cancer. We selected the cutoff value of HPSE, and Log-rank results showed that the patients with high expression of HPSE have a poor prognosis. We analyzed the relationship between HPSE and Disease-Specific Survival (DSS), Progression-Free Interval (PFI), and Disease-Free Interval (DFI) (Figure 2A, B, C, D). Our results indicated that patients with high expression of HPSE exhibited poor DSS, PFI, and DFI outcomes, This implies that the HPSE gene holds significant diagnostic value for the survival of patients with breast cancer. To further analyze the potential value of HPSE in the prognosis of patients with breast cancer, we investigated the relationship between different pathological features and prognosis. The results of the Kaplan-Meier method showed that clinical stage and age were associated to prognosis. Subsequently, we conducted a multivariate Cox proportional hazards regression analysis on age, clinical stage, and HPSE gene expression level. The results indicated that clinical stage and HPSE gene expression level could be utilized as independent prognostic factors in patients with breast cancer (Table 1). Subsequently, we built a nomogram model. When the HPSE gene expression was low, and the clinical stage was III, the patient score was 50.7. The assessed one-year survival rate was 98.1%, the 3-year survival rate was 90.4%, the 5-year survival rate was 82%, and the 10-year survival rate was 57.1% (Figure 2E). Then we divided the patients into high and low-risk groups according to the model and drew the Receiver Operating Characteristic (ROC) curve. The area under the ROC curve of the 10-year survival rate was 0.695 (Figure 2F). The results of the Decision Curve Analysis (DCA) also showed that the model had good clinical diagnostic value (Figure 2G).

Relationship between HPSE gene expression level and prognosis of breast cancer patients and its prediction model. (A) OS. (B) DFI. (C) DSS. (D) PFI. (E) A prognostic nomogram for breast cancer patients. (F) The receiver operating characteristic curves of the nomogram. (G) Decision curve analysis for the prognosis nomogram.
Prognostic Factors According to the Univariate and Multivariate Analysis.
Relationship Between HPSE and Immune Cells in the Tumor Microenvironment
Immune Infiltrating Cells are Associated with the HPSE Gene in Breast Cancer
Currently, immunotherapy primarily targets the level of immune cells in the body. We then employ the ssGSEA deconvolution algorithm to analyze the relationship between the HPSE gene and immune cell infiltration. The expression level of the HPSE gene was found to be highly correlated with immune cell infiltration. We found that high expression of HPSE was accompanied by increased expression of CD8 cells and T cells and a high level of B cells. Th1, Th2, and regulatory T cells (Tregs) were equally high and strongly correlated among T helper cells. Other tumor-infiltrating immune cells can also be identified in HPSE at different expression levels (Figure 3A, C). The immune gene scores in the HPSE high expression group are higher than those in the HPSE low expression group (Figure 3B, D).
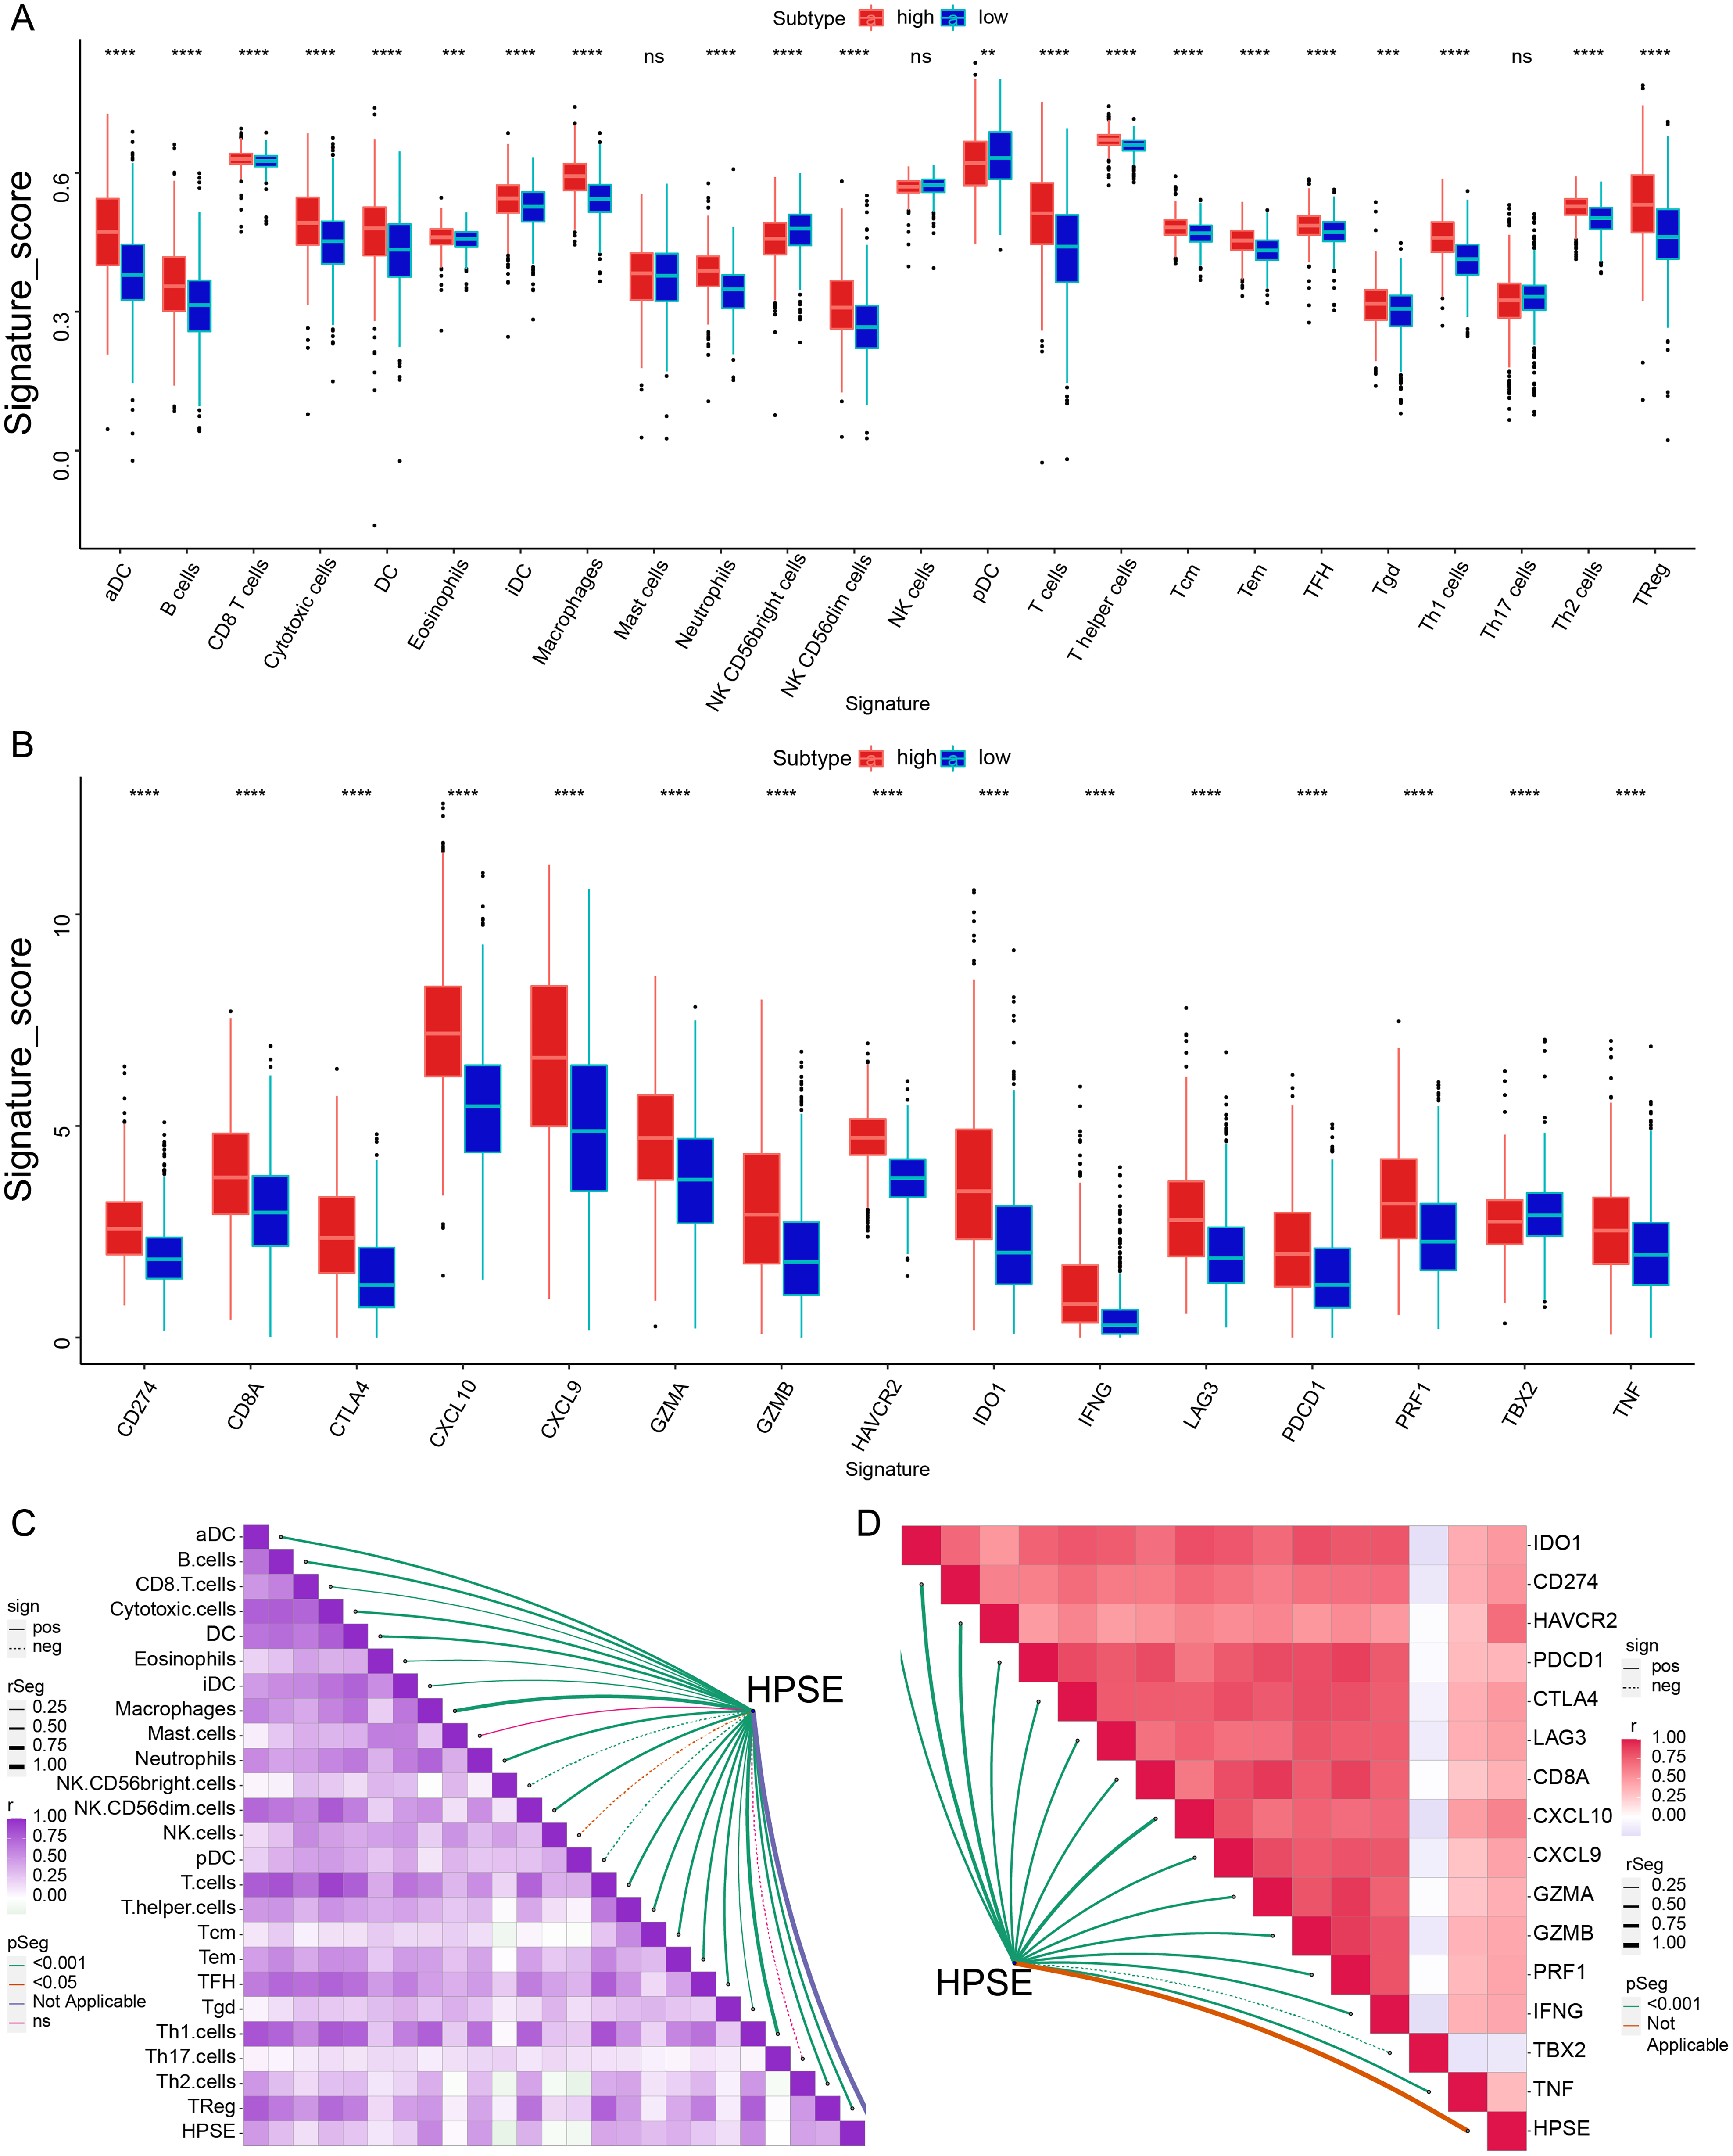
Relationship between HPSE gene expression level and immune infiltrating cells and genes. (A) Relationship between infiltrating immune cells and HPSE gene expression. (B) Relationship between immune genes and HPSE gene expression. (C) Correlation between HPSE gene expression and immune cell infiltration. (D) Correlation between HPSE gene expression and immune genes (darker colors indicate stronger correlation).
To confirm the relationship between HPSE and immune genes. We validated our data in the 4T1 mouse model of breast cancer, employing HPSE III and OGT2115 to establish (high and low HPSE expression groups). Through IHC staining, we observed a significant association between HPSE expression and an increase in immune checkpoint proteins CD274 (Figure 4A, B) and cytotoxic T lymphocyte-associated protein 4 (CTLA-4) (Figure 4A, C) (P < .05), which made tumor cells more prone to immune escape. In addition, HPSE expression is associated with an increased expression of the pro-inflammatory cytokine TNF-α (Figure 4C, D) produced by M1 macrophage polarization (P < .05), this stimulating thereby promotes tumor cell proliferation, invasion, metastasis, and angiogenesis. The high expression of immune checkpoint genes and immune checkpoint-relevant genes accompanies the high expression of HPSE. The immune-screening proteins and pro-inflammatory cytokines regulate immune cells to resist the killing by the immune system.

Relationship between HPSE gene expression, immune checkpoint protein and pro-inflammatory cytokine expression in breast cancer. (n = 7) (A) IHC staining of CD274, CTLA-4 and TNF-α. (200× and 400×) (B) AOD value of CD274. (C) AOD value of CTLA-4. (D)AOD value of TNF-α. Statistics were calculated on biological replicates with two-tailed unpaired t-tests, *P < .05, **P < .01, ***P < .001. Error bars show mean with SD.
Expression Levels of HPSE Gene Associated With the Anti-Cancer Immunity Cycle
We analyzed the relationship between the expression level of HPSE and signal pathways. The results revealed that among the 18 signal pathways examined, only Spliceosome and Systemic_lupus_erythematosus showed no significant difference between the high and low expression groups of HPSE. However, in the HPSE high expression group, the scores of 16 signaling pathways were higher compared to those in the HPSE low expression group. The correlation analysis revealed a strong correlation between HPSE expression and 16 signal pathways (Figure 5A, C). It shows that HPSE is related to many biological processes. Besides, as demonstrated in Part 3.1, our results highlighted the close relationship between HPSE immune infiltrating cells and immune genes, Consequently, we further investigated the correlation between the HPSE gene and the cancer-immunity cycle. The immune cycle comprises 7 processes: cancer antigen release, cancer antigen presentation, priming and activation, transfer of immune cells to the tumors, immune cells infiltrate tumors, T cells recognize cancer cells, and eradication of cancer cells. Our results demonstrated a positive correlation between HPSE expression levels and all seven steps of the immune cycle (Figure 5B, D).

Relationship between HPSE gene expression levels and immunotherapy signal pathways and immunotherapy cycle. (A) Relationship between HPSE gene expression and immunotherapy signal pathways. (B) Relationship between HPSE gene expression levels and immunotherapy cycle. (C) Correlation between HPSE gene expression levels and immunotherapy signal pathways. (D) Correlation between HPSE gene expression levels and immunotherapy cycle (correlations are stronger with darker colors).
Prediction of Immune Drugs by HPSE Gene
Given that many current treatments involve a combination of chemotherapy and immunotherapy, we further predicted drug sensitivity based on the expression level of HPSE using the CTRP (https://portals.broadinstitute.org/ctrp) and PRISM websites (https://depmap.org/portal/ PRISM). On the CTRP website, we identified 10 drugs associated with the HPSE gene, and their efficacy was as follows: dasatinib, triazolothiadiazine, clofarabine, leptomycin B, rigosertib, CR-1-31B, methotrexate, paclitaxel, SB-743921 (Figure 6A). The results indicated that all 10 drugs exhibited greater sensitivity in the presence of low HPSE expression. Additionally, the results on the PRISM website demonstrated that LY2606368 drugs could target the HPSE gene, and LY2606368 exhibited increased sensitivity in patients with low HPSE expression (Figure 6B).

Chemotherapy-related drugs sensitive to the HPSE gene. (A) Immune drugs targeting HPSE are accessible on the CTRP website. (B) Immune drugs targeting HPSE are available on the PRISM website.
Discussion
Most breast cancer cases are diagnosed at advanced stages or even metastatic stages, leading to a high mortality rate, there is an urgent need to develop specific biomarkers for the treatment of breast cancer patients. 27 Our previous study has demonstrated that HPSE is a novel biomarker for immune infiltration and prognosis in breast cancer. 13 Therefore, we further analyzed the prognosis value of HPSE and its role in the immune microenvironment of breast cancer. TNM classification, lymph node metastasis, histological type of primary tumor, tumor size, ER status, and tumor biomarkers are recognized as the main factors affecting breast cancer prognosis. According to this study, we further explored the prognostic value of HPSE in patients with breast cancer through the TCGA database. Our results showed that HPSE was associated with OS, PFI, DSS, and DFI, and patients with high expression of HPSE had a poor prognosis. Our study found that the risk of death in patients with high expression of HPSE was 1.69 times higher than in those with low expression. The study by Tang demonstrated high expression of HPSE in the serum of breast cancer patients, and the expression level of HPSE was utilized as a biomarker to assess the effect and prognosis of the operation. 28 A phase III randomized controlled trial also demonstrated that HPSE was associated with a poor prognosis in ER+ breast tumors, while predicting chemotherapy resistance. 29 In addition, numerous studies have indicated that HPSE is associated with the poor prognosis of other tumors. For example, in gastric cancer, studies have shown that the prognosis of patients with high expression of HPSE is significantly lower than that of patients with low expression of HPSE. The high expression of HPSE in gastric cancer is a powerful predictor of low survival. 30 In gliomas, tumor development in vivo is positively correlated with HPSE levels, and there is a correlation between high expression of HPSE and shorter survival in patients with highly malignant gliomas. 31 In pancreatic ductal carcinoma, studies have shown a negative correlation between the level of HPSE mRNA in PDAC specimens and postoperative prognostic factors. Patients with high expression of HPSE mRNA have a poor prognosis. 32 It has also been shown that HSPE is associated with relapse in newly diagnosed patients with myeloma receiving high-dose chemotherapy through promoting cancer stemness. 33 All of these findings demonstrate that HPSE is closely related to the prognosis of tumor patients. In our Nomogram analysis model, HPSE can be used as a tumor biomarker for the prognosis of breast cancer patients, and we can predict this by analyzing the expression levels of HPSE and the clinical stage. Studies have shown that CTLA-4 as a prognostic marker of breast cancer, Ki-67 and N stage are predictors of poor survival. And ROC curve evaluation shows that it has a good predictive value for disease-free survival of breast cancer patients (AUC = 0.815). 34 Platelet-lymphocyte ratio (PLR) is a systemic inflammatory markers derived from peripheral blood in patients with invasive breast cancer cell showed good accuracy in predicting DSS, which the proposed nomogram with a concordance index of 0.82. 35 Our ROC curve results showed that the 1-year survival rate had an AUC value of 0.747, and the 10-year survival rate was 0.695, which followed that our model, CTLA-4 model and PLR model all have good predictive effect. The results of the clinical decision curve also indicated that our model provided better clinical benefits. By scoring the patients, we can predict the prognosis and survival rate, enabling clinicians to tailor drug use for different patients and identify the benefits of specific treatment strategies.
Our results also showed that the expression level of HPSE was related to metastasis. We all know that the outcome of metastasis is a poor prognosis. In our study, the expression level of the HPSE gene was high in metastatic breast cancer. The possible mechanism was that HPSE cleaves heparan sulfate proteoglycan (HSPG) into endoglycosidase of heparan sulfate side chain and core proteoglycan and then participates in the degradation and remodeling of extracellular matrix (ECM).36,37 It becomes active under acidic conditions, promoting cell migration associated with metastasis, wound healing, and inflammation during tumor invasion. In the presence of tissue factors and activating factor VII, it can play the role of a coagulant by increasing the production of activating factor X. HPSE in platelets has been shown to enhance their adhesive capacity, promoting thrombogenicity. 38 Studies also showed that HPSE could induce FAK and ICAM-1-dependent cell adhesion in breast cancer, promoting intravascular cell aggregation. 39 When HPSE is knocked down, or its activity is inhibited by heparanase inhibitor JG6, it can prevent the formation of cell clusters and inhibit breast cancer metastasis. 39 In the breast cancer treatment study, the sequential release of NLC/H (D + F + S) NPs nanoparticles driven by HPSE can regulate the tumor microenvironment, reduce TAF activation and the secretion of TGF-β, and block tumor metastasis. 40 A new synthesized dicarboxylated oxy-heparins inhibits spontaneous metastasis in an orthotopic breast cancer model after primary tumor resection. 41 All of these findings further explain that HPSE can regulate breast cancer metastasis and affect the prognosis of patients. But there was a study showed that even though HPSE regulated tumor angiogenesis, the metastasis of mammary tumors in MMTV-PyMT animals were HPSE-independent, 42 so more animal models are needed for validation.
Our study showed that the mutation frequency was higher in Breast Invasive Mixed Mucinous Carcinoma. The expression level of HPSE is related to the expression levels of ER and PR, which means that HPSE may be used as a therapeutic target for triple-negative breast cancer (TNBC) patients, consistent with the study of Yang. 43 HPSE may regulate the metastasis of TNBC through the HIF-1a/VEGF-a/p-AKT axis and then regulate the tumor progression. A study also showed that nanoparticle-HPA-aptamer bioconjugates provided insight into treating TNBC, 44 significantly enhancing anti-invasion and anti-angiogenesis activity. In addition, our results showed that HPSE is related to the mutation of the TP53 gene. This may be due to the combination of p53 with the promoter of the HPSE gene. 45 Other studies have shown that p53 mutation with loss of function in tumor cells is associated with the overexpression of HPSE. 46 Our results also showed that the expression level of HPSE was higher in patients who underwent radiotherapy. This may be related to the significant increase in radiation resistance of TNBC cells after HPSE intervention. 47 These pieces of evidence showed that HPSE is a valuable therapeutic target in breast cancer.
Breast cancer treatments include surgery, radiotherapy, chemotherapy, and immunotherapy. Cancer immunotherapy relies on a self-immune response to kill cancer cells and tumor tissues by activating the immune system. Many cells of the immune system have been reported to express heparanase, including T cells, B cells, neutrophils, macrophages, platelets, dendritic cells, and endothelial cells. Moreover, there is a very complex interaction between the immune system. It is important to analyze how HPSE affects immune cells and thus affects the prognosis of breast cancer. In our study, CD8 T cells are highly expressed and correlated with HPSE in breast cancer patients with high HPSE expression. CD8 T cells, also known as cytotoxic T cells (CTLs), are recognized as the most effective anti-tumor immune effector cells. 48 On the surface of T cells, CD8 and MHC-I can specifically recognize tumor-associated antigens and produce perforin and other cytotoxins after binding to tumor cells, killing cancer cells but not affecting normal cells. 49 However, this immune effect is blocked by regulatory T cells (Tregs) and M2 macrophages inhibiting T cell activation.13,50 In addition, the high expression of HPSE in helper T cells leads to the same high expression of Th1, Th2, and regulatory T cells (Treg). Th1 secretes IL2 and INF- γ, which can activate and promote the proliferation of CD8, T cells, and NK cells. 51 Th2 inflammatory response can lead to immune escape and promote breast cancer development. 52 The “Th1/Th2” balance pattern and ratio often change in cancer and other diseases. For example, the number of Th2 cells in a cancer patient's blood and tumor tissues is often greater than that of Th1 cells. Therefore, the Th1/Th2 ratio is also often used to predict the survival rate of metastasis and is an important prognostic factor of immune response in the tumor microenvironment. According to our study, the number of Th2 cells was also higher than that of Th1 cells in breast cancer patients with high expression of HPSE. Tregs cells are an immunosuppressive subset of CD4+ T cells Studies have shown that Tregs cells produce immunosuppressive cytokines and express CTLA-4, which regulates dendritic cell (DC) maturation and inhibits T cell activation. High levels of Tregs cell infiltration in breast cancer biopsy samples are associated with reduced overall survival. 53 All of this further confirms that HPSE could accurately predict patient prognosis for breast cancer.
Then we explored the correlation between HPSE and immune checkpoint through in vivo studies. There was a positive correlation between HPSE gene expression levels and immune checkpoint genes as well as immune checkpoint-relevant genes. The physiological function of immune checkpoints is to prevent the attack of autoimmune antigens during immune processes, including PD-1, CD274, or CTLA-4, by reducing immune activation through intracellular signaling mechanisms, This induces T cell degradation and depletion to negatively regulate the recipient immune cells. Tumor cells evade anti-tumor immunity by inactivating cytotoxic T lymphocytes through these pathways. HPSE expression in breast cancer is associated with increased expression of CTLA-4 and CD274 immune checkpoint proteins in our in vivo study. CTLA-4 is expressed in Tregs and up-regulated in activated T cells (ATCs),which increased expression was associated with increased infiltration levels of Tregs cells at high HPSE expression. CTLA-4 is similar to the T cell costimulatory protein CD28 and competes with binding to CD80 (B7), thereby transmitting inhibitory signals negatively and reducing activated CD8 + T cells. This leads to an inability to bind to the corresponding tumor antigen, resulting in immune escape. 54 CD274 is expressed in the tumor cell membrane, antigen-presenting cells (APC), T cells, B cells, Macrophages, etc Based on the previous results of this study, high HPSE expression was associated with increased infiltration of T cells, B cells and macrophages, thus leading to increased CD274 protein expression. After binding with PD-1 in T lymphocytes, CD274 activates downstream inhibitory signals, thereby reducing the activation of CD8 + T cells and inhibiting the immune recognition function. Among these, pro-inflammatory cytokines play a driving role in this link. Our in vivo experiments show that HPSE expression is associated with an increased expression of the pro-inflammatory cytokine TNF-α produced by increasing M1 macrophage polarization, 55 this stimulating thereby promotes tumor cell proliferation, invasion, metastasis, and angiogenesis. Consistent with the study by Lilach, HPSE modulates macrophage secretion of cytokines such as TNF-α, IL-1β, IL-10, and IL-6. 56 The increase in pro-inflammatory cytokines in the tumor microenvironment leads to immune regulation of tumor cells, up-regulation of CD274 expression on the cell membrane, and activation of inhibitory signals, allowing tumors to bypass the immune system and eventually progress and metastasize. At the same time, the pro-inflammatory microenvironment attracts Tregs and helps maintain T cell degeneration. 54 Therefore, the expression level of HPSE can indirectly reflect the level of immune infiltrating cells and immune genes. HPSE can be used as a biomarker of immune infiltration and a prognostic marker of immunotherapy.
We also analyzed the relationship between HPSE and the cancer-immunity cycle, and our results showed that HPSE was highly correlated with seven immune steps. In the cancer-immunity cycle, high expression of HPSE reached 7 immune steps, suggesting that HPSE is closely related to the immune cycle process and participates in the cancer-immunity cycle. According to the mechanism of tumor immune circulation mentioned above, the body can effectively kill tumor cells. However, tumor cells can escape the encirclement and suppression of the immune system through changes of tumor cells themselves or alterations in the tumor microenvironment.
Tumors can express molecules on their surfaces that bind to T cells and inhibit their killing abilities, such as PD1 and CTLA4. 57 Additionally, tumors can secrete cytokines and proteins that inhibit T cells from attacking and killing cancer cells, such as TGF- β, IL-10, and IDO, leading to the loss of T cell activity. Our current immunotherapy includes T cell transplantation, the production of cytokines, regulatory proteins like IL-2, IL-7, and IL-15 that can multiply and strengthen T cells. 58 The other approach involves introducing agonist antibodies, such as OX-40, KANG, anti-GITR, and anti-41BB, as well as neutralization inhibitors such as anti-IL-10, anti-TGF-β, anti-PD1, anti-CTLA4, etc In this study, the expression of HPSE was up-regulated in tumors, and it was highly correlated with the cancer-immunity cycle and immune cell level. Our results showed that patients with high expression of HPSE are suitable for immunotherapy, and we can also evaluate the status of immunotherapy based on the level of HPSE expression. Recently, the FDA approved immune checkpoint inhibitors in combination with chemotherapy for the treatment of advanced TNBC. 59 Breast cancer has long been considered to be an immunologically “cold” tumor, but high expression of HPSE may indicate elevated levels of T cell infiltration in breast cancer. Therefore, for breast cancer patients with high HPSE expression, PD-L1 targeting antibodies such as pembrolizumab combined with chemotherapy may bring better clinical benefits. Additionally, most of the therapy was combined therapy, so we further predicted the drug sensitivity according to the expression level of HPSE through the website. Among them, 11 drugs included in dasatinib should be noted. The existing clinical studies of HPSE mainly focus on the expression of HPSE protein in serum by enzyme-linked immunosorbent assay and the expression of HPSE protein in paraffin-embedded tumor tissues by immunohistochemistry.28,60 The model in our study can be applied to clinical practice. Firstly, the serum HPSE can be detected in the blood of breast cancer patients to guide the treatment plan, and at the same time, the HPSE protein can be detected in the postoperative pathological tissue of breast cancer to predict the prognosis.
Conclusion
Our results show that HPSE can effectively predict the survival of patients with breast cancer, and it can also evaluate the immune status of patients effectively. The use of HPSE as a tumor biomarker is reasonable and has the potential to predict clinical outcomes. In other words, HPSE is a valuable biomarker for the treatment and prognosis of patients with breast cancer.
Highlights
Heparanase regulates various biological processes related to tumor progression.
Based on the heparanase construct prognosis model of breast cancer patient.
In breast cancer, heparanase exhibits a positive correlation with immune checkpoint proteins CD274 and CTLA-4 as well as the pro-inflammatory cytokine TNF-α, in vivo study.
High expression of heparanase can effectively enhance the response to immunotherapy.
Footnotes
Acknowledgments
Not applicable.
Author Contributions
W. J.K. designed and wrote the manuscript, G.L.Z., Y.W., J.H.Z. collected and analyzed data, J.H.Z., T.J.D., D.C., Y.C.P., R.X.Y., X.H.Y. performed article selection, and manuscript review and revision, J.H.Z., T.J.D., D.C., Y.C.P., R.X.Y., X.H.Y participated in the interpretation of the results, W.J.K., G.L.Z., X.M.W conceived of the study, assisted with analysis, and revised manuscript. W.J.K., G.L.Z., X.M.W is the guarantor of this work and, as such, takes responsibility for the integrity of the data and the accuracy of the data analysis.
Availability of Data and Materials
All data generated or analyzed during this study are included in this published article.
Declaration of Conflicting Interests
The authors declared no potential conflicts of interest with respect to the research, authorship, and/or publication of this article.
Funding
This work was supported by the National Natural Science Foundation of China (82074182, 82174454, 82274599).
Ethics Approval and Consent to Participate
All in vivo experiments were approved by the Animal Ethics Committee of Beijing Hospital of Traditional Chinese Medicine. (approval number: 2019100201).
Patient Consent for Publication
Not applicable.