
Abstract
Background
Gastric intestinal metaplasia(GIM) is an independent risk factor for GC, however, its pathogenesis is still unclear. Ferroptosis is a new type of programmed cell death, which may be involved in the process of GIM. The purpose of this study was to analyze the expression of ferroptosis-related genes (FRGs) in GIM tissues and to explore the relationship between ferroptosis and GIM.
Method
The results of GIM tissue full transcriptome sequencing were downloaded from Gene Expression Omnibus(GEO) database. R software (V4.2.0) and R packages were used for screening and enrichment analysis of differentially expressed genes(DEGs). The key genes were screened by least absolute shrinkage and selection operator(LASSO) and support vector machine-recursive feature elimination(SVM-RFE) algorithm. Receiver operating characteristic(ROC) curve was used to evaluate the diagnostic efficacy of key genes in GIM. Clinical samples were used to further validate hub genes.
Results
A total of 12 differentially expressed ferroptosis-related genes (DEFRGs) were identified. Using two machine learning algorithms, GOT1, ALDH3A2, ACSF2 and SESN2 were identified as key genes. The area under ROC curve (AUC) of GOT1, ALDH3A2, ACSF2 and SESN2 in the training set were 0.906, 0.955, 0.899 and 0.962 respectively, and the AUC in the verification set were 0.776, 0.676, 0.773 and 0.880, respectively. Clinical samples verified the differential expression of GOT1, ACSF2, and SESN2 in GIM.
Conclusion
We found that there was a significant correlation between ferroptosis and GIM. GOT1, ACSF2 and SESN2 can be used as diagnostic markers to effectively identify GIM.
Introduction
Gastric cancer (GC) is still a major health problem in many countries around the world. In 2020, the incidence of GC in all kinds of cancers ranked fifth in the world, and it is the fourth leading cause of cancer-related death. 1 Intestinal type GC as the most common type of GC is the final stage of Correa 2 cascade reaction(normal gastric mucosa →non-atrophic gastritis→atrophic gastritis→intestinal metaplasia (IM) →dysplasia→gastric cancer). Gastric intestinal metaplasia(GIM) is generally considered to be the first irreversible mucosal stage of progressive progression to cancer. A large number of studies have shown that GIM is an independent risk factor for GC,3,4 and the annual incidence of GC in patients with intestinal metaplasia is 0.25%. 5 Although it has been determined that it is associated with an increased risk of GC, the management of GIM is a difficult problem for many gastroenterologists. There is no specific treatment for gastrointestinal metaplasia. 6 Regular monitoring of high-risk patients and prevention of IM is one of the main management methods recommended in the guidelines. 7 In addition, the current “gold standard” of GIM diagnosis is still histological analysis of gastric biopsies obtained by upper gastrointestinal endoscopy, which is invasive, expensive and cannot be used for extensive screening. Therefore, there is an urgent need for highly sensitive and efficient biomarkers to promote the early detection of GIM and to study the pathogenesis and treatment of GIM.
Ferroptosis is a non-apoptotic modality of cell death, which is defined as an iron-dependent regulated necrosis that is caused by massive lipid peroxidation-mediated membrane damage. 8 Previous studies related to ferroptosis mainly focused on various malignant tumors. 9 Recently, more and more studies have shown that ferroptosis also plays an important role in non-tumor diseases such as inflammatory diseases 10 and degenerative diseases. 11 In general, the main ferroptosis-inducing event is lipid peroxidation. 12 Interestingly, the inflammatory environment of the gastrointestinal tract is always accompanied by the production of lipid peroxidation.13,14 However, the role of ferroptosis in GIM has not been reported.
In this study, we first identified the differentially expressed ferroptosis related genes (DEFRGs) between GIM and control samples from Gene Expression Omnibus(GEO, http: //www.ncbi.nlm.nih.gov/geo) database and FerrDb database. Then, we use two machine learning algorithms to identify hub genes, and we draw receiver operating curve (ROC) curves for hub genes. Finally, three hub genes, GOT1, ACSF2 and SESN2, were screened and verified histologically.
Materials and Methods
Data Collection
The reporting of this study conforms to TRIPOD guidelines 15 (https://www.equator-network.org/reporting-guidelines/tripod-statement/). Sample microarray datasets of GIM patients and controls were downloaded from GEO database. The search strategy is: (“gastric intestinal metaplasia” OR “spasmolytic polypeptide-expressing metaplasia”) AND “Homo sapiens”. Three datasets were selected for analysis (GSE60427, GSE60662, GSE78523). Among them, the GSE60427 and GSE60662 datasets were merged as the training set, and the “SVA" 16 package in R software is used to eliminate the batch effect from two datasets. The dataset GSE78523 was selected for external validation. Ferroptosis-related genes(FRGs) were obtained from FerrDb (http://www.zhounan.org/ferrdb) database.
Differential Expression Analysis
The “limma” package was used to seek differentially expressed genes (DEGs) between IM and control samples. |Log2FC|>0.585 and FDR < 0.05 as the cut−off criterion were applied to screen DEGs.
WGCNA 17 is commonly used to identify and screen for disease markers in organisms. We used the “WGCNA” package to construct a gene co-expression network. Firstly, the soft threshold (β) of network construction was selected, and secondly, the co-expression network was constructed using the automatic network construction function. Then, Pearson correlation analysis was used to filter out the closest modules to GIM. Finally, the appropriate Gene Significance (GS) and module membership (MM) was used to select the genes most closely related to GIM.
Finally, the Venn diagram was used to obtain the intersection of DEGs, module genes and FRGs. These genes were considered to be GIM related differentially expressed ferroptosis-related genes (DEFRGs) and were visualized in the heat map by “pheatmap” packages.
Enrichment Analysis
We use the “clusterProfiler” package in R to perform Gene Ontology (GO) and Kyoto Encyclopedia of Genes and Genomes (KEGG) enrichment analysis to reveal the function and potential pathway of DEFRGs. FDR < 0.05 was considered to be statistically significant, and GO and KEGG results were visualized.
Key Gene Screening and Diagnostic Efficacy Evaluation
Two machine learning algorithms, Least Absolute Shrinkage and Selection Operator(LASSO) 18 and Support Vector Machine-Recursive Feature Elimination(SVM-RFE), 19 were used to filter out hub genes in this study. LASSO and SVM-RFE were executed using the “glmnet” and “e1071” packages, respectively. Finally, the genes identified by all two machine algorithms learning were selected as potential hub genes for further analysis. In addition, The GSE78523 dataset was used as the validation dataset.
Collection of Tissue Specimens
Gastric tissue samples of 15 GIM and 15 healthy samples were collected from patients in the second affiliated Hospital of Anhui University of traditional Chinese Medicine. All patients understand the nature of the study. The Ethics Committee of the second affiliated Hospital of Anhui University of traditional Chinese Medicine reviewed and approved this study(2022zj20). All patients signed the informed consent form before participating in the study.
Real-Time Quantitative Reverse Transcription PCR
The RNAiso Plus (Takara) kit was used to extract total RNA from GIM tissue samples and reverse transcribed using the PrimeScript™ RT kit (Takara). The β-actin gene was used as an internal control using the 2−ΔΔCt method. Primer sequences are shown in Table 1.
PCR Primer Sequences

Immunohistochemical Staining
Fresh stomach tissue samples were fixed overnight in 4% neutral formaldehyde solution and embedded in paraffin, then cut into 5 μm thick slices. The slices were deparaffin and treated with citrate buffer (pH = 6.0) to recover the antigen. The endogenous peroxidase was blocked with 3%H2O2, and the antigen was blocked with 5% bovine serum albumin (BSA), then incubated with GOT1 antibody (bsm-60599R; Bioss),ACSF2 antibody (PA5-55156) and SESN2 antibody (bs-8326R; Bioss) in an incubator at 37°C for 60 min. After washing with phosphate-buffered saline (PBS), the second antibody was added and incubated in an incubator at 37°C for 30 min. It was stained by horseradish peroxidase-DAB kit and then re-stained with hematoxylin. Finally, the stained sections were observed by OLYMPUS microscope.1
Results
Data Collection and Preprocessing
The datasets of GSE60427 and GSE60662 were normalized and the batch differences were removed (Figure 1A). From the UMAP diagram, we could observe that the samples of the two data sets were clustered together before removing the batch effect, and after removing the batch effect, the samples between the two data sets were clustered and intertwined with each other, suggesting that the batch effect was better removed (Figure 1B-C). A total of 378 FRGs were obtained from FerrDb database.

The two datasets GSE60662 and GSE60427 were combined and normalized. (A) Merging of datasets. (B) Before normalization. (C) After normalization.
DEFRGs Screening
A total of 1946 DEGs were identified by “limma” package, including 828 up-regulated genes and 1118 down-regulated genes (Figure 2A).
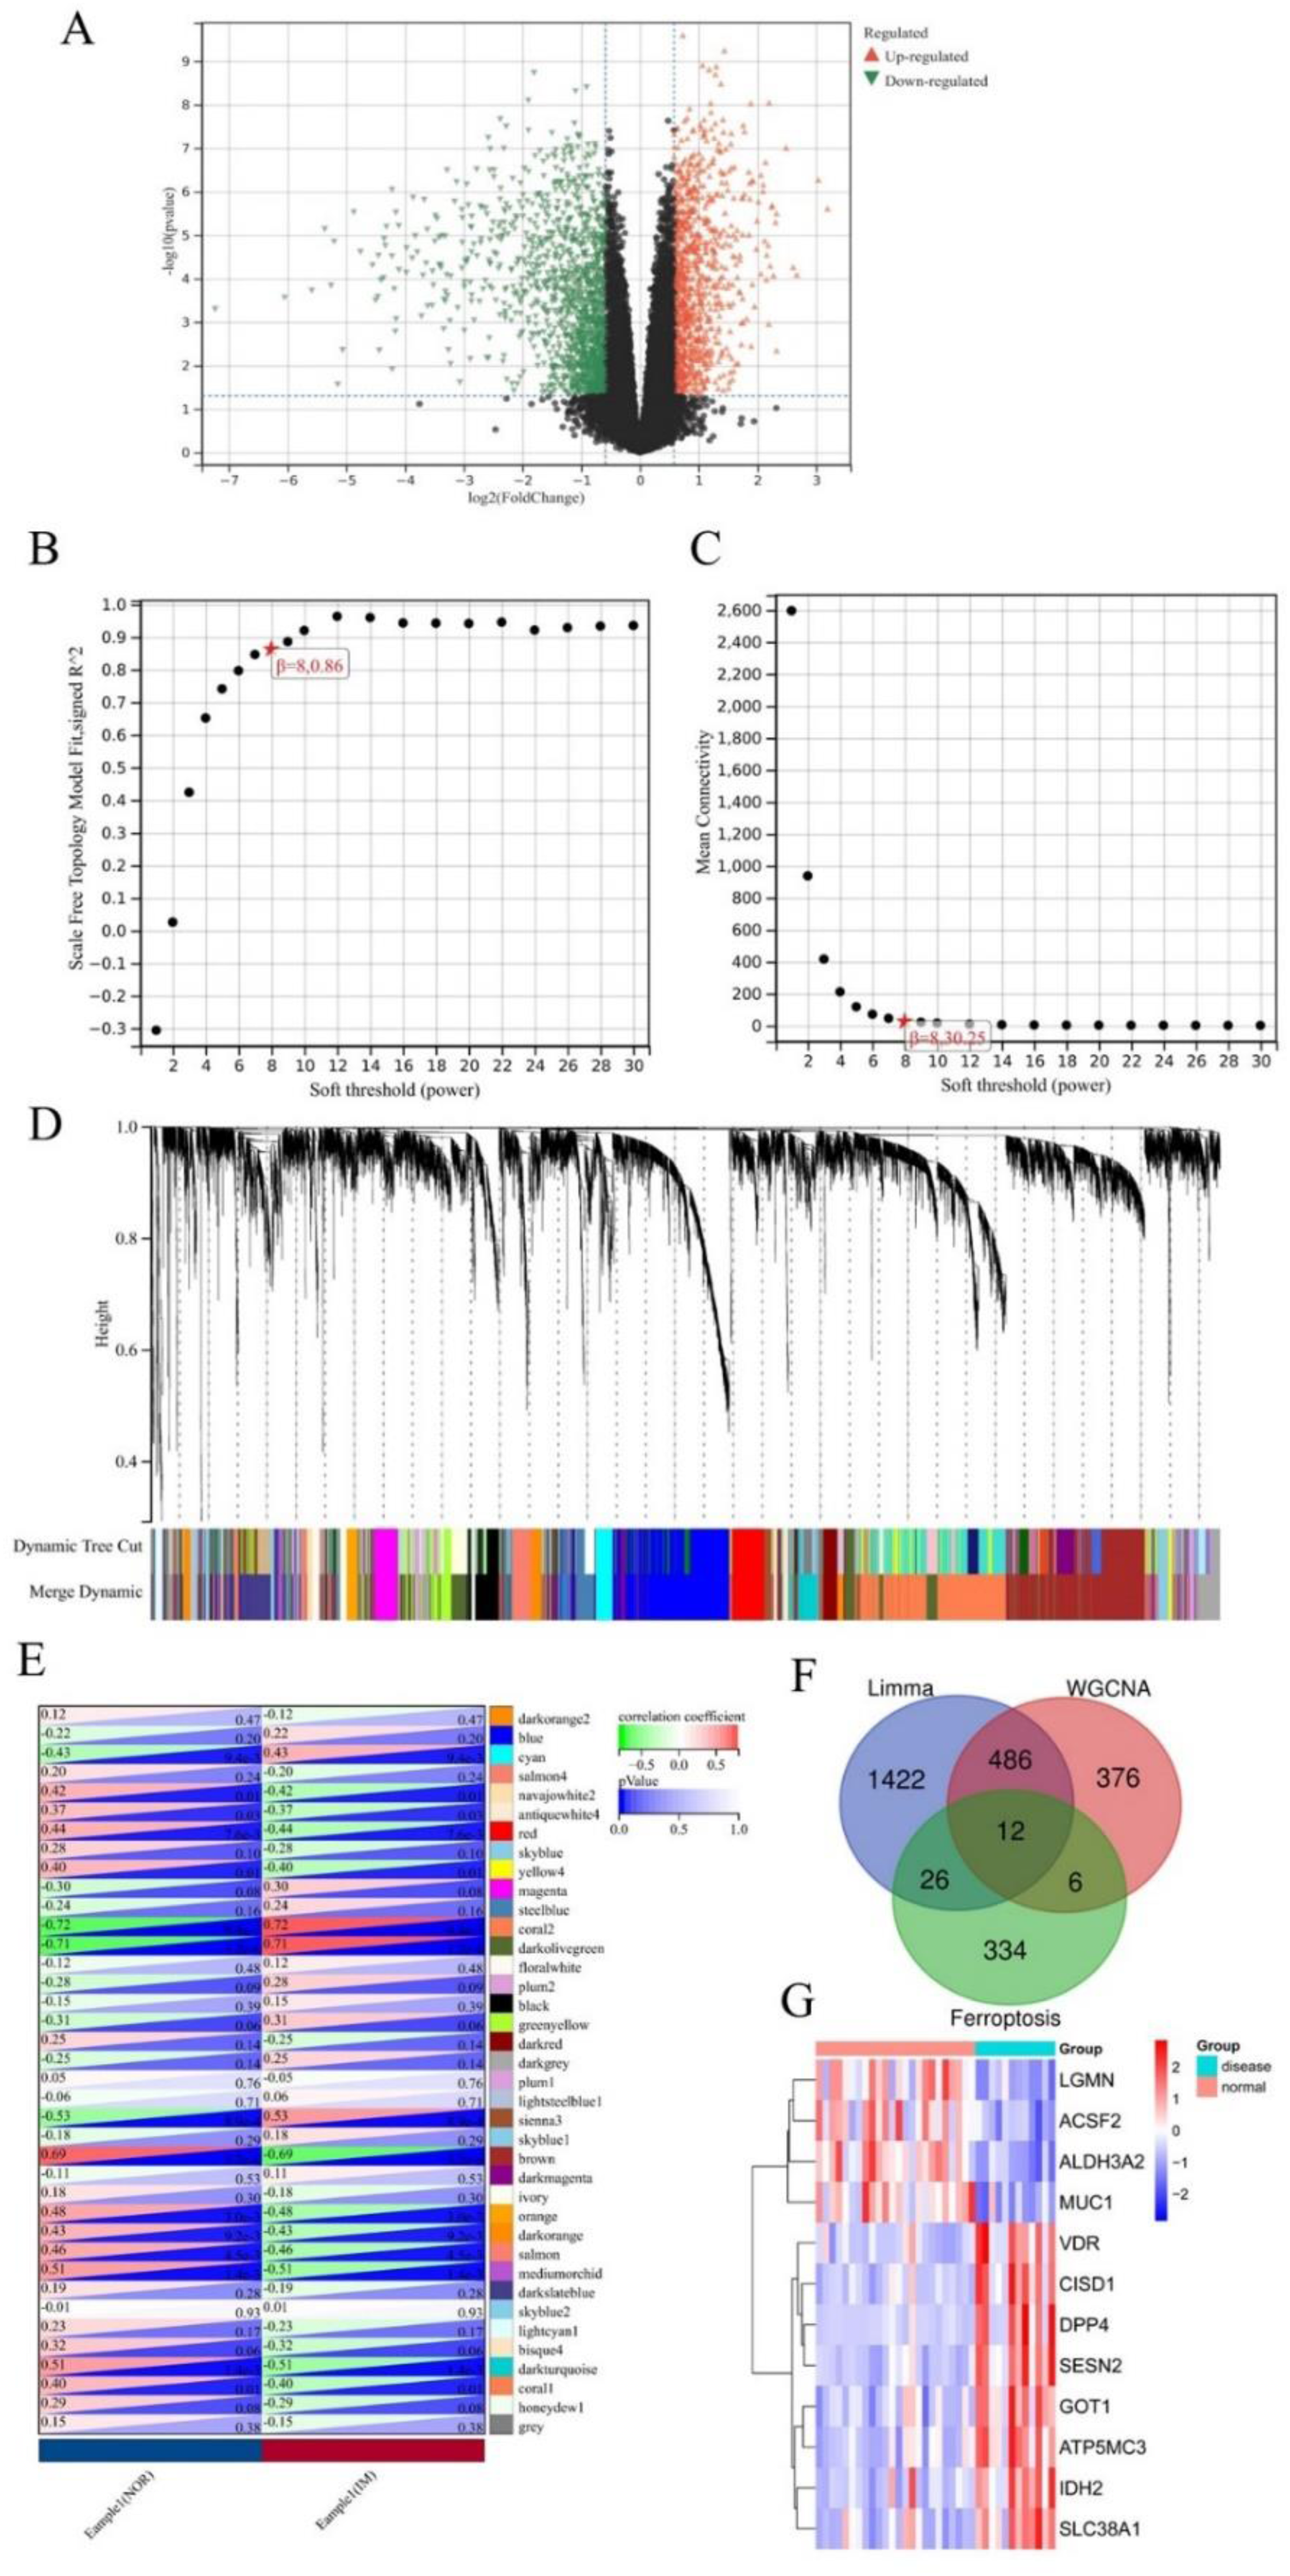
DEFRGs screening. (A) Volcano plot for DEGs between controls and GIM tissues. (B) Analysis of the scale-free fit index for various soft threshold powers. (C) Analysis of the mean connectivity for various soft threshold powers.(D) Identification of co-expression gene modules. (E) Module-trait associations were evaluated by correlations between module eigengenes and sample traits. (F) Venn diagram of intersecting genes between DEGs, FRGs and module genes. (G) The heat map of DEFRGs.
WGCNA was used to discover biologically necessary gene modules and to better understand genes related to clinical features. In this study, β=8 (scale-free R2 = 0.86) (Figure 2B-C)was selected as the soft threshold for establishing scale-free networks. Next, we transformed the expression matrix into an adjacency matrix, and then into a topological matrix. Then we used the average linkage hierarchical clustering method to cluster these genes and marked different modules with different colors (Figure 2D). Then, we analyzed the correlation between modules and sample phenotypes (Figure 2E), and found that coral2 (cor = 0.72,P = 9.4e-7), darkolivegreen (cor = 0.71,P = 1.2e-6) and brown (cor = 0.69,P = 3.2e-6) modules were the most closely related to GIM. Subsequently, the follow-up analysis was carried out according to GS > 0.5 and MM > 0.8. 880 GIM-related genes in these modules were reserved for further analysis.
Finally, 12 DEFRGs(Figure 2F) were selected from Venn diagram and shown by heat map(Figure 2G).
Functional Enrichment Analysis
GO enrichment analysis(Figure 3A-C) showed that DEFRGs was mainly related to small molecule metabolic process, carboxylic acid binding, organic acid binding, 2-oxoglutarate metabolic process, vitamin D metabolic process, positive regulation of transcription from RNA polymerase II promoter in response to stress, organic hydroxy compound metabolic process, carboxylic acid metabolic process, fat-soluble vitamin metabolic process, regulation of cell adhesion mediated by integrin. KEGG analysis(Figure 3D) showed that DEFRGs mainly concentrated on 2-Oxocarboxylic acid metabolism, arginine and proline metabolism, biosynthesis of amino acids, phenylalanine, tyrosine and tryptophan biosynthesis, carbon metabolism and other pathways.

The functional analysis of DEFRGs. (A) GO biological process. (B)GO cellular component. (C)GO molecular function. (D) KEGG enrichment analysis.
Identification and Verification of hub Genes
In order to identify reliable diagnostic biomarkers, we used two machine learning algorithms (LASSO, SVM-RFE) to identify hub genes from 12 DEFRGs related to GIM. Using LASSO logical regression algorithm to select 4 genes (Figure 4A), using SVM-RFE algorithm to identify 10 genes as potential biomarkers (Figure 4B). The four genes identified by the two algorithms: GOT1, ALDH3A2, ACSF2 and SESN2 are considered to be potential diagnostic biomarkers of GIM(Figure 4C).

Hub genes identified using the two algorithms. (A) Least absolute shrinkage and selection operator (LASSO) logistic regression algorithm. (B) Support vector machine-recursive feature elimination (SVM-RFE) algorithm. (C) Venn diagram showing the overlaps in the hub genes identified using the two algorithms.
We adopted the ROC curve and the area under ROC curve(AUC) to assess the diagnostic value of the four genes as disease diagnosis genes. The AUC values of the four hub genes were GOT1: 0.906, ALDH3A2: 0.955, ACSF2: 0.899 and SESN2: 0.962 respectively (Figure 5A). This shows that all the hub genes could effectively distinguish GIM from control samples. Then, to validate our above results, we used the independent dataset GSE78523 as the verification dataset to identify the expression level and diagnostic value of four hub genes, and further verify the clinical application value of hub gene. The box plot was used to determine the expression level of four review genes in GIM group and control group. The results showed that the differential expression of GOT1, SESN2 and ACSF2 in GIM group and control group could also be observed in GSE78523 dataset, but there was no significant difference in ALDH3A2 expression between GIM group and control group (Figure 5B). Their diagnostic value was verified by repeating the same ROC analysis using the above 4 hub genes in the GSE78523 dataset. Three of the hub genes showed AUC values of more than 0.75, while the ALDH3A2 genes showed AUC values of 0.676(Figure 5C).

Diagnostic effectiveness of the biomarkers. (A) The ROC curve of GOT1, ALDH3A2, ACSF2 and SESN2 in the training group. (B) The GSE78523 dataset was used to validate the differential expression for GOT1, ALDH3A2, ACSF2 and SESN2 genes. (C) The ROC curve of GOT1, ALDH3A2, ACSF2 and SESN2 in the testing group.
qRT-PCR Experiment and Immunohistochemical Staining
To verify the results of the analysis, qRT-PCR experiment was used to detect the expression of three hub genes. Figure 6 showed that there were significant changes in the expression levels of GOT1,ACSF2 and SESN2 in normal gastric mucosa samples and GIM gastric mucosa samples(P<0.05).

The expression levels of the three hub genes between healthy control group and GIM group. ****P < 0.0001.
In order to further verify the expression of these three hub genes in vivo, we performed immunohistochemical staining on GIM samples and healthy samples. As expected, GOT1 and SESN2 were highly expressed in GIM, while ACSF2 was lowly expressed in GIM.(Figure 7)
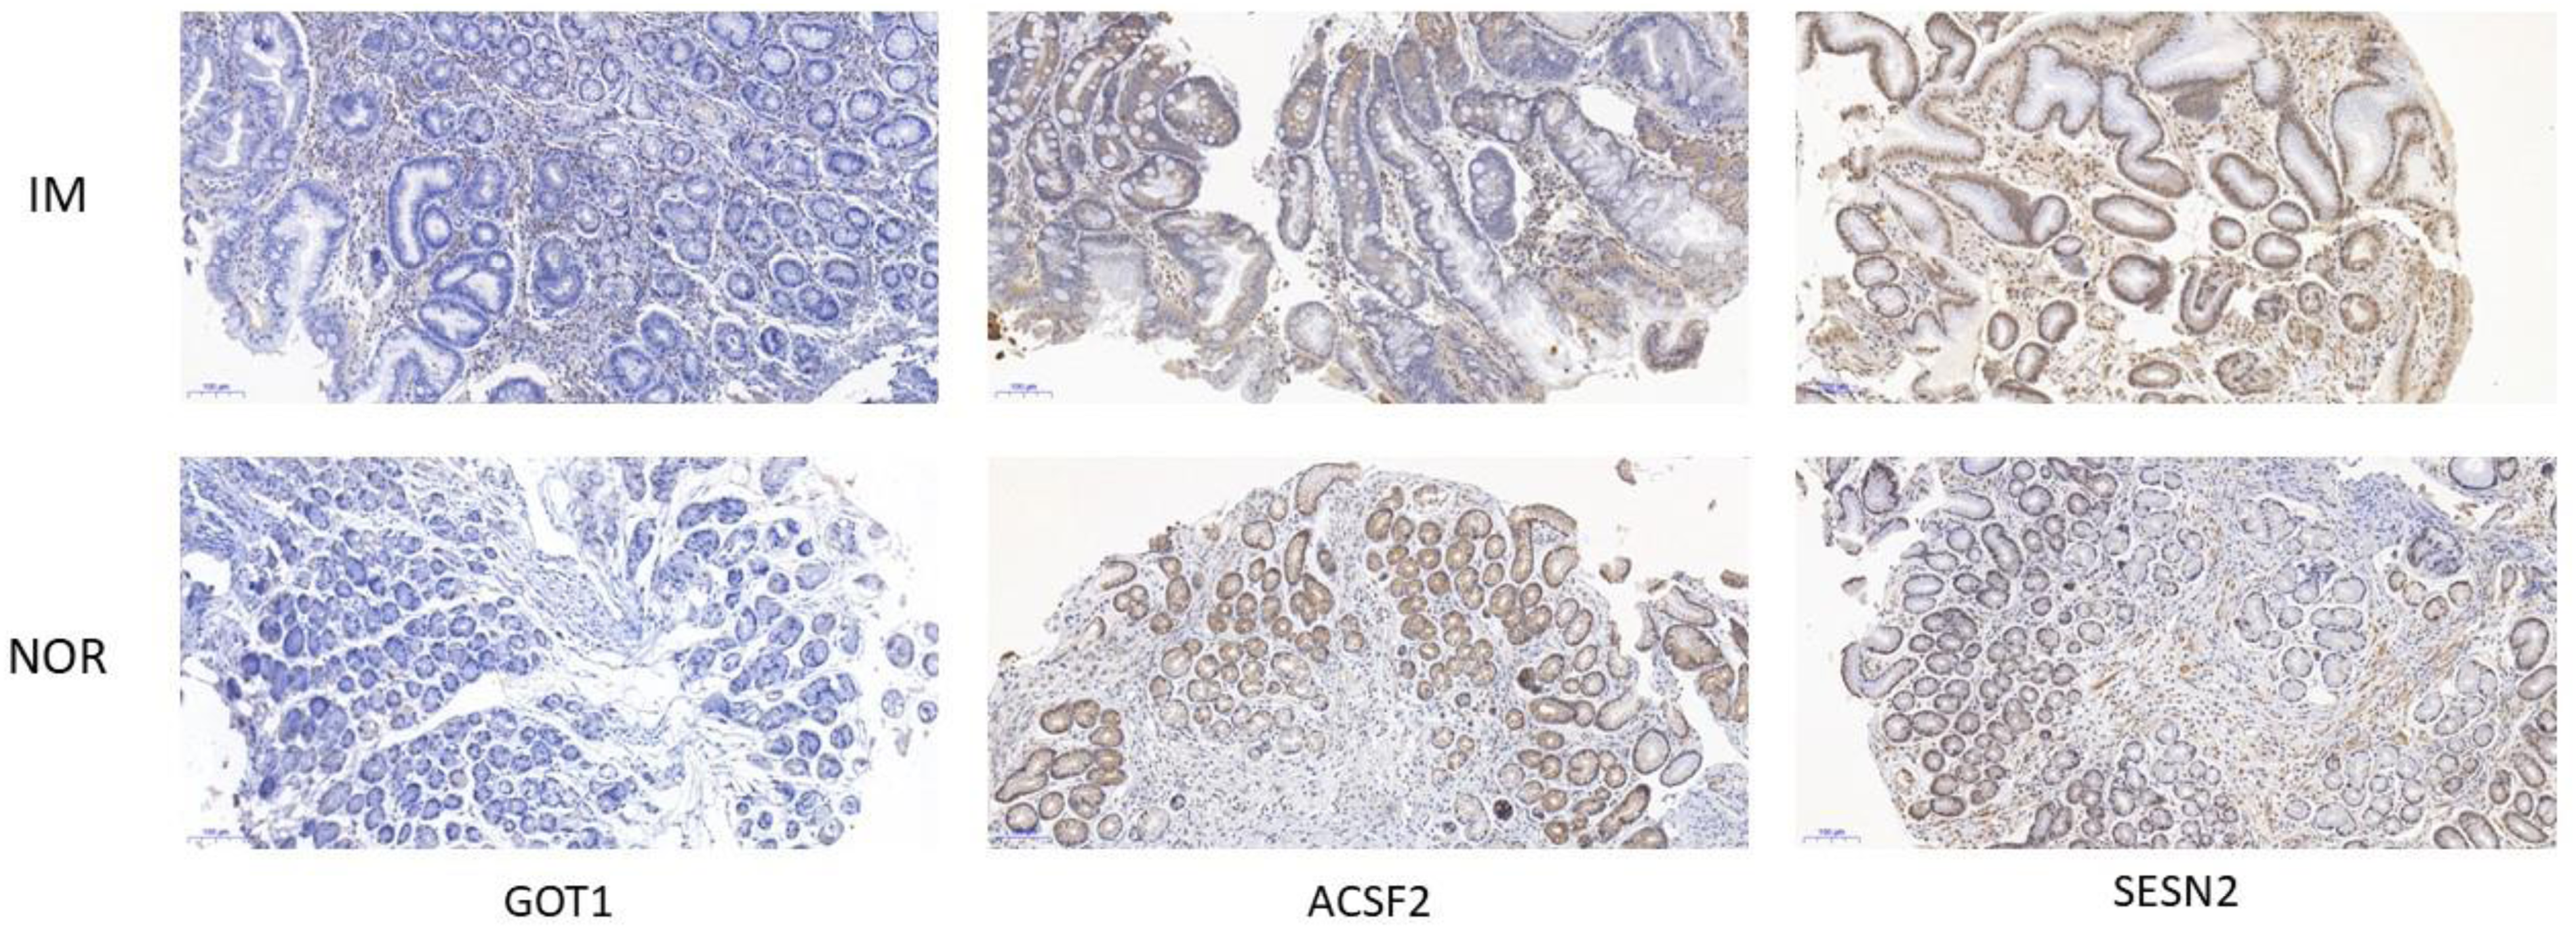
Immunohistochemical staining of gastric mucosa.
Discussion
Although great progress has been made in treatment in recent decades, the prognosis of patients with GC is still poor, with a 5-year overall survival rate of between 20% and 40%. 20 GIM is one of the histopathological precancerous lesions of the stomach and is considered to be an important inducing factor for the development of intestinal GC.6,21 Monitoring GIM and reversing it is an important way to stop the development of GC. 22 To clarify its pathogenesis and take appropriate measures may be the key to the prevention of gastric cancer. Previous studies had revealed the important regulatory role of ferroptosis in the proliferation, invasion and metastasis of GC.23,24 However, the role of ferroptosis in gastric precancerous lesions, especially in GIM is not clear.
In this study, we associated GIM with ferroptosis and used analysis and verification to illustrate this correlation. We combined and analyzed two mRNA microarray datasets to obtain 1946 DEGs, and used WGCNA analysis to select 880 genes closely related to the clinical characteristics of GIM. Finally, 12 FRGs related to GIM were obtained by comparing with FerrDb database.
Machine learning is widely used in the field of biomedicine, showing excellent efficiency in clinical diagnosis and optimal treatment.25,26 In this study, we used two machine learning algorithms (LASSO, SVMRFE) to screen four hub genes(GOT1, ALDH3A2, ACSF2, SESN2) from DEFRGs. In order to further evaluate the diagnostic effect, we used the verification set for ROC analysis. The results of this analysis show that three of these genes (GOT1, ACSF2, SESN2) could accurately classify patients and healthy individuals, indicating their potential value in molecular diagnosis. To confirm the validity of these results, we performed qRT-PCR experiments and immunohistochemical staining of clinical samples to verify the differential expression of GOT1, ACSF2, and SESN2 in intestinal metaplasia.
Glutamate Oxaloacetate Transaminase 1 (GOT1) is a pyridoxal phosphate-dependent enzyme which exists in cytoplasmic and mitochondrial forms, which exists in cytoplasm and mitochondria. GOT1 plays a role in amino acid metabolism and the urea and tricarboxylic acid cycles 27 . Iron release after GOT1 knocking can promote ferroptosis 28 and inhibition of GOT1 can promote pancreatic cancer cell death through ferroptosis. 29 Our study showed that the mRNA expression of GOT1 increased in GIM. Therefore, it can be assumed that GOT1 inhibits ferroptosis in GIM and promotes the progression of gastric precancerous lesions, which needs to be proved by experiments in the future. There are few studies on Acyl-CoA Synthetase Family Member 2 (ACSF2). Some studies had found that deferoxamine can down-regulate ACSF2 to promote the recovery of traumatic spinal cord. 30 Several other studies had shown that ACSF2 was associated with poor prognosis in a variety of tumors.31–33 However, how ACSF2 regulates ferroptosis in GIM needs further study. SESN2 is a highly conserved antioxidant protein, which is activated under various pressures 34 and may be involved in the response of cells to different stress conditions. it has been found that SESN2 is a protective gene against ferroptosis caused by septicemia and liver damage caused by ferroptosis.35,36
However, this study still has limitations. The data we analysed were mainly downloaded from the GEO database, and although we used clinical samples for validation, further independent and prospective cohort studies are needed to validate the model. In addition, its molecular mechanisms require further study. In summary, we proposed three new GIM ferroptosis related markers, these genes may be new therapeutic targets for GIM.
Conclusion
We identified three central genes (GOT1, ACSF2, SESN2), which are closely related to ferroptosis in GIM and can distinguish GIM patients from the control group, so they are potential biomarkers of ferroptosis for disease diagnosis and treatment monitoring. However, the research on ferroptosis and GIM is still in its infancy. More studies will provide more evidence for the prevention and treatment of GIM from ferroptosis. This study provides new insights into ferroptosis and GIM.
Footnotes
Abbreviations
Acknowledgments
The authors sincerely thanks Ms. Fan Shanshan for her guidance on manuscript writing.
Funding
This study was supported by the Anhui Province Health Research Program(AHWJ2023BBa20018).
Declaration of Conflicting Interests
The authors declare that the research was conducted in the absence of any commercial or financial relationships that could be construed as a potential conflict of interest.
Ethical Approval
The Ethics Committee of the second affiliated Hospital of Anhui University of traditional Chinese Medicine reviewed and approved this study(2022-zj-20). All patients signed the informed consent form before participating in the study.