
Abstract
Objectives
Gastric cancer (GC) is one of the most prevalent malignancies worldwide, and early detection is crucial for improving patient survival rates. We aimed to identify immune infiltrating cell-related biomarkers in early gastric cancer (EGC) progression.
Methods
The GSE55696 and GSE130823 datasets with low-grade intraepithelial neoplasia (LGIN), high-grade intraepithelial neoplasia (HGIN), and EGC samples were downloaded from the Gene Expression Omnibus database to perform an observational study. Immune infiltration analysis was performed by single sample gene set enrichment analysis and Estimation of STromal and Immune cells in MAlignant Tumor tissues using Expression data. Weighted gene co-expression network analysis was used to explore the co-expression modules and genes, and further enrichment analysis was performed on these genes. A protein-protein interaction (PPI) network of these genes was constructed to identify biomarkers associated with EGC progression. Screened hub genes were validated by the rank sum test and reverse transcription quantitative polymerase chain reaction.
Results
Immune scores were significantly elevated in EGC samples compared to LGIN and HGIN samples. The green-yellow module exhibited the strongest correlation with both immune score and disease progression. The 87 genes within this module were associated with the chemokine signaling pathways, the PI3K-Akt signaling pathways, leukocyte transendothelial migration, and Ras signaling pathways. Through PPI network analysis, the hub genes identified were protein tyrosine phosphatase receptor-type C (PTPRC), pleckstrin, CD53, CD48, lymphocyte cytosolic protein 1 (LCP1), hematopoietic cell-specific Lyn substrate 1, IKAROS Family Zinc Finger 1, Bruton tyrosine kinase, and Vav guanine nucleotide exchange factor 1. Notably, CD48, LCP1, and PTPRC showed high expression levels in EGC samples, with the remaining hub genes demonstrating a similar expression trend.
Conclusion
This study identified 9 immune cell-related biomarkers that may be actively involved in the progression of EGC and serve as potential targets for GC diagnosis and treatment.
Keywords
Introduction
Gastric cancer (GC) is one of the most common malignancies worldwide and the fifth leading cause of cancer-related death. 1 The development of GC is a multifactor, multistep process that typically starts with gastritis and progresses to gastric precancerous lesions (GPL), early gastric cancer (EGC), and finally to advanced gastric cancer (AGC). 2 Current diagnostic strategies for GC mainly rely on endoscopy, imaging, and serology,3,4 but most patients who undergo these tests are already in the stage of AGC. 5 Unlike AGC patients, patients with EGC and GPLs (including low-grade intraepithelial neoplasia [LGIN] and high-grade intraepithelial neoplasia [HGIN]) are usually asymptomatic. 6 Therefore, it is crucial to improve early diagnosis to increase the overall survival rate of GC.
The heterogeneity of GC is well-recognized, with molecular profiling offering valuable insights into potential therapeutic targets and prognostic indicators.7,8 Several biomarkers such as programmed death-ligand 1 expression, human epidermal growth factor receptor 2 amplification, and microsatellite instability have been widely used in the treatment of GC. 9 Although the improvement in the prognosis of GC is still limited, neoadjuvant therapeutic strategies such as targeted therapies or immunotherapies have demonstrated clinical benefits.10,11 However, due to tumor resistance, it is particularly important to identify new immune-related therapeutic targets. 12
The tumor microenvironment, particularly the composition and abundance of immune cells, plays a pivotal role in GC progression. T helper cells are prominently infiltrated in GC patients and may be related to early carcinogenesis. 13 Increased mast cell infiltration was significantly associated with AGC 14 and poor prognosis. 15 Macrophages and myeloid-derived suppressor cells (MDSCs) promote gastric tumorigenesis by secreting soluble factors or modulating immune responses. 16
Weighted gene co-expression network analysis (WGCNA) and single-sample gene set enrichment analysis (ssGSEA) are 2 commonly used methods in complex disease research. WGCNA is used to define gene modules with similar expression patterns and to evaluate functional pathways and candidate molecular markers. 17 ssGSEA quantifies the level of immune cell infiltration through gene expression data. 18 These methods have been widely used in assessing immune and prognostic features in GC.19,20 In this study, we used public microarray datasets to evaluate the immune scores of LGIN, HGIN, and EGC by ssGSEA and identify immunity and disease progression-related genes using WGCNA. A protein-protein interaction (PPI) network of these genes was constructed to identify biomarkers associated with EGC progression.
Materials and Methods
Datasets Sources and Preprocessing
We performed an observational study to identify immune infiltrating cell-related biomarkers associated with EGC progression. In this study, the expression data were obtained from the Gene Expression Omnibus (GEO) database and processed using R 4.0.5 (https://www.r-project.org/). GSE55696 and GSE130823 were obtained by searching the keyword “low-grade intraepithelial neoplasia” in the GEO database (Table 1). GSE55696 was used as the training set, and GSE130823 was used as the validation set. LGIN, HGIN, and EGC samples were selected for further research. For probes corresponding to multiple genes, the average expression value was used as the gene expression value.
Basic information of datasets.
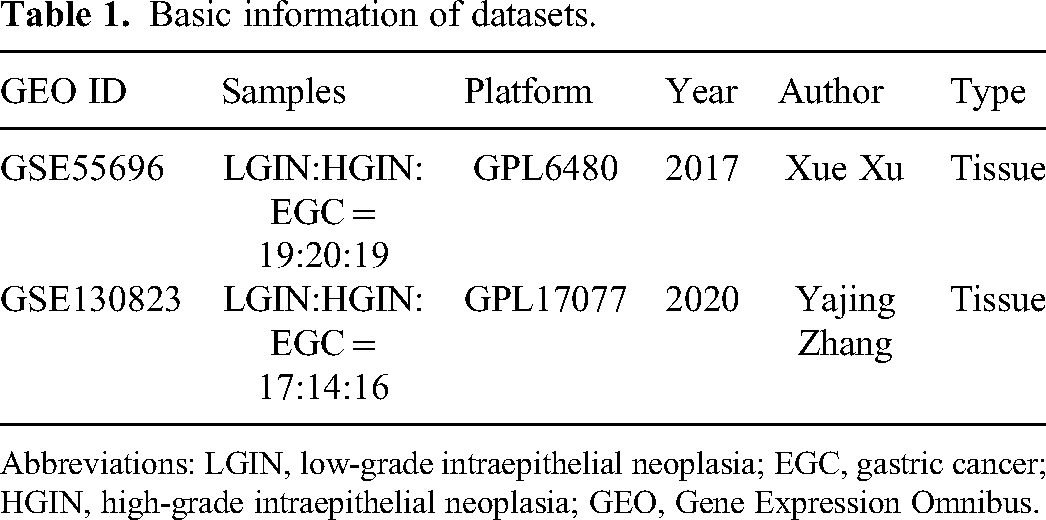
Abbreviations: LGIN, low-grade intraepithelial neoplasia; EGC, gastric cancer; HGIN, high-grade intraepithelial neoplasia; GEO, Gene Expression Omnibus.
Immune Cell Infiltration Analysis of the GSE55696 Dataset
The stromal score, immune score, and Estimation of STromal and Immune cells in MAlignant Tumor tissues using Expression data (ESTIMATE) score of GSE55696 were evaluated by ESTIMATE from R package (version 3.5.3). The scores of 23 immune cells were assessed by ssGSEA.
Weighted Gene co-Expression Network Analysis
WGCNA is a typical phylogenetic algorithm used to describe the correlation patterns between gene expression profiles and build gene co-expression networks. A scale-free gene co-expression network was constructed by using the R package “WGCNA” to analyze the co-expression network of the genes in the top 25% of the variation coefficient in GSE55696. First, the sample data are clustered using the “hclust” function to detect outliers. Then, the “pickSoftThreshold” function was applied to select a suitable soft-threshold power regulator to construct a scale-free topology. The adjacency matrix was calculated from this value, which was transformed into a topological overlap matrix (TOM) and the corresponding dissimilarity matrix (1-TOM). Genes were clustered by the mean linkage hierarchical clustering method. Based on the criteria of the hybrid dynamic clipping tree method, the minimum number of genes per gene network module was set. The signature genes of each module were calculated in turn, and the modules were clustered. The “Pearson” method was used to analyze the correlation between immune score and disease progression, and the module with the highest correlation between immune score and disease progression was selected as the hub module.
Analysis of Functional Enrichment
Gene ontology (GO) analysis and Kyoto Encyclopedia of Genes and Genomes (KEGG) pathway enrichment analysis were performed on immunity and disease progression-related genes using the R package “clusterProfiler” at a screening criterion of P < .05.
Identification of Hub Genes
A PPI network was constructed for immunity and disease progression-related genes using the STRING database (https://string-db.org/). To identify hub genes within this network, we employed the maximal clique centrality (MCC), maximum neighborhood component (MNC), degree, and edge percolated component (EPC) algorithms provided by the cytoHubba plug-in in Cytoscape software. The final hub genes were selected by identifying the intersecting genes among the top 10 node genes scored by each algorithm. The correlation between hub genes and differential immune cells was calculated using the “Pearson” method.
Validation of Hub Genes
The expression of the hub gene in the disease samples of each stage was analyzed by the rank sum test and represented by box plots. The expression of hub genes in the progression from GPLs to EGC was validated by the GSE130823 dataset. In addition, data from The Cancer Genome Atlas (TCGA) for stomach adenocarcinoma (STAD) were downloaded to analyze the expression of hub genes in normal controls and cancer samples.
Expression Verification of hub Genes by Quantitative Reverse Transcription Polymerase Chain Reaction
We collected 28 gastric tissue samples, including 8 LGIN tissue samples, 10 HGIN tissue samples, and 10 EGC tissue samples. Inclusion criteria were as follows: (1) Endoscopic biopsy-diagnosed with LGIN, HGIN, or EGC, all confirmed by pathological examination; (2) no treatment prior to diagnosis; (3) no concurrent malignancies; (4) absence of autoimmune diseases; (5) age between 18 and 70 years. Exclusion criteria were as follows: (1) Coagulopathy; (2) any condition precluding endoscopic resection; (3) previous history of GC; (4) presence of other malignancies; (5) prior gastric treatment; (6) cardiopulmonary insufficiency or hepatic/renal dysfunction; (7) history of other cancers; (8) incomplete clinical data. Additionally, there should be no statistical differences in age, gender, or body mass index among the groups. The study received approval from the Ethics Committee. Written informed consent was obtained from the participants for the collection of all samples. We then analyzed the expression of hub genes in the samples at different stages of the disease by reverse transcription quantitative polymerase chain reaction (RT-qPCR) and presented them in scatter plots. Total RNA was extracted using TRNzol Universal RNA Reagent (Y1705, TIANGEN). RT-qPCR was performed using a FastKing cDNA first strand synthesis kit (KR116, TIANGEN) and SuperReal PreMix Plus (SYBR Green, FP205, TIANGEN). GAPDH and ACTB were used as internal reference genes. The primer sequences are listed in Table 2. The 2−ΔΔCt method was used for relative quantitative analysis of the data. Significant differences between groups were analyzed by multiple comparisons with one-way analysis of variance (ANOVA) (GraphPad version 8.3.0). P < .05 was considered statistically significant.
Primer sequences used for the RT-PCR.

Abbreviations: PTPRC, protein tyrosine phosphatase receptor-type C; PLEk, pleckstrin; LCP1, lymphocyte cytosolic protein 1; HCLS1, hematopoietic cell-specific Lyn substrate 1; IKZF1, IKAROS Family Zinc Finger 1; BTK, Bruton tyrosine kinase; VAV1, Vav guanine nucleotide exchange factor 1.
Statistical Analysis
Statistical analysis was performed using R version 4.0.5. The expression of the hub gene in the disease samples of each stage was analyzed by the rank sum test and one-way ANOVA. P < .05 was considered statistically significant.
Results
Immune Infiltration Analysis
The results of ssGSEA analysis showed that infiltration levels of most immune cells were significantly increased in the EGC group compared to LGIN and HGIN groups (Figure 1A). Moreover, the stromal score, immune score, and ESTIMATE score were all significantly higher in the EGC group compared to the LGIN and HGIN groups (Figure 1B).

Immune infiltration analysis of the GSE55696 dataset. (A) Difference in the infiltration degree of 23 types of immune cells; (B) difference in Estimation of STromal and Immune cells in MAlignant Tumor tissues using Expression data (ESTIMATE) score, immune score, and stromal score. *P < .05; **P < .01; ***P < .001, and ****P < .0001; ns, not significant.
Screening of Immunity and Disease Progression-Related Genes by WGCNA
The samples were clustered by the average linkage method using WGCNA and 3 outlier samples were identified (GSM1341902, GSM1341918, and GSM1341930). The cutting tree height was set to 140 to remove the outlier samples. The remaining sample size is 55. Subsequently, β = 12 was chosen as the soft threshold to construct the scale-free network (Figure 2A), and a total of 9 modules were confirmed (Figure 2B). Among them, the green-yellow module had the highest correlation with the immune score and the most significant correlation with disease progression and was considered the hub module (Figure 2C). According to the absolute value of module membership > 0.8 and gene significance > 0.2, 96 genes related to the immune score and 87 genes related to disease progression were identified in the green-yellow module (Figure 2D-E). Finally, the 87 intersecting genes were identified as immunity- and disease progression-related genes (Figure 2F).
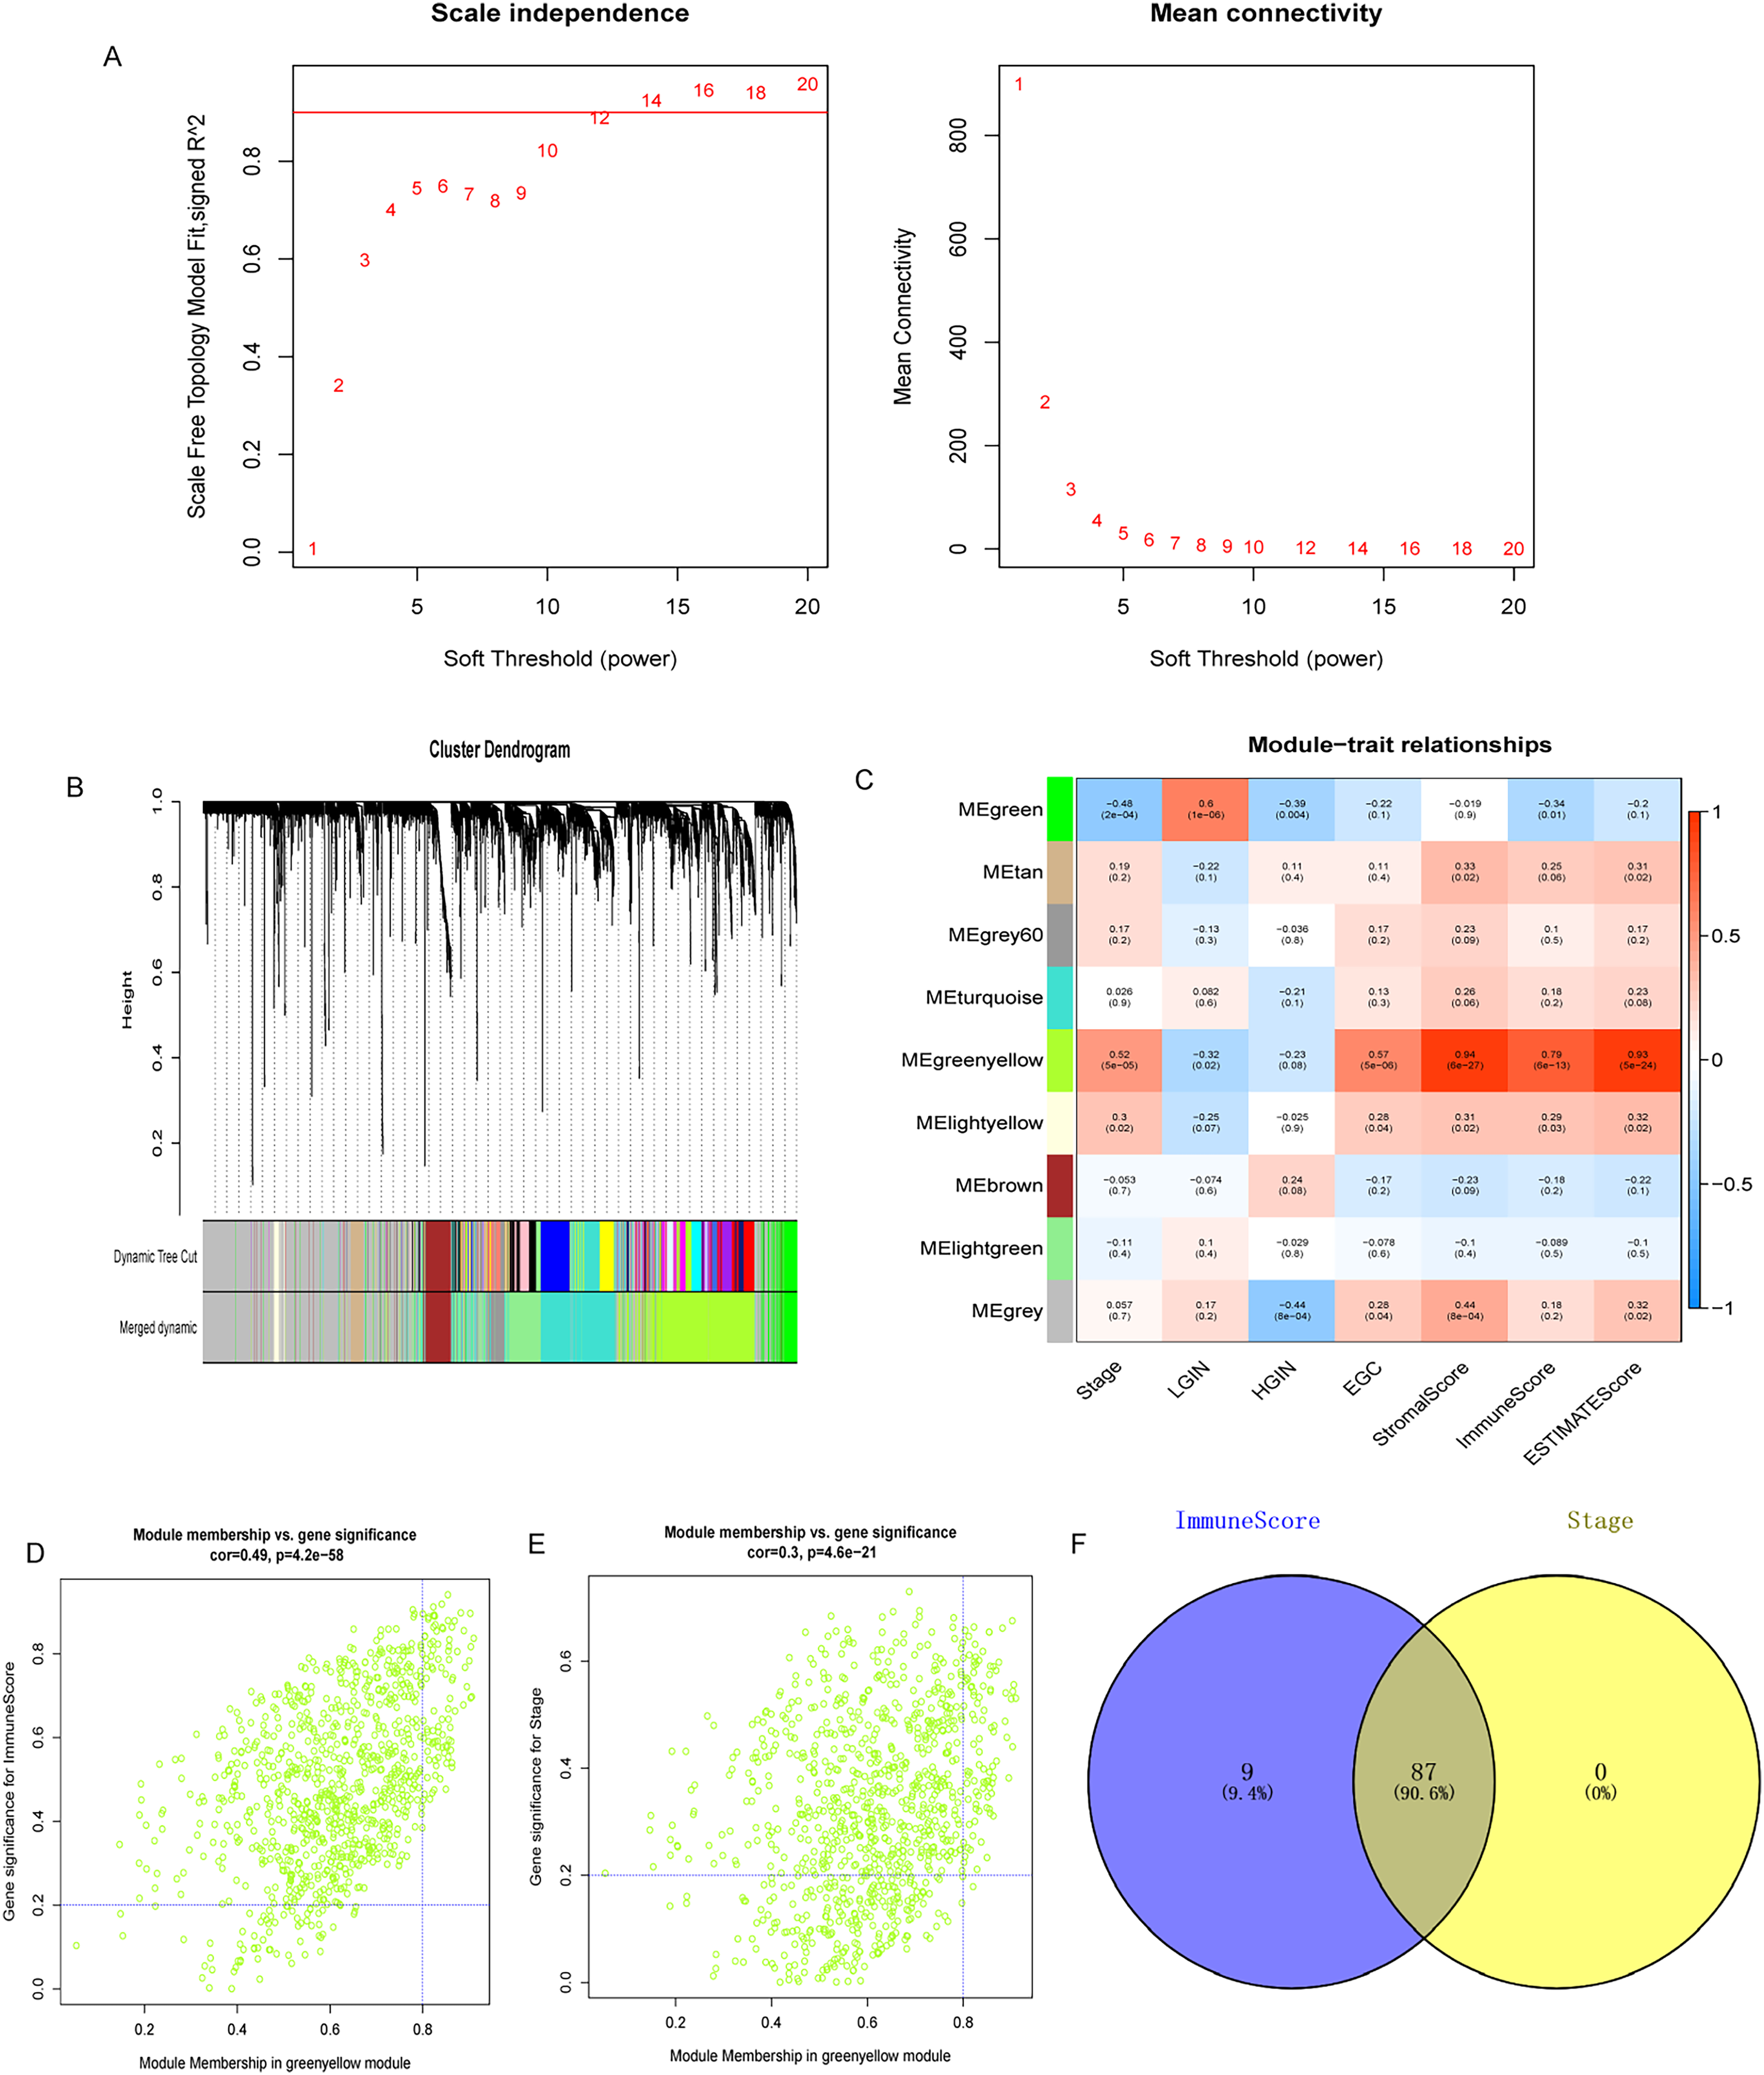
Weighted gene coexpression network analysis (WGCNA) analysis. (A) Scale-free fit exponent and average connectivity for soft threshold power (β); (B) Cluster dendrogram. Genes are divided into various modules by hierarchical clustering, and different colors represent different modules. (C) Heatmap of the correlation between modules and immune score. (D) Scatter plots of genes related to immune score in the green-yellow module. (E) Scatter plots of genes related to disease progression in the green-yellow module. (F) Venn diagram of immunity- and disease progression-related genes.
Enrichment Analysis of Immunity and Disease Progression-Related Genes
The enrichment analysis conducted on the 87 intersecting genes revealed their association with immune, signal conduction, and cancer pathways. According to the results of the GO results, for biological processes, genes were mainly enriched in activation of immune response and regulation of small GTPase-mediated signal transduction, and positive regulation of leukocyte cell-cell adhesion; for cellular components, genes were mainly enriched in external side of plasma membrane and immunological synapse; and in terms of molecular functions, genes were mainly enriched in integrin binding and SH3 domain binding (Figure 3A). KEGG pathway analysis showed that these genes were involved in the chemokine signaling pathways, PI3K-Akt signaling pathways, leukocyte transendothelial migration (LTEM), and Ras signaling pathways (Figure 3B).

Functional analysis of immunity- and disease progression-related genes. (A) Bubble chart of GO enrichment results. (B) Bubble chart of KEGG enrichment results. Abbreviations: GO, gene ontology; KEGG, Kyoto Encyclopedia of Genes and Genomes.
Identification of hub Genes
Based on the STRING database, a PPI network was constructed for 87 immunity and disease progression-related genes (Figure 4A). Based on the MCC, MNC, degree, and EPC algorithms of the cytoHubba plugin, a Venn diagram was constructed (Figure 4B). Finally, a total of 9 hub genes, including protein tyrosine phosphatase receptor-type C (PTPRC), pleckstrin (PLEK), CD53 molecule (CD53), CD48 molecule (CD48), lymphocyte cytosolic protein 1 (LCP1), hematopoietic cell-specific Lyn substrate 1 (HCLS1), IKAROS Family Zinc Finger 1 (IKZF1), Bruton tyrosine kinase (BTK) and Vav guanine nucleotide exchange factor 1 (VAV1), were identified. A PPI network was constructed for the 9 hub genes (Figure 4C). The results indicated that these 9 hub genes were interrelated with each other.

Identification of hub genes. (A) protein-protein interaction (PPI) network of immunity and disease progression-related genes; (B) Venn diagram of screening hub genes based on PPI; (C) The network diagram of hub genes.
Correlation of hub Genes and Immune Cells
In addition, the correlation between hub genes and differential immune cells was calculated by the “Pearson” method. All of the 9 genes were significantly and positively correlated with immune cells, among which the correlation with type 1 T helper cells, MDSCs, regulatory T cells and T follicular helper cells was strong, and the correlation with type 17 T helper cells was weakest (Figure 5).

Correlation of hub genes and immune cells. (A) GSE55696 dataset. (B) GSE 130823 dataset. Red represents a high correlation; blue represents a low correlation. *P < .05; **P < .01; ***P < .001.
Expression Analysis of hub Genes
The expression levels of hub genes in GSE55696 were evaluated and indicated that PTPRC, PLEK, CD53, CD48, LCP1, HCLS1, IKZF1, BTK, and VAV1 were all highly expressed in the EGC group (Figure 6A). The verification results of the GSE130823 dataset are consistent with this finding (Figure 6B). We further validated the expression of genes in the TCGA-STAD dataset. Compared with normal controls, CD53, HCLS1, LCP1, PLEK, PTPRC, and VAV1 were significantly highly expressed, and BTK, CD48, and IKZF1 also showed a trend of high expression in GC samples (Figure 7).
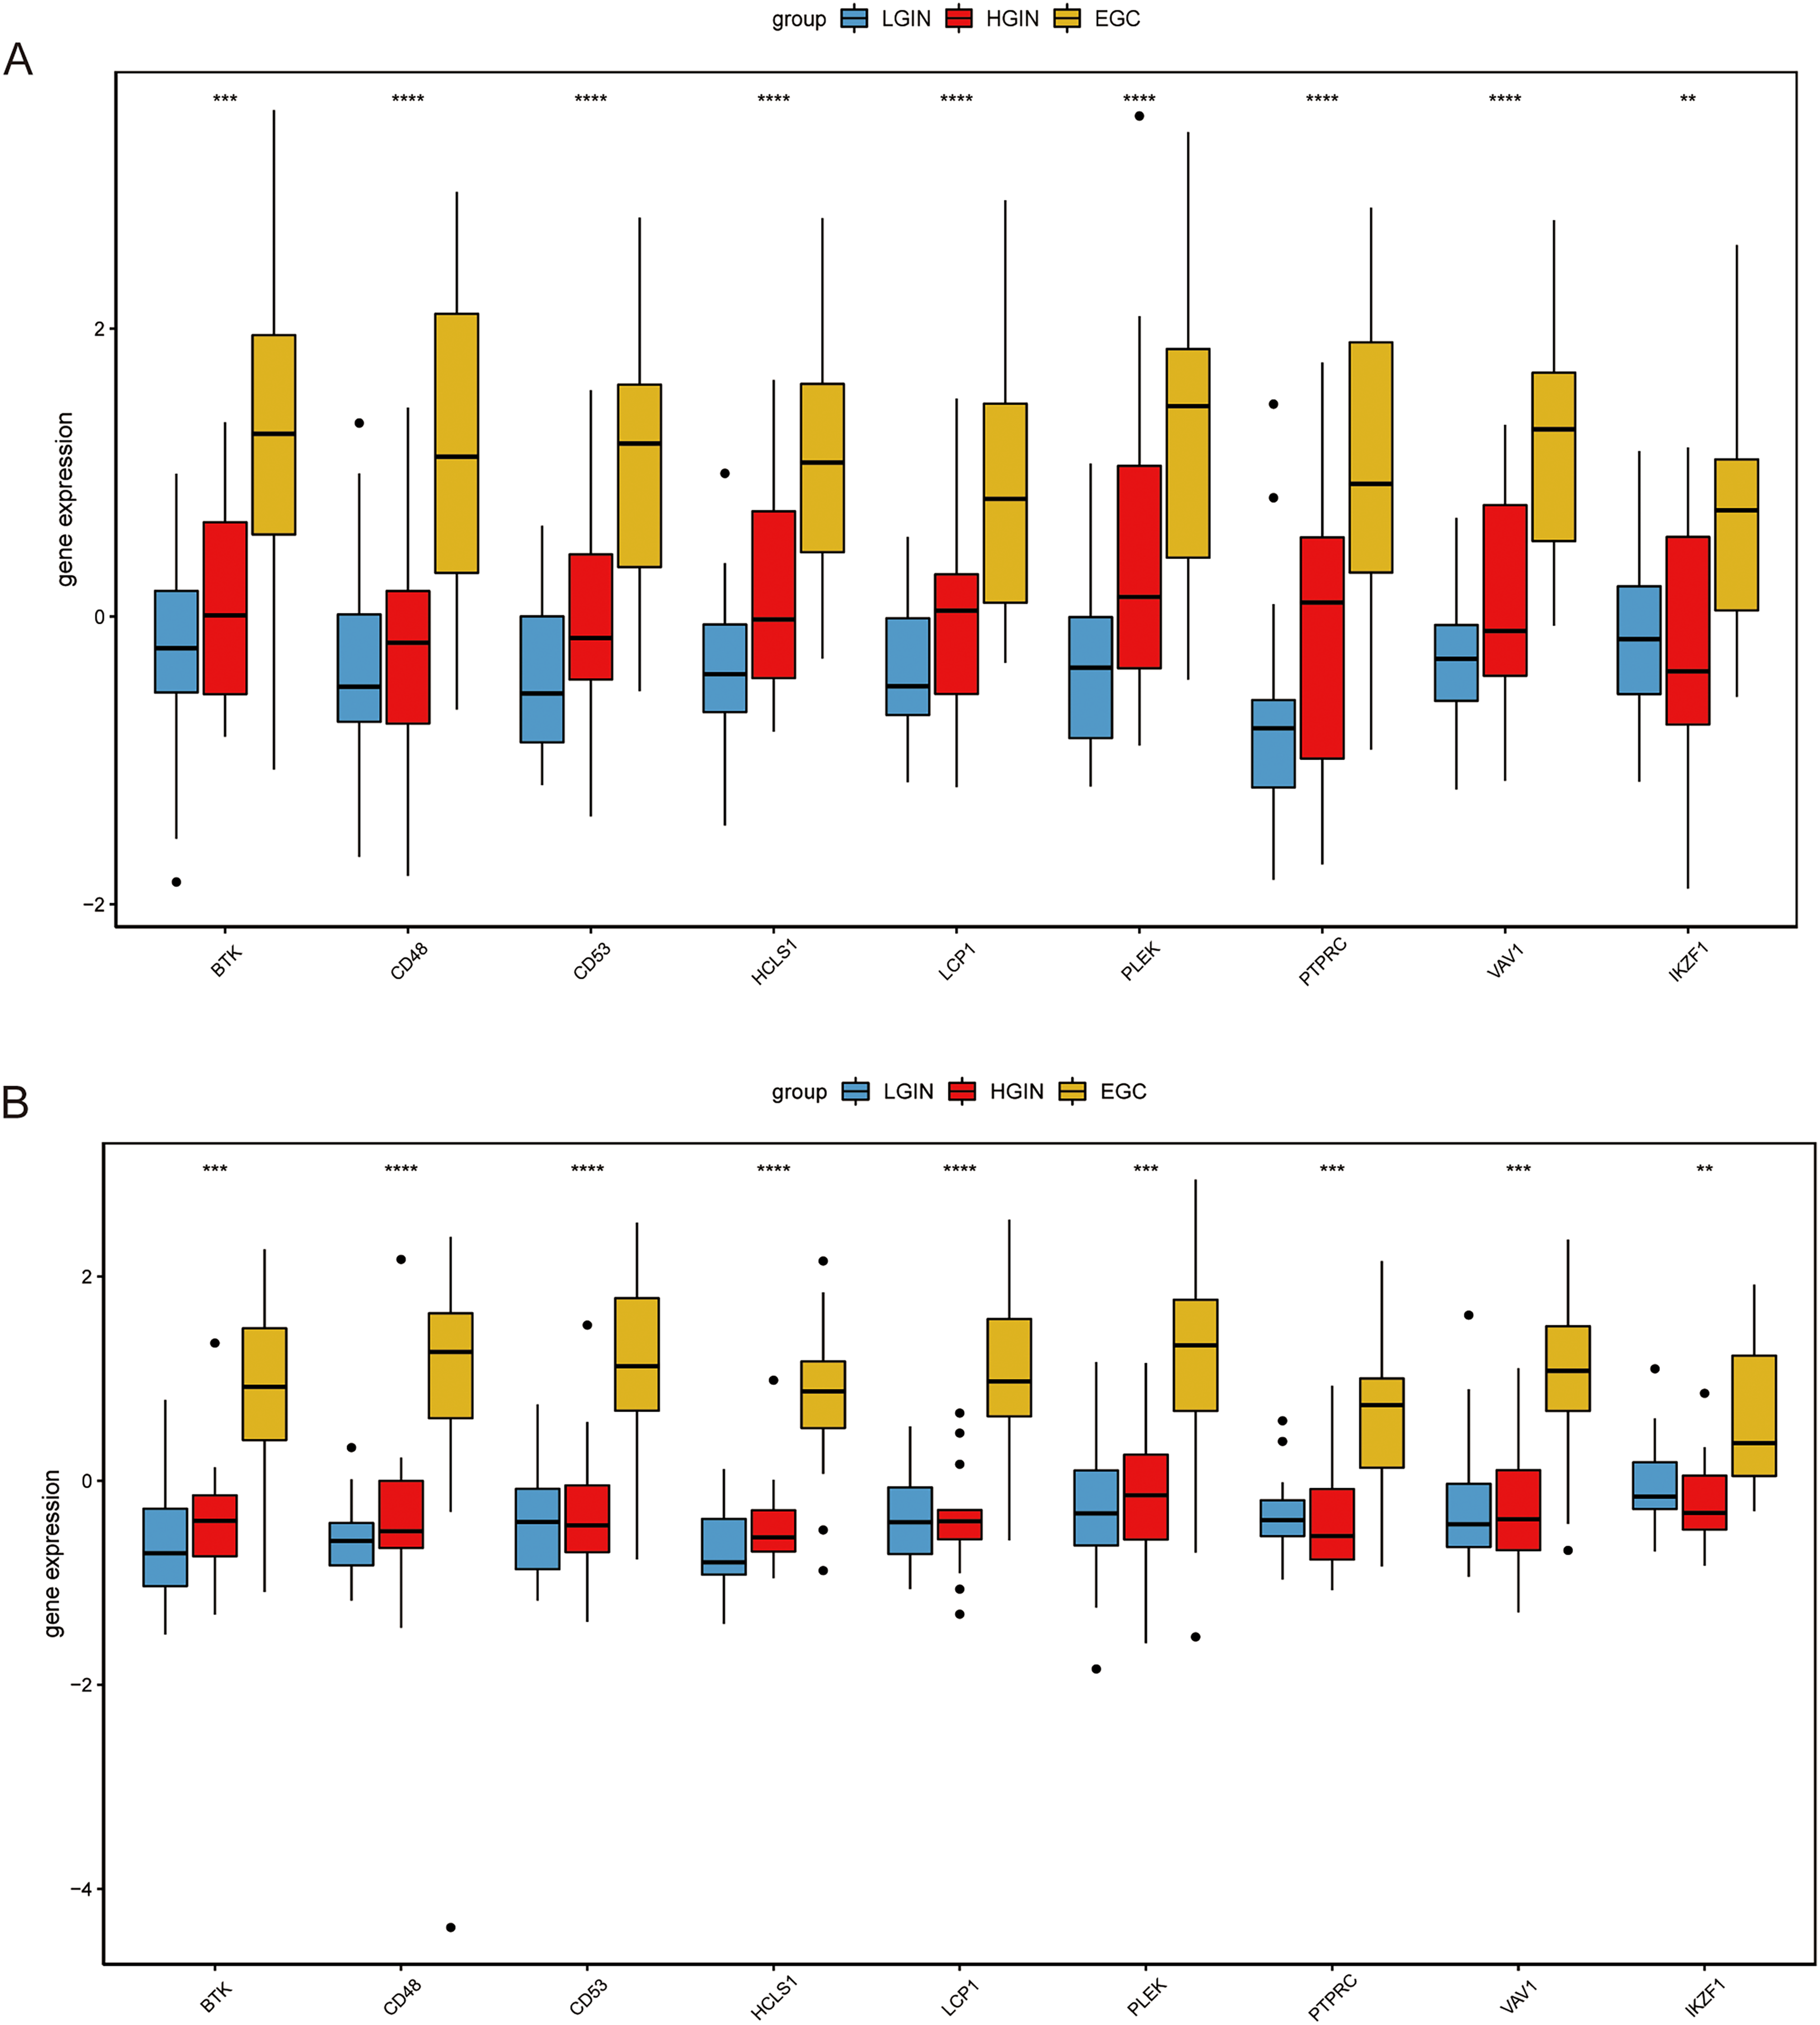
The expression of hub genes in the GSE55696 dataset (A) and GSE130823 dataset (B). **P < .01; ***P < .001; ****P < .0001.

The expression of hub genes in the The Cancer Genome Atlas (TCGA) database. *P < .05; **P < .01; ***P < .001 and ****P < .0001; ns, not significant.
Expression Verification of hub Genes by RT-qPCR
Expression verification of hub genes was performed by RT-qPCR. Compared with the LGIN group, CD48, LCP1, and PTPRC were significantly upregulated in the EGC group. Compared with the HGIN group, CD48 was significantly upregulated in the EGC group. Furthermore, BTK, CD53, HCLS1, IKZF1, PLEK, PTPRC, and VAV1 showed a trend of high expression in the EGC group compared with the LGIN and HGIN groups (Figure 8). The trend of hub gene expression verified by RT-qPCR was consistent with the results of the above analysis.
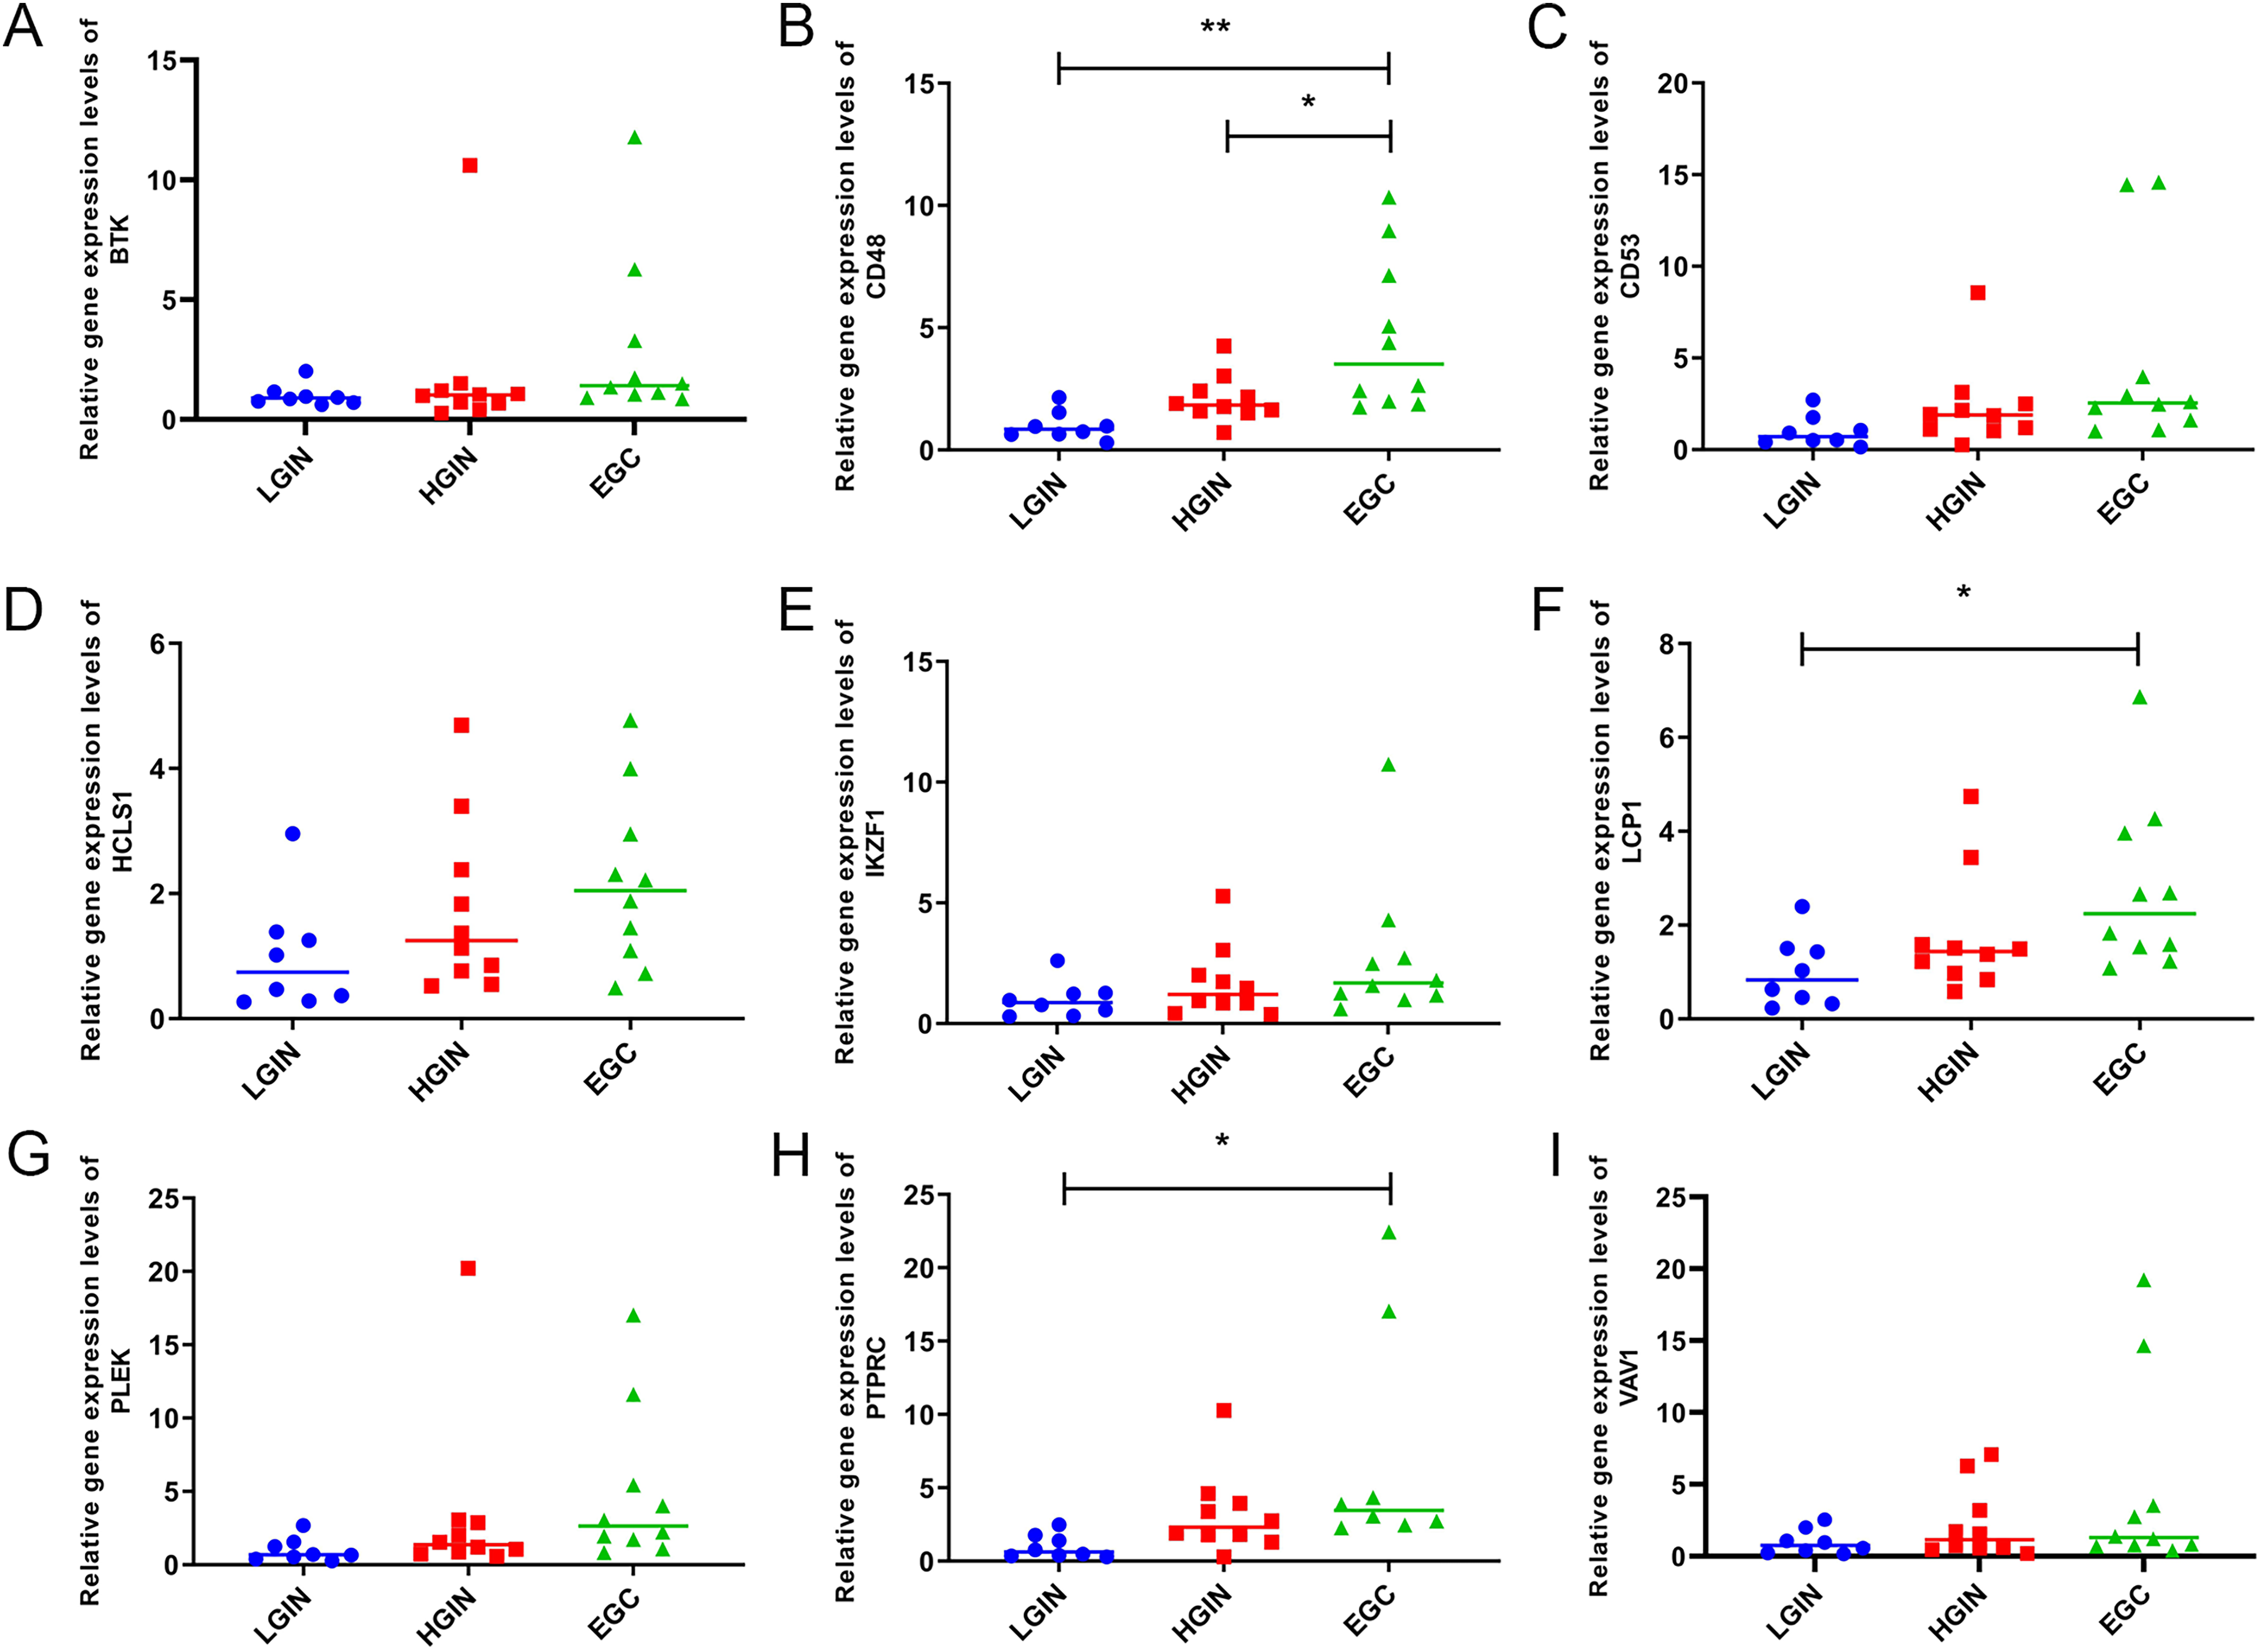
The expression of the hub gene was measured using RT-qPCR in 28 gastric tissue samples, including 8 LGIN tissue samples, 10 HGIN tissue samples, and 10 EGC tissue samples. *P < .05; **P < .01. Abbreviations: LGIN, low-grade intraepithelial neoplasia; EGC, gastric cancer; HGIN, high-grade intraepithelial neoplasia; RT-qPCR, reverse transcription-quantitative polymerase chain reaction.
Discussion
The incidence of GC has declined due to measures such as eradication of Helicobacter pylori (HP) and early screening for GC. 1 Early or late diagnosis of GC has a direct impact on its clinical outcome. 21 Therefore, early detection, diagnosis, and treatment are the main strategies to improve the prognosis and reduce the mortality of GC patients. Some biomarkers, such as pepsinogen and anti-HP IgG antibodies, can be used to detect GPLs with moderate sensitivity to cancer. 22 There is still a lack of ideal early biomarkers available at present.
In the early stages of GC, immune cells can indicate potential tumor risk or pathological changes. 23 Inflammation typically precedes the onset of malignancy in GPLs to GC, and oncogenic changes promote an inflammatory response in the tumor. 24 Following HP infection, innate immunity is be activated, releasing pro-inflammatory factors and immune cells and altering the local immune microenvironment, which is closely related to the progression of GC. 25 Previous studies have shown that the immune microenvironment is more active in EGC than in GPLs. 26 Consistent with this, our results showed that from LGIN to HGIN to EGC, infiltration levels of most immune cells and immune scores gradually increased. This significant inflammatory response may drive the transition from a precancerous state to tumorigenesis. 27
Functional enrichment analysis was performed on 87 intersecting genes belonging to the yellow-green module, which are linked with immunity and disease progression. GO analysis showed that these genes were mainly involved in the activation of immune responses, consistent with immune infiltration analysis. In addition, these genes are also involved in the regulation of small GTPase-mediated signaling. Small GTPases of the Rho family could promote cancer cell proliferation, angiogenesis, invasion, and metastasis, leading to tumor progression.28,29 KEGG analysis showed that these genes are involved in chemokine signaling pathways, PI3K-Akt signaling pathways, LTEM, and Ras signaling pathways. These pathways play important roles in the immune and inflammatory responses, cell migration, proliferation, and survival, and are critical in cancer progression and metastasis.30–32 Certain chemokines like CCL20, PI3K/Akt, and Ras have been shown to be involved in the progression of GPLs.33–35 Overall, these intersecting genes may be involved in LGIN to GC progression by regulating immune cell activity and cancer-related pathways.
Further analysis was conducted on 9 hub genes, including PTPRC, PLEK, CD53, CD48, LCP1, HCLS1, IKZF1, BTK, and VAV1. Some of these genes have been previously associated with GC progression. PTPRC was overexpressed in GC induced by HP and its overexpression was positively correlated with GC development. 36 LCP1, a tumor growth and metastasis regulator, has been linked to poor prognosis in GC.37,38 Vav1 may affect the invasion, metastasis, and progression of GC. 39 HCLS1 is significantly upregulated in GC cells and mediates apoptosis. 40 Furthermore, pathogens such as HP can drive macrophage polarization to an M2 phenotype, which promotes the progression of GPLs. 23 BTK inhibitors exhibited anticancer activity in GC cells, 41 and inhibition of BTK in tumor-infiltrating B cells promotes macrophage repolarization from M2 to M1. 42 Therefore, BTK may promote GC by regulating tumor B cell and M2 macrophage polarization. Additionally, previous studies suggest an association between hub genes and immune response. For example, CD53 is a tetraprotein expressed on various immune cells that regulates signaling and cellular responses in the immune system. 43 CD48 has an active immune phenotype and is also closely related to immunosuppression and inflammatory responses. 44 We observed that these hub genes were positively associated with many immune cells and were significantly upregulated in EGC compared to LGIN and HGIN, suggesting they might be the driving genes for the transition from GPLs to EGC. Public datasets and RT-qPCR validation yielded consistent results, demonstrating the reliability of the results.
However, there are limitations in the study. This study was carried out through bioinformatics analysis, and the sample size was relatively small. In addition, further in vivo or in vitro experimental validation is needed.
Conclusion
In summary, this study identified 9 hub genes as immune cell-related biomarkers associated with EGC progression, which may provide some basis for the early diagnosis of GC and the development of novel therapeutic strategies.
Footnotes
Abbreviations
Ethics Statement
The study was conducted in accordance with the Declaration of Helsinki and approved by the ethics committee of the Second Hospital of Hebei Medical University (2022-R066), Shijiazhuang, China.
Informed Consent
Written informed consents were obtained from the participants for the collection of all samples.
Declaration of Conflicting Interests
The authors declared no potential conflicts of interest with respect to the research, authorship, and/or publication of this article.
Funding
The authors disclosed receipt of the following financial support for the research, authorship, and/or publication of this article: This study was supported by the Hebei Provincial Government Funded the Project of Clinical Medical Talents (303-2022-27-26).