
Abstract
Highlights
Overexpression of miR-362-3p inhibited cell viability, proliferation, migration, and invasion but increased the apoptosis of 143B and U2OS cells in vitro. Overexpression of miR-362-3p suppressed the growth of osteosarcoma and aggravated its pathological injuries in vivo. The effects of overexpression of miR-362-3p on osteosarcoma in vivo and in vitro were involved in inhibiting the IL6ST/JAK2/STAT3 pathway.
Introduction
Osteosarcoma (OS) is one primary malignant bone tumor that usually occurs in adolescents ranging from 15 to 19 years old, with approximately 4 million cases worldwide each year. 1 Although the prominent symptoms of OS just are pain at the tumor site and local soft tissue lumps, the rapid progress of OS frequently induces severe damage of bone tissue and even pathological fractures. 2 In addition, it is usually accompanied by some other complications when the lung metastasis of OS occurs, such as anemia and weight loss. 3 Although local surgical resection combined with chemotherapeutics (including methotrexate, adriamycin, cisplatin, and iso-cyclophosphamide) has achieved significant therapeutic effects with the continuous development and progress of treatment methods in recent years, the 5-year survival rate of patients with OS is still low and the prognosis of patients with metastatic OS is poor.4,5 Therefore, there is an urgent need to investigate the pathological mechanisms of OS to expand the novel strategies for the treatment of OS.
At present, more and more studies have demonstrated that microRNAs (miRNAs), one kind of RNA molecule with approximately 19 to 25 bases in eukaryotes, made a great contribution to regulating the pathological process of OS.6,7 By targeting the downstream mRNAs, epithelial–mesenchymal transition, Wnt/β-catenin signaling pathway, and so on, miRNAs regulate the progression and the lung metastasis of OS.8,9 In addition, the abnormal expression of multiple miRNAs in peripheral blood not only serves as the diagnostic biomarkers but also acts as the prognostic biomarkers for OS, such as miR-27a, miR-191, miR-223, miR-497, and miR-101, etc.10,11 MiR-362, one kind of miRNA, is divided into 2 mature bodies (miR-362-3p and miR-362-5p) that play different regulatory roles in the development of various diseases. 12 A previous study indicated that miR-362-3p directly targets SERBP1 to inhibit the proliferation and migration of ovarian carcinoma. 13 Moreover, it was suggested that miR-362-3p regulated the AKT/FOXO3 signaling pathway to inhibit the proliferation, cell cycle, and migration of renal carcinoma by targeting SP1. 14 In addition, the expression of miR-362-3p not only inhibited the proliferation and migration ability of cervical carcinoma cells by negatively targeted regulation of MCM5 but also was associated with its poor prognosis. 15 Although it has confirmed that miR-362-3p plays an important regulatory role in the formation and development of diverse kinds of tumors, there is no current research revealing the significant role of miR-362-3p on OS and investigating the related mechanisms of miR-362-3p in regulating the abilities of proliferation, migration, invasion, and apoptosis of OS cells. Therefore, the present study aims to explore the regulatory mechanism of miR-362-3p on OS.
Interleukin 6 signal transducer (IL6ST, also known as gp130 or CD130), located in the long arm of chromosome 5, is one common receptor subunit in the interleukin-6 family, which initiates intracellular transmission by mediating receptor system signals of IL-6, IL-11, OSM, and so on. 16 The current studies indicated that IL6ST played an essential role in the progression, metastasis, and prognosis of multiple cancers, which not only promoted bone metastasis from breast cancer but also predicted the adverse prognosis of nonmetastatic gastric cancer.17–19 The disulfide bonds of IL6ST combine to form dimers under the catalysis of IL-6 family cytokines to phosphorylate the downstream tyrosine kinases, including Janus kinase 1 (JAK1), JAK2, and tyrosine kinases 2. 20 The phosphorylated JAK further facilitates the phosphorylation of downstream STAT when combined with the receptor. The phosphorylated STAT subsequently binds in pairs to form a dimer and transfers to the nucleus to affect the transcription and expression of related proteins by modifying genes. 21 The JAK/STAT pathway, an important signaling pathway that is widely involved in cell proliferation, differentiation, apoptosis, inflammatory response, and immune response, plays an essential role in the occurrence and development of various diseases, especially for malignant tumors, such as OS, breast cancer, head and neck cancer, multiple myeloma, lymphoma, and so on.22–28 The previous studies have confirmed that the JAK2/STAT3 pathway was excessively activated in OS.29,30 Moreover, it has been affirmed that lymphocyte cytoplasmic protein 1 promoted the proliferation and metastasis of osteosarcoma cells by regulating the JAK2/STAT3 pathway. 31 Although it was reported that IL6ST was a cytokine that promotes the progression and metastasis of cancers and predicts the risk of recurrence of cancers and the JAK2/STAT3 pathway was one of the dominantly carcinogenic mechanisms of OS, it is still unclear the role of IL6ST on OS and whether the IL6ST/JAK2/STAT3 pathway is involved in alleviating OS.
Therefore, in the present study, we aimed to investigate whether the modified miR-362-3p regulates the proliferation, migration, invasion, and apoptosis of OS cells through the IL6ST/JAK2/STAT3 signaling pathway.
Materials and Methods
Chemicals and Reagents
The 1640 culture medium (Cat. 21870076), fetal bovine serum (FBS, Cat. 278), and 0.25% trypsin (Cat. LGSJ01-1103-1) were purchased from Gibco (Grand Island, USA). The Lipofectamine 2000 reagent (Cat. 11668030) was purchased from Thermo Fisher (Massachusetts, USA). The TRIzol agent (Cat. 9108), PrimeScript™ RT reagent Kit with gDNA Eraser (Cat. RR092A), and SYBR Green™ Premix Ex Taq™ II (Cat. RR420A) were bought from Takara (Kyoto, Japan). The crystal violet dye solution (Cat. HK2048) was obtained from HaoKebio (Hangzhou, China). The phosphate buffer saline (PBS, Cat. C0221A) solution, cell counting kit-8 (CCK-8, Cat. C0038), 5-ethynyl-2’-deoxyuridine (EdU) agent (Cat. ST067), hematoxylin and eosin (H&E) staining kit (Cat. C0105 M), TUNEL one-step cell apoptosis detection kit (Cat. 2332), RIPA lysis solution (Cat. P0013C), BCA protein concentration determination kit (Cat. P0011), and protease inhibitor (Cat. P1006) were bought from Beyotime (Shanghai, China). Anti-JAK2 (Cat. AF6022, Lot. 72g9645), antiphosphorylated JAK2 (p-JAK2, Cat. AF3024, Lot. 42j9286), anti-IL6ST (Cat. AF6091, Lot. 47k9566), anti-STAT3 (Cat. AF5205, Lot. 63h9328) and antiphosphorylated STAT3 (p-STAT3, Cat. AF3293, Lot. 89q9402), and anti-β actin (Cat. AF7018, Lot. 56m9799) were obtained from Affinity (Nebraska, USA).
Bioinformatics Analysis
The miRNA-genes interactions were determined by employing multiple bioinformatics analysis tools (including Encori (http://starbase.sysu.edu.cn/), Target(https://www.cancer.gov/about-nci/organization/ccg/research/structural-genomics/tcga), and MiRTarBase (http://bigd.big.ac.cn/databasecommons/database/id/167)), thereby predicting the potential target genes of miR-362-3p. After that, data from the STRING (http://www.string-db.org/) dataset were adopted to establish the PPI network, thereby predicting the signaling pathways that IL6ST involves.
Cell Lines and Cell Culture
143B (Accession: CVCL_2270) and U2OS (Accession: CVCL_0042), 2 kinds of human OS cell lines, were bought from the cell bank of the Chinese Academy of Sciences and were cultured in the 1640 medium containing 10% FBS. The culture medium was renewed once every 2 days, and cells were digested and centrifuged for passage when their coverage was about 80% to 90%.
Cell Experiment Protocol and Cell Transfection
In the present study, according to the procedure of simple randomization, the 143B and U2OS cells were both randomly divided into the following three groups to investigate the effects of miR-362-3p on OS cells by regulating the IL6ST/JAK2/STAT3 pathway, blank control group (BC), normal control group (NC), and overexpression group (OG). Cells in the BC were transfected without anything, and cells in the NC were transfected with the NC mimics, but cells in the OG were transfected with the miR-362-3p mimics. The adopted lentivirus transfectants in this research, including miR-362-3p mimics and NC mimics, were synthesized by Genechem Co., Ltd (Shanghai, China), whose sequences were as follows, 5’-GATTTCTTGGCTTTATATATCTTGG-3’ for miR-362-3p mimics and 5’-TTCTCCGAACGTGTCACGT-3’ for NC mimics. According to the operation instructions, with the help of the Lipofectamine 2000 reagent, the appropriate amount of lentivirus transfectants was cocultured with cells for 96 h to achieve the transfection of miR362-3p mimics and NC mimics.
Cell Viability Assay
In the present study, the CCK-8 was employed to evaluate the cell viability of 143B and U2OS cells. 32 Briefly, 143B and U2OS cells with a concentration of 2 × 10³/well were seeded to 96-well plates. The cell viability of 143B and U2OS cells was determined every 24 h for 96 h after performing the corresponding operation to each group. After the mix solution containing 100 μl culture medium and 10 μl CCK-8 agent replacing the original solution in each well and incubating with 143B and U2OS cells for a further 2 h, the optical density was determined by a microplate reader at 450 nm.
EdU Assay
The EdU assay was performed to determine the cell proliferation ability, whose operation process benefited from the previous study. 33 In short, the 143B and U2OS cells in BC, NC, and OG were transferred into 24-well plates at a density of 5 × 10⁴ cells/well for 24 h incubation. The EdU working solution that is composed of the EdU agent and the culture medium was added for a further 2 h incubation. Then, the 4% paraformaldehyde solution was employed to fix cells, and the PBS solution containing glycine and 0.5% TritonX-100 were adopted to permeabilize cells. After that, the Click-iT mixture was incubated with cells for 30 min at dark at room temperature. The diluted Hoechst 33342 solution was added to counterstain the nucleus for 10 min at dark at room temperature. Finally, the fluorescence of cells was visualized and recorded at 350 nm and 550 nm respectively. The Image J software was used to analyze and calculate the positive rate of EdU in cells in line with the following equation, positive rate = the number of positive nuclei/the number of total nuclei.
Wound Healing Assay
The employed wound healing assay in the present study aimed to determine the migration ability of cells, which was referred from one current report. 34 Generally speaking, after 143B and U2OS cells with a density of 1 × 10⁵ cells/well in BC, NC, and OG were subjected to 6-well plates for incubation, 2 vertical parallel scratches with a space of 1 cm were conducted when cells fully covered the plate. The cells were further cultured with the serum-free medium instead of the original medium for 24 h. The optical microscope (Nikon, Eclipse Ci-L plus) was applied to observe and record the healing state of cells at 0 h and 24 h respectively. The Image J software was used for the quantitative analysis of scratches.
Transwell Invasion Assays
The adopted approaches of Transwell invasion assay in the present study were performed based on one previous study. 35 The 143B and U2OS cells in BC, NC, and OG were transferred into the upper chamber of 24-well plates at a density of 2 × 10⁴ cells/well for incubation with the serum-free medium. The culture medium containing 10% FBS was added to the under chamber of a 24-well plate. The Matrigel precoating was employed to partition the 2 different chambers. After 24 h incubation, cells in the upper chamber were first fixed with 4% paraformaldehyde at room temperature for 15 min and then were stained by crystal violet staining solution for 15 min. The optical microscope (Nikon, Eclipse Ci-L plus) and Image J software were respectively employed to record and analyze the number of cells in the upper chamber.
TUNEL Assays
The TUNEL assay was conducted according to the previous study to determine the apoptosis rate of cells. 36 After the 143B and U2OS cells in BC, NC, and OG were seeded to 24-well plates at a density of 5 × 10⁴ cells/well for 24 h incubation, cells were first fixed by 4% paraformaldehyde and then were permeabilized by PBS solution containing 0.3% Triton X-100. The TUNEL working solution (consisting of 5μl TdT enzyme and 45μl fluorescent labeling solution) was incubated with cells for 1 h at dark at 37°C. The fluorescence microscope (Molecular Devices, Molecular Devices Spectra MAX Plus 384) was employed to observe all cells and differentiate the positively stained ones with red fluorescence. The Image J software was applied to count the number of positively stained cells.
Animals, Animal Experiment Protocol, and Subcutaneous Xenograft Model
All 25 three-week-old immunodeficient nu/nu male mice (9-16 g) were provided by the Experimental Animal Center of Southern Medical University, randomly divided into 5 cages, and fed under the free accession to water and food with a light-dark alteration of 24 h. We made efforts to minimize the number of animals utilized and to decrease their suffering. The location of animals and cages was unchanged until all experiments were finished to minimize potential confounders. All adequate care was followed by the “Guide for the Care and Use of Laboratory Animals, eighth Edition.” 37 All experimental animals’ operating procedures were approved by the Ethics Committee of Southern Medical University (ethical code: LAEC-2022-012). Due to the superior tumor-forming ability of 143B cells, the subsequent studies were investigated based on the subcutaneous injection of 143B cells in nude mice.38 The 100 μl suspension of 143B cells at a density of 1 × 10⁷ per ml was injected into the subcutaneous tissue in the junction between the forelimbs and the back of mice to establish the subcutaneous xenograft model. 39 According to the procedure of simple randomization, all mice for the subsequent studies were randomly divided into three groups (including BC, NC, and OG) because the 143B cells injected into mice were from 3 different groups (n = 6). For ARRIVE: the reporting of this study conforms to ARRIVE 2.0 guidelines. 40
Tumor Volume Detection
After the 143B cells were subcutaneously injected into nude mice, all mice were fed in normal conditions. The longest diameter and the shortest diameter of the tumor were measured and recorded from day 6 every 3 days until day 18. The tumor volume was calculated in the light of the following equation, tumor volume = [the longest diameter/(the shortest diameter)2]/2. After the last time to measure the tumor volume on day 18, the tumor was completely separated from the mice and photographed. The tumor tissue was harvested from mice that were anesthetized with pentobarbital sodium (50 mg/kg) and with euthanasia and adopted for the subsequent studies.
H&E Staining
The isolated tumor tissue was first fixed in 4% paraformaldehyde and then embedded in paraffin wax. After the tumor tissue was further sliced into 4 μm-thick sections, all sections were stained with hematoxylin for 5 min and counterstained with 0.5% eosin for 1 min and finally were subjected to the optical microscope (Nikon, Eclipse Ci-L plus) for observation.
Immunohistochemical Staining
The 4 μm-thick sections were first dewaxed by adopting dimethylbenzene. After the antigen in dewaxed slices was repaired by citric acid buffer at high temperature, 3% hydrogen peroxide solution and PBS buffer containing 10% goat serum were respectively adopted to eliminate the endogenous enzymes and prevent the non-specific adsorption. The slices were then incubated with primary antibodies, including anti-IL6ST, anti-JAK2, anti-p-JAK2, anti-STAT3, and anti-p-STAT3, for one night at 4°C, and were further incubated with corresponding secondary antibodies for 30 min at 37°C. After the positively stained parts were successfully colored with the DAB solution, the slices were counterstained with hematoxylin. The slices were finally observed by using the optical microscope (Nikon, Eclipse Ci-L plus).
QRT-PCR
The total RNAs in 143B and U2OS cells were extracted by adopting the Trizol agent. The PrimeScript™ RT reagent Kit with gDNA Eraser and SYBR Green™ Premix Ex Taq™ II were respectively adopted to reversely transcribe extracted RNAs into cDNAs and achieve the amplification of cDNA. The real-time fluorescence quantitative PCR system was used to determine the relative expression level of miR362-3p, SLC6A6, IL6ST, JAK2, STAT3, U6, and GAPDH, among which U6 is the internal reference gene of miR362-3p and GAPDH is the internal reference gene of SLC6A6, IL6ST, JAK2, and STAT3. The relative expression level of all genes was calculated by using the 2−ΔΔCt approach. The primer sequence of all genes for qRT-PCR is listed in Table 1.
The Primer Sequence of All Genes for qRT-PCR.

Western-Blot
With the help of the RIPA agent and BCA kit, the total proteins of 143B and U2OS cells were extracted and quantified. After the total proteins were denatured in the boiling water, the total proteins were loaded into the sodium dodecyl sulfate-polyacrylamide gel and segregated by electrophoresis. Next, proteins were transferred into the PVDF membrane from the gel, and the membrane was incubated with skimmed milk for 1 h to prevent the nonspecific combination. After that, the membrane was immersed in the primary antibodies, including anti-IL6ST (1: 1000), anti-JAK2 (1: 1000), anti-p-JAK2 (1: 2000), anti-STAT3 (1: 1000), and anti-p-STAT3 (1: 2000), for one night at 4°C, and was further incubated with corresponding secondary antibodies for 2 h at room temperature. The protein blots were further observed in the hypersensitive chemiluminescence imager after the membrane was incubated with the ECL luminescent solution. The Image J software was employed to analyze the grayscale value of protein blots.
Statistical Analysis
All experiments in vivo and in vitro were repeated three times. For the in vivo experiments, the data that were generated from mice with obvious OS tissue were included, and the data that were generated from mice without obvious OS tissue were excluded. For the in vitro experiments, all generated data were included for the statistical analysis. The experimental data were analyzed by employing the SPSS 22.0 software, expressed in the form of mean ± standard deviation, and presented in the form of a figure. After the Shapro-Wilk testing was employed to determine the normal distribution of data, the least significant difference test was used for pairwise comparisons between multiple groups. P < 0.05 means significant statistical differences.
Results
Prediction of the Potential Target Genes of miR-362-3p and Potential Signaling Pathway of IL6ST
After predicting, analyzing, and screening the potential target genes of miR-362-3p generated from the related websites for bioinformatics analysis, we discovered two public potential target genes of miR-362-3p, namely IL6ST and SLC6A6 (Figure 1A). After that, the expression level of IL6ST and SLC6A6 was determined by adopting the qRT-PCR approach after miR-362-3p mimics were transfected. As the results showed, compared with 143B and U2OS cells in NC, the expression level of IL6ST of 143B and U2OS cells in OG was prominently down-regulated but not SLC6A6 (Figure 1C and D). Therefore, IL6ST was selected as the target gene for the subsequent studies and multiple pathways that IL6ST may participate in regulation were further predicted by adopting the STRING dataset. By comparing the value of the false discovery rate, the JAK/STAT signaling pathway with the minimum false discovery rate was selected for the subsequent research (Table 2). According to the predicted results, the IL6ST/JAK2/STAT3 pathway was selected to investigate the effects of miR-362-3p on OS in vivo and in vitro (Figure 1B).
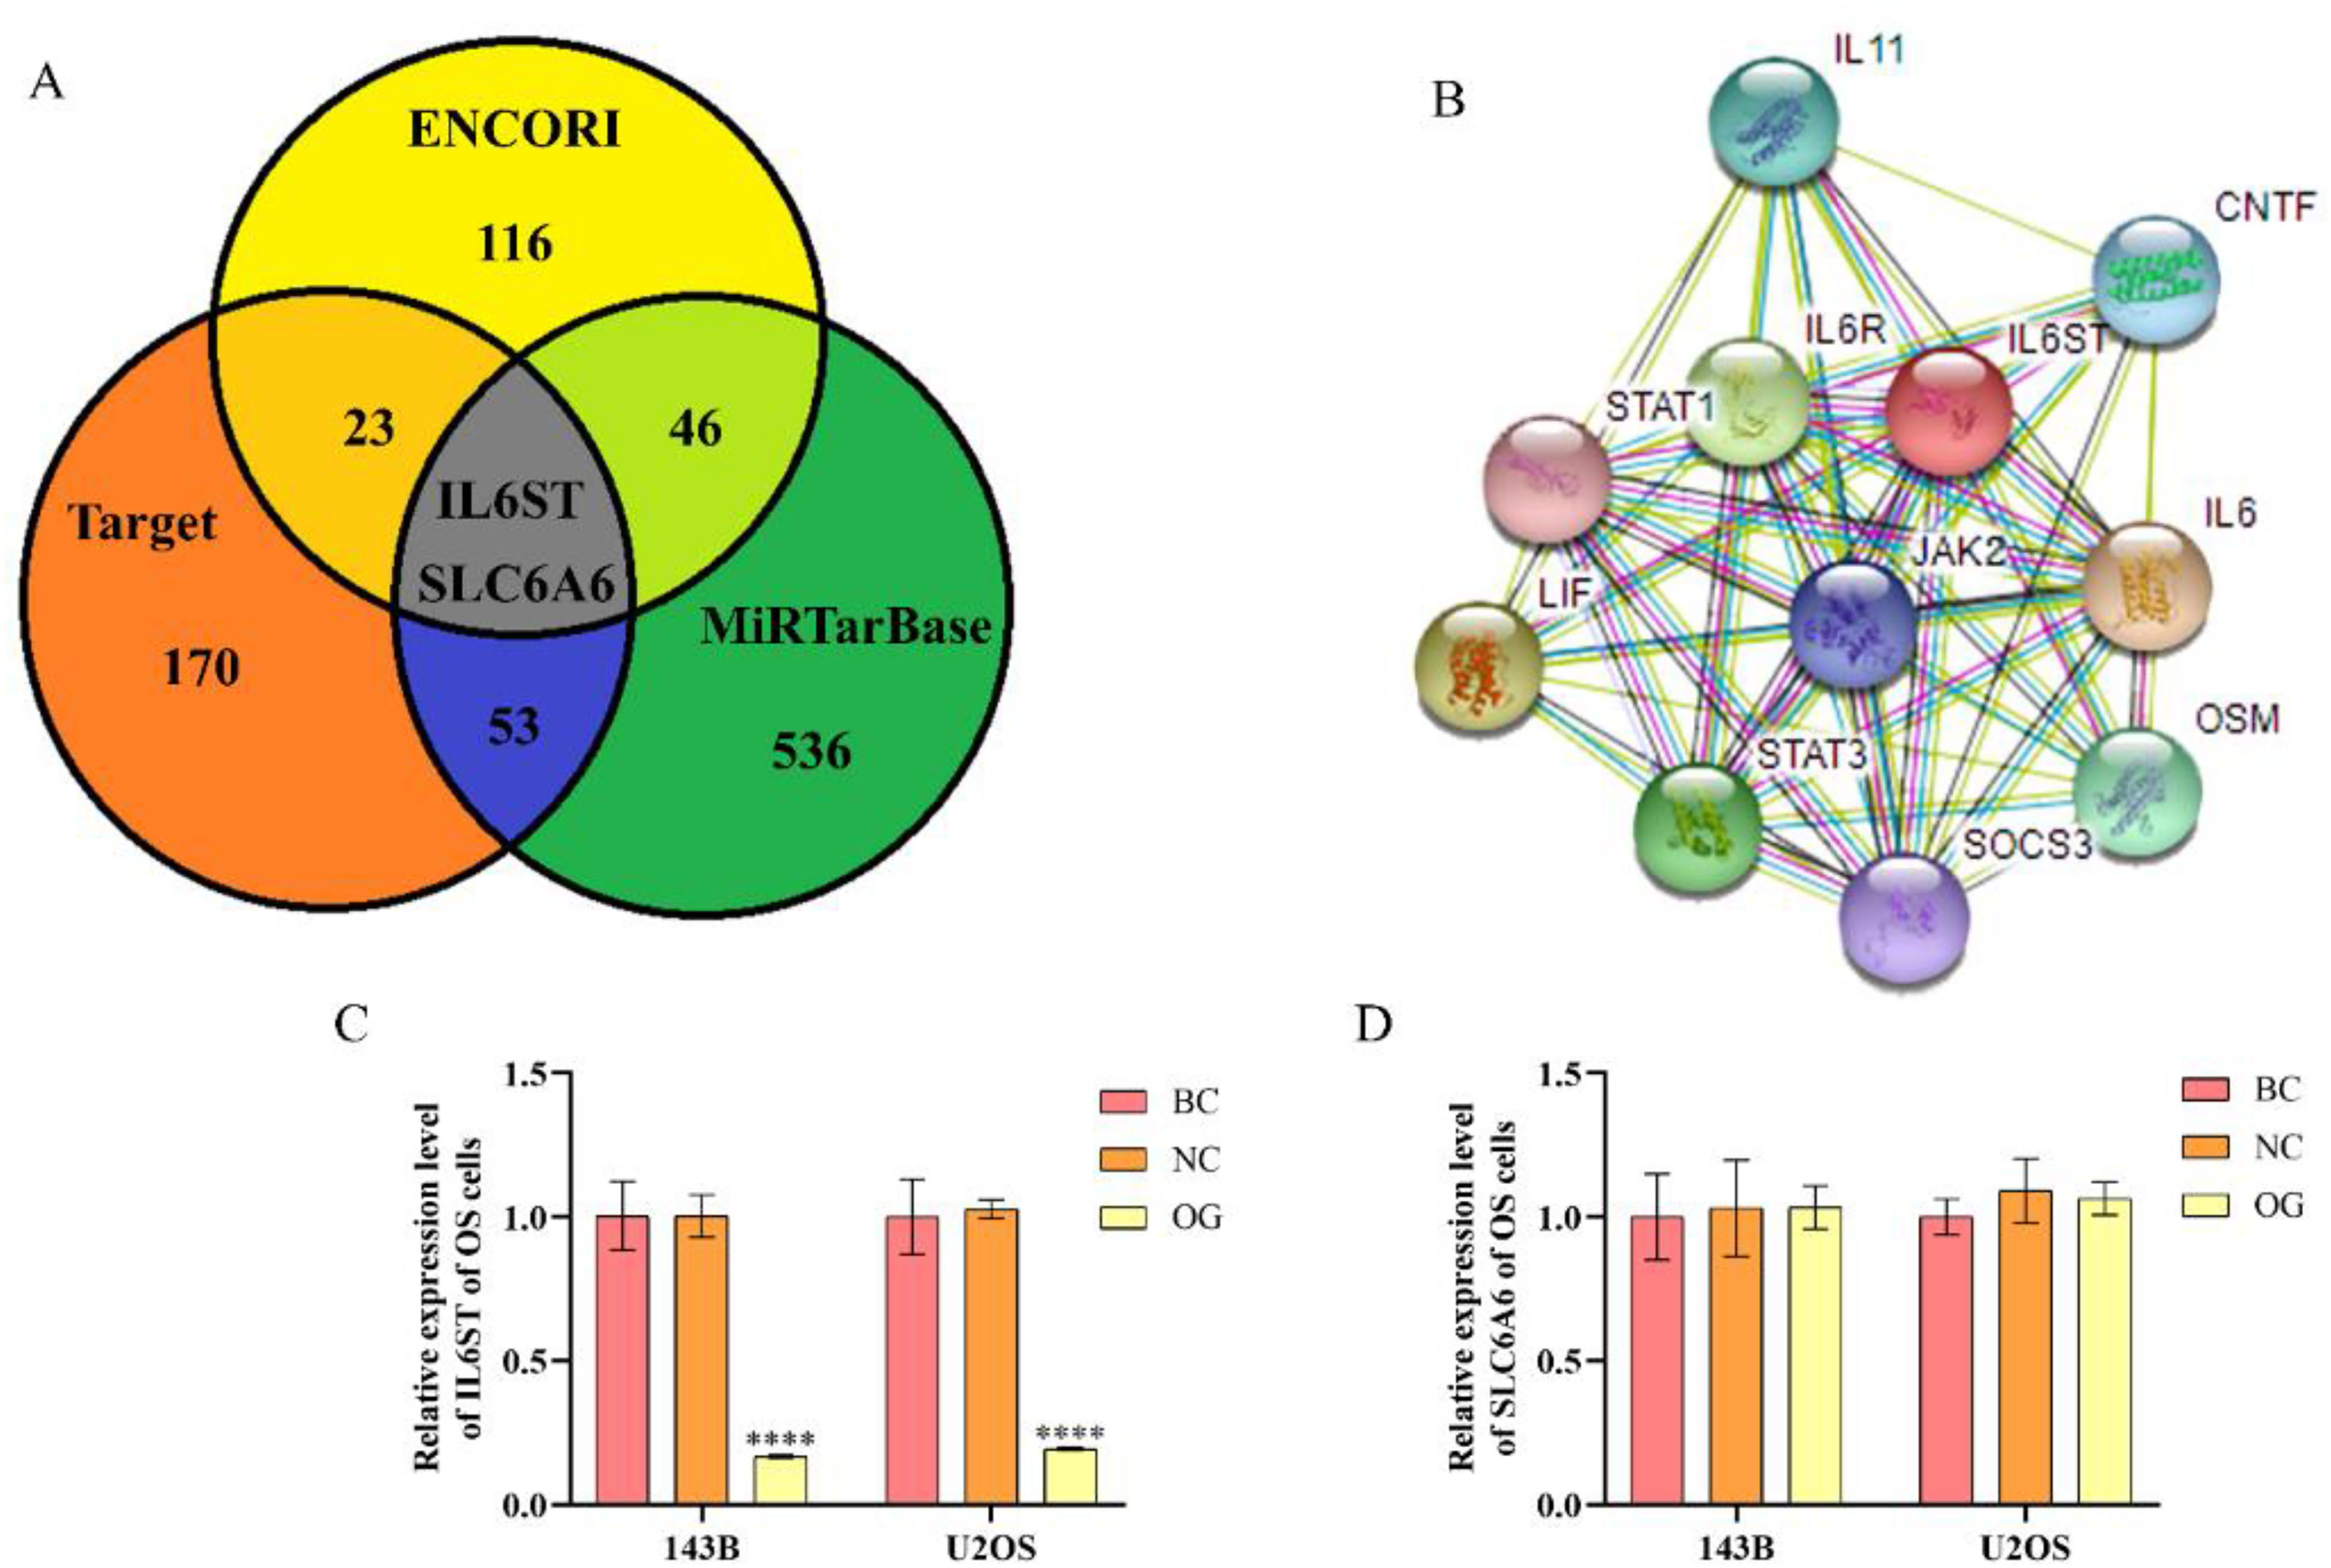
Predicted results by employing bioinformatics analysis approaches. (A) The Venn diagram for the potential target genes of miR-362-3p. (B) The signaling pathways that IL6ST may involve. (C) The relative gene expression level of IL6ST in 143B and U2OS cells. (D) The relative gene expression level of SLC6A6 in143B and U2OS cells. ****P < 0.0001, compared with NC.
The Signaling Pathways That may be Related to IL6ST.

Effects of miR-362-3p on the Cell Viability of OS Cells
The previous studies suggested that there was a significant inhibitory effect of miR-362-3p on the cell viability of ovarian carcinoma, renal carcinoma, and cervical carcinoma.8,12,13 To determine the inhibitory effect of miR-362-3p on the cell viability of OS cells and the optimal transfection time of miR-362-3p, the CCK-8 was adopted to determine the cell viability of 143B and U2OS cells every 24 h after miR-362-3p mimics were transfected until 96 h. Within the 96 h of transfection, there was no significant difference between BC and NC of 143B and U2OS cells. The disparity in cell viability of 143B and U2OS cells between OG and NC gradually enlarged over time. At 96 h, the cell viability of 143B and U2OS cells in OG was significantly lower than those in NC (Figure 2A and B). Therefore, the transfection with 96 h was selected for the subsequent studies.
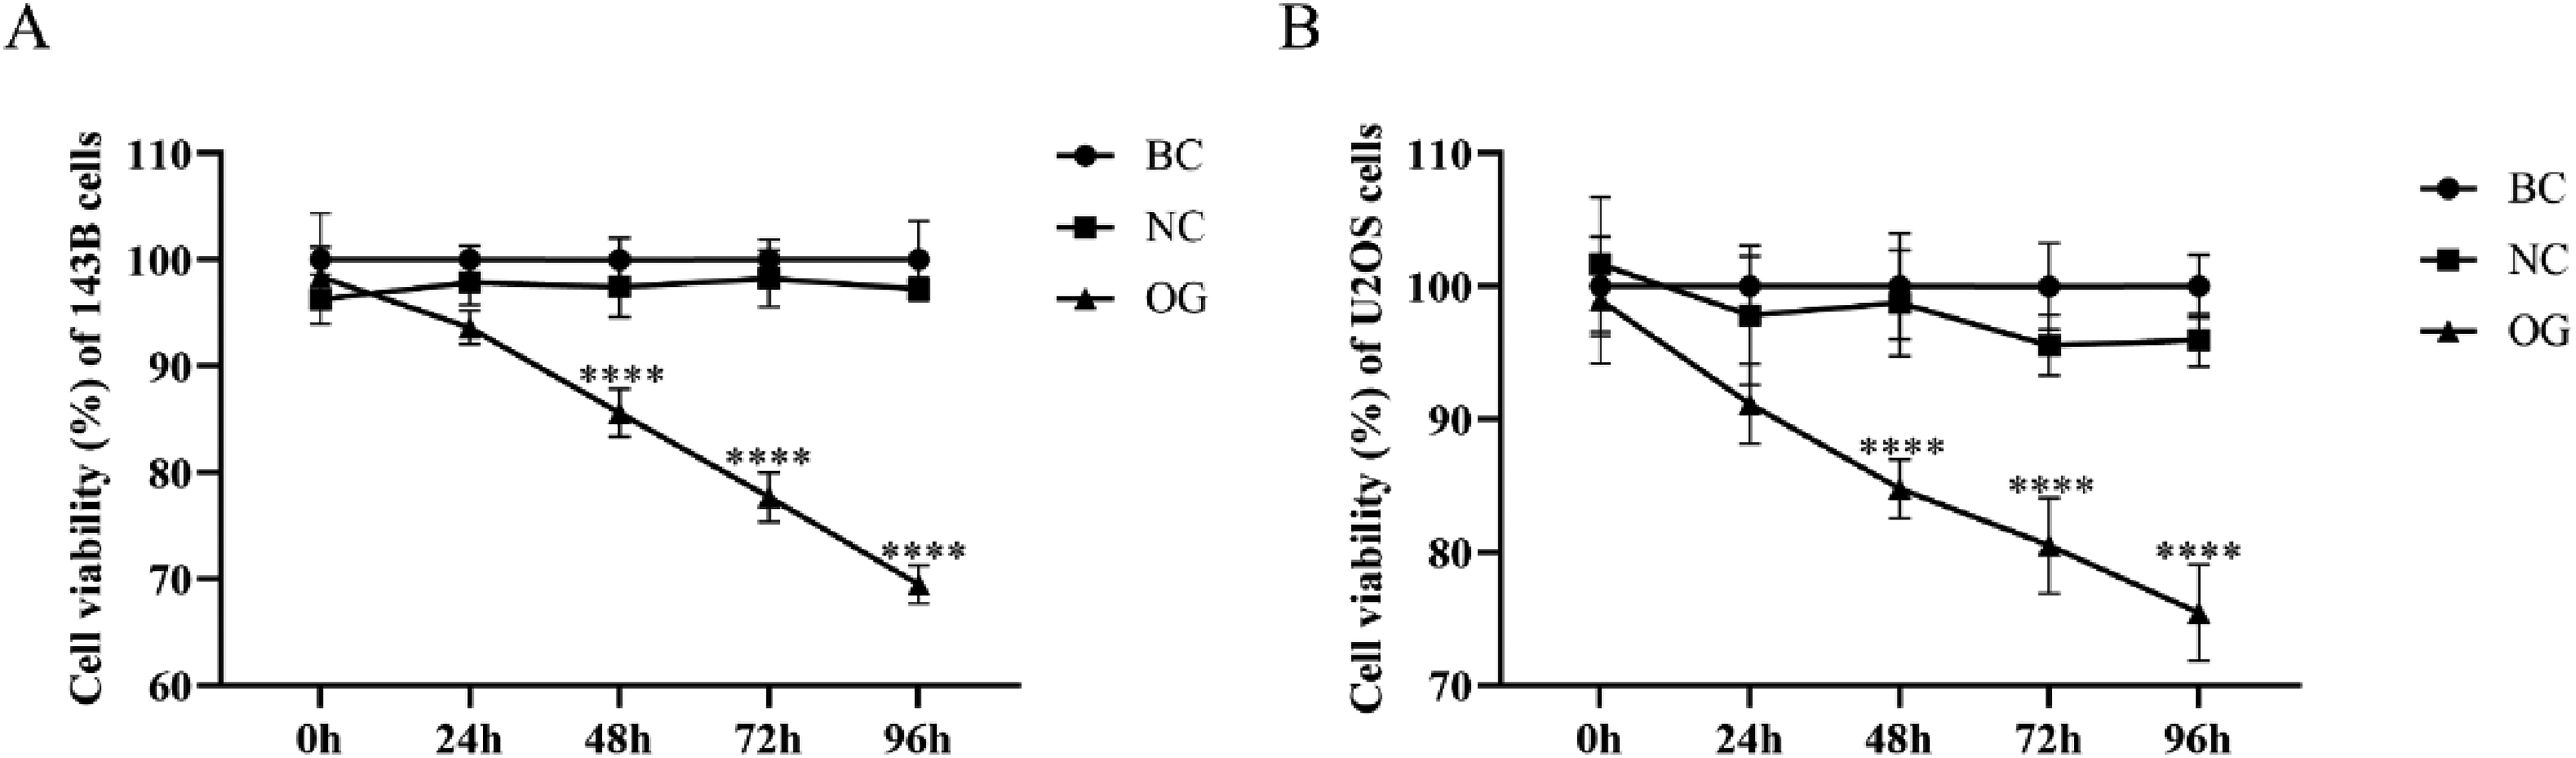
Effects of miR-362-3p on the cell viability of OS cells. (A) Effects of miR-362-3p mimics on the cell viability of 143B cells within 96 h. (B) Effects of miR-362-3p mimics on the cell viability of U2OS cells within 96 h. ****P < 0.0001, compared with NC.
Validation for the Transfection of miR-362-3p Mimics
After the total RNAs of 143B and U2OS cells in BC, NC, and OG were extracted, the expression level of miR-362-3p was determined to validate whether miR-362-3p mimics were successfully transfected into OS cells. It was discovered that there was no significant difference between BC and NC in the expression level of miR-362-3p of 143B and U2OS cells. Meanwhile, the expression level of miR-362-3p of 143B and U2OS cells in OG was dramatically up-regulated compared with that in NC (Figure 3A and B). The above results indicated that miR-362-3p mimics were successfully transfected into 143B and U2OS cells.
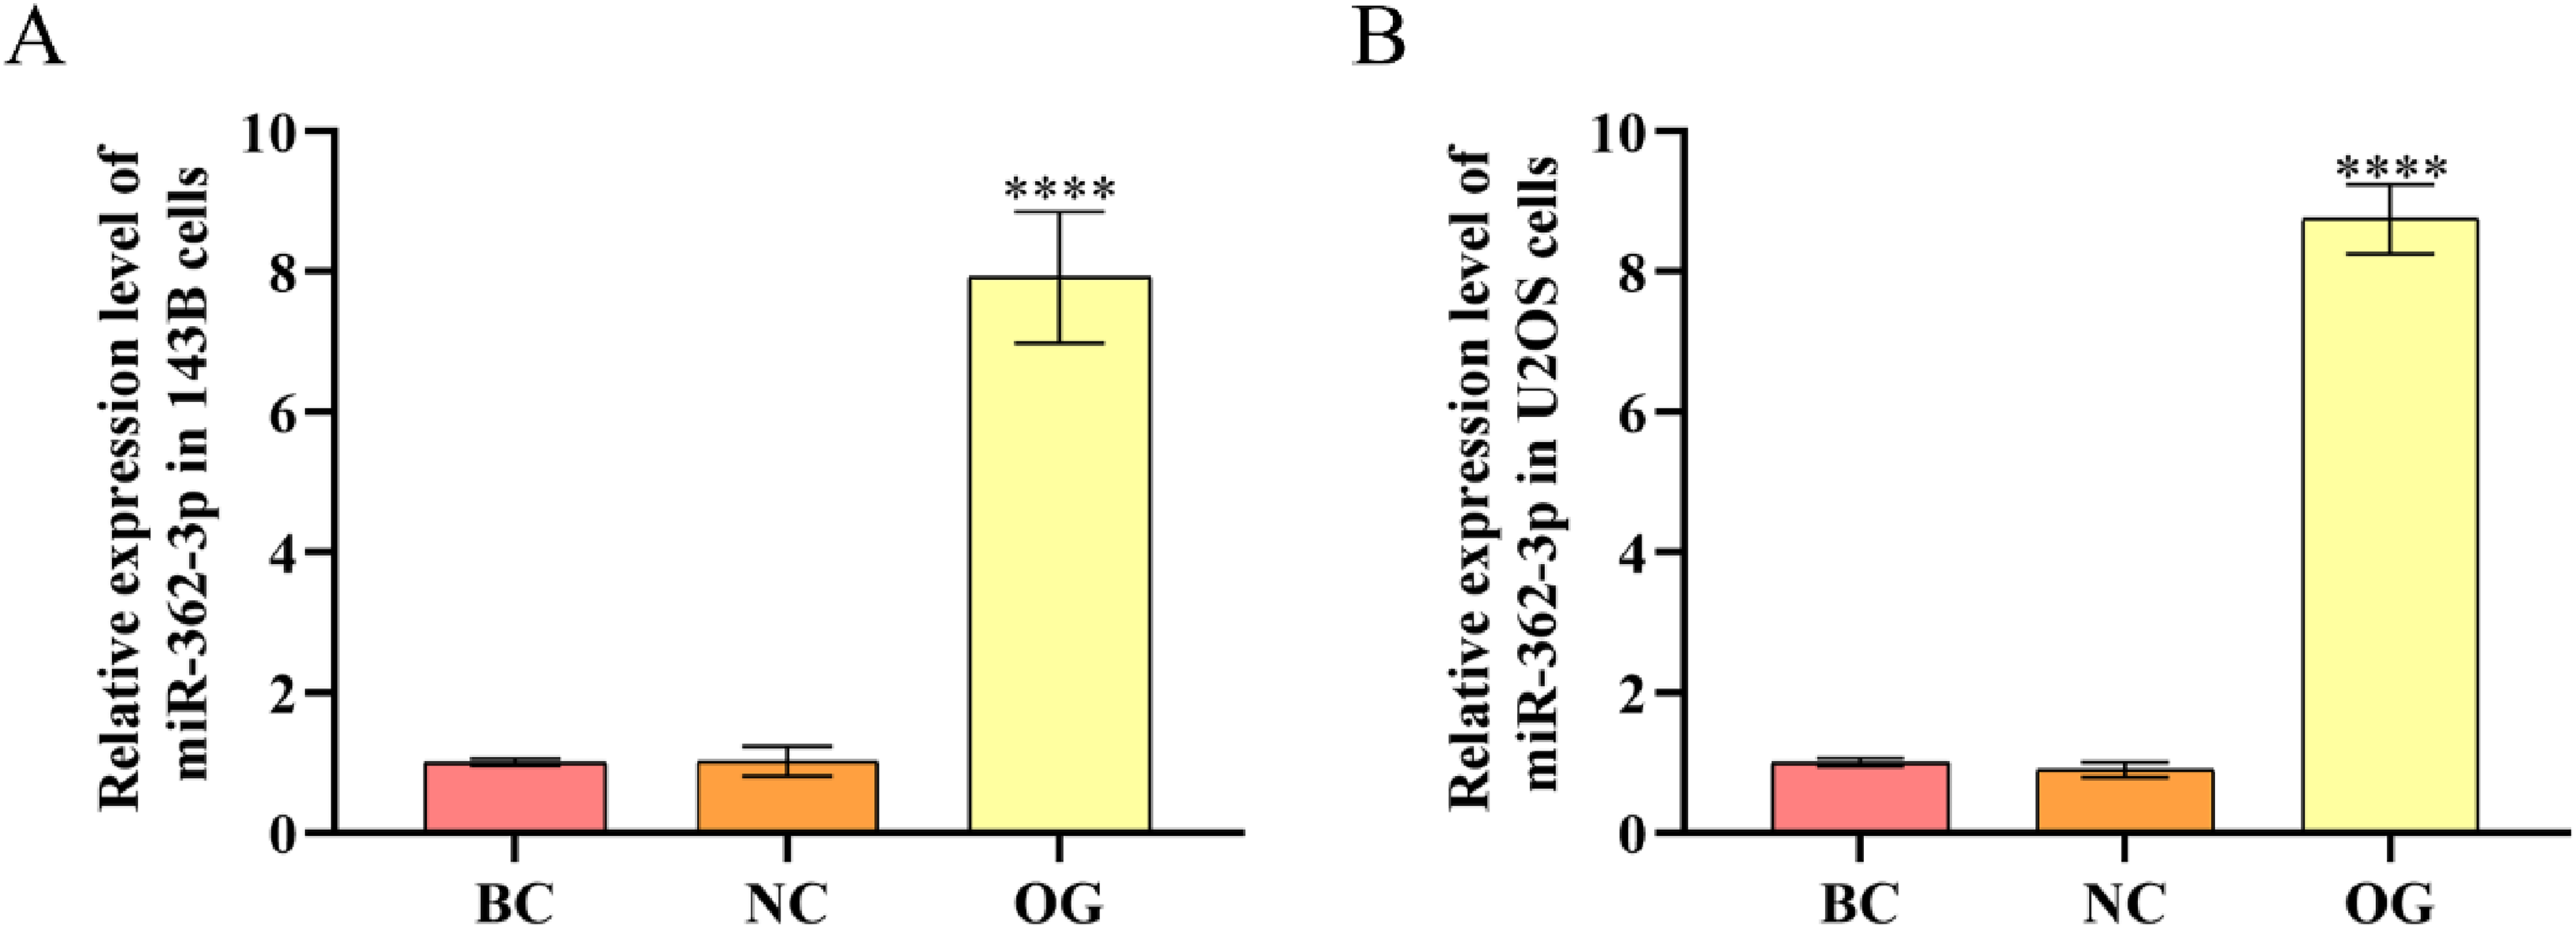
Validation for the transfection of miR-362-3p mimics. (A) The relative expression level of miR-362-3p in 143B cells. (B) The relative expression level of miR-362-3p in U2OS cells. ****P < 0.0001, compared with NC.
Effects of miR-362-3p on the Proliferation of OS Cells
After determining the optimal transfection time of miR-362-3p mimics, the effects of miR-362-3p on the proliferation of 143B and U2OS cells were further detected. There was no significant difference in the number of positive EdU-stained 143B and U2OS cells between BC and NC. However, compared with the NC, the number of positive EdU-stained 143B and U2OS cells in OG was less (Figure 4A to D). The above results proved that overexpressed miR-362-3p reduced the proliferation of 143B and U2OS cells.

Effects of miR-362-3p on the proliferation of OS cells. (A) Fluorescence results of 143B cells stained by EdU (200×). (B) Fluorescence results of U2OS cells stained by EdU (200×). (C) Quantitative analysis results for the ratio of positive Edu-stained 143B cells. (D) Quantitative analysis results for the ratio of positive Edu-stained U2OS cells. ****P < 0.0001, compared with NC.
Effects of miR-362-3p on the Migration of OS Cells
To further investigate the effects of miR-362-3p on the migration of OS cells, the wound healing assay was performed. As the plate scratches and quantitative analysis showed (Figure 5A to D), there was no significant difference between BC and NC. The width of plate scratches at 24 h of 143B and U2OS cells in OG was dramatically larger than those in NC. It was thus clear that overexpressed miR-362-3p reduced the migration of OS cells.
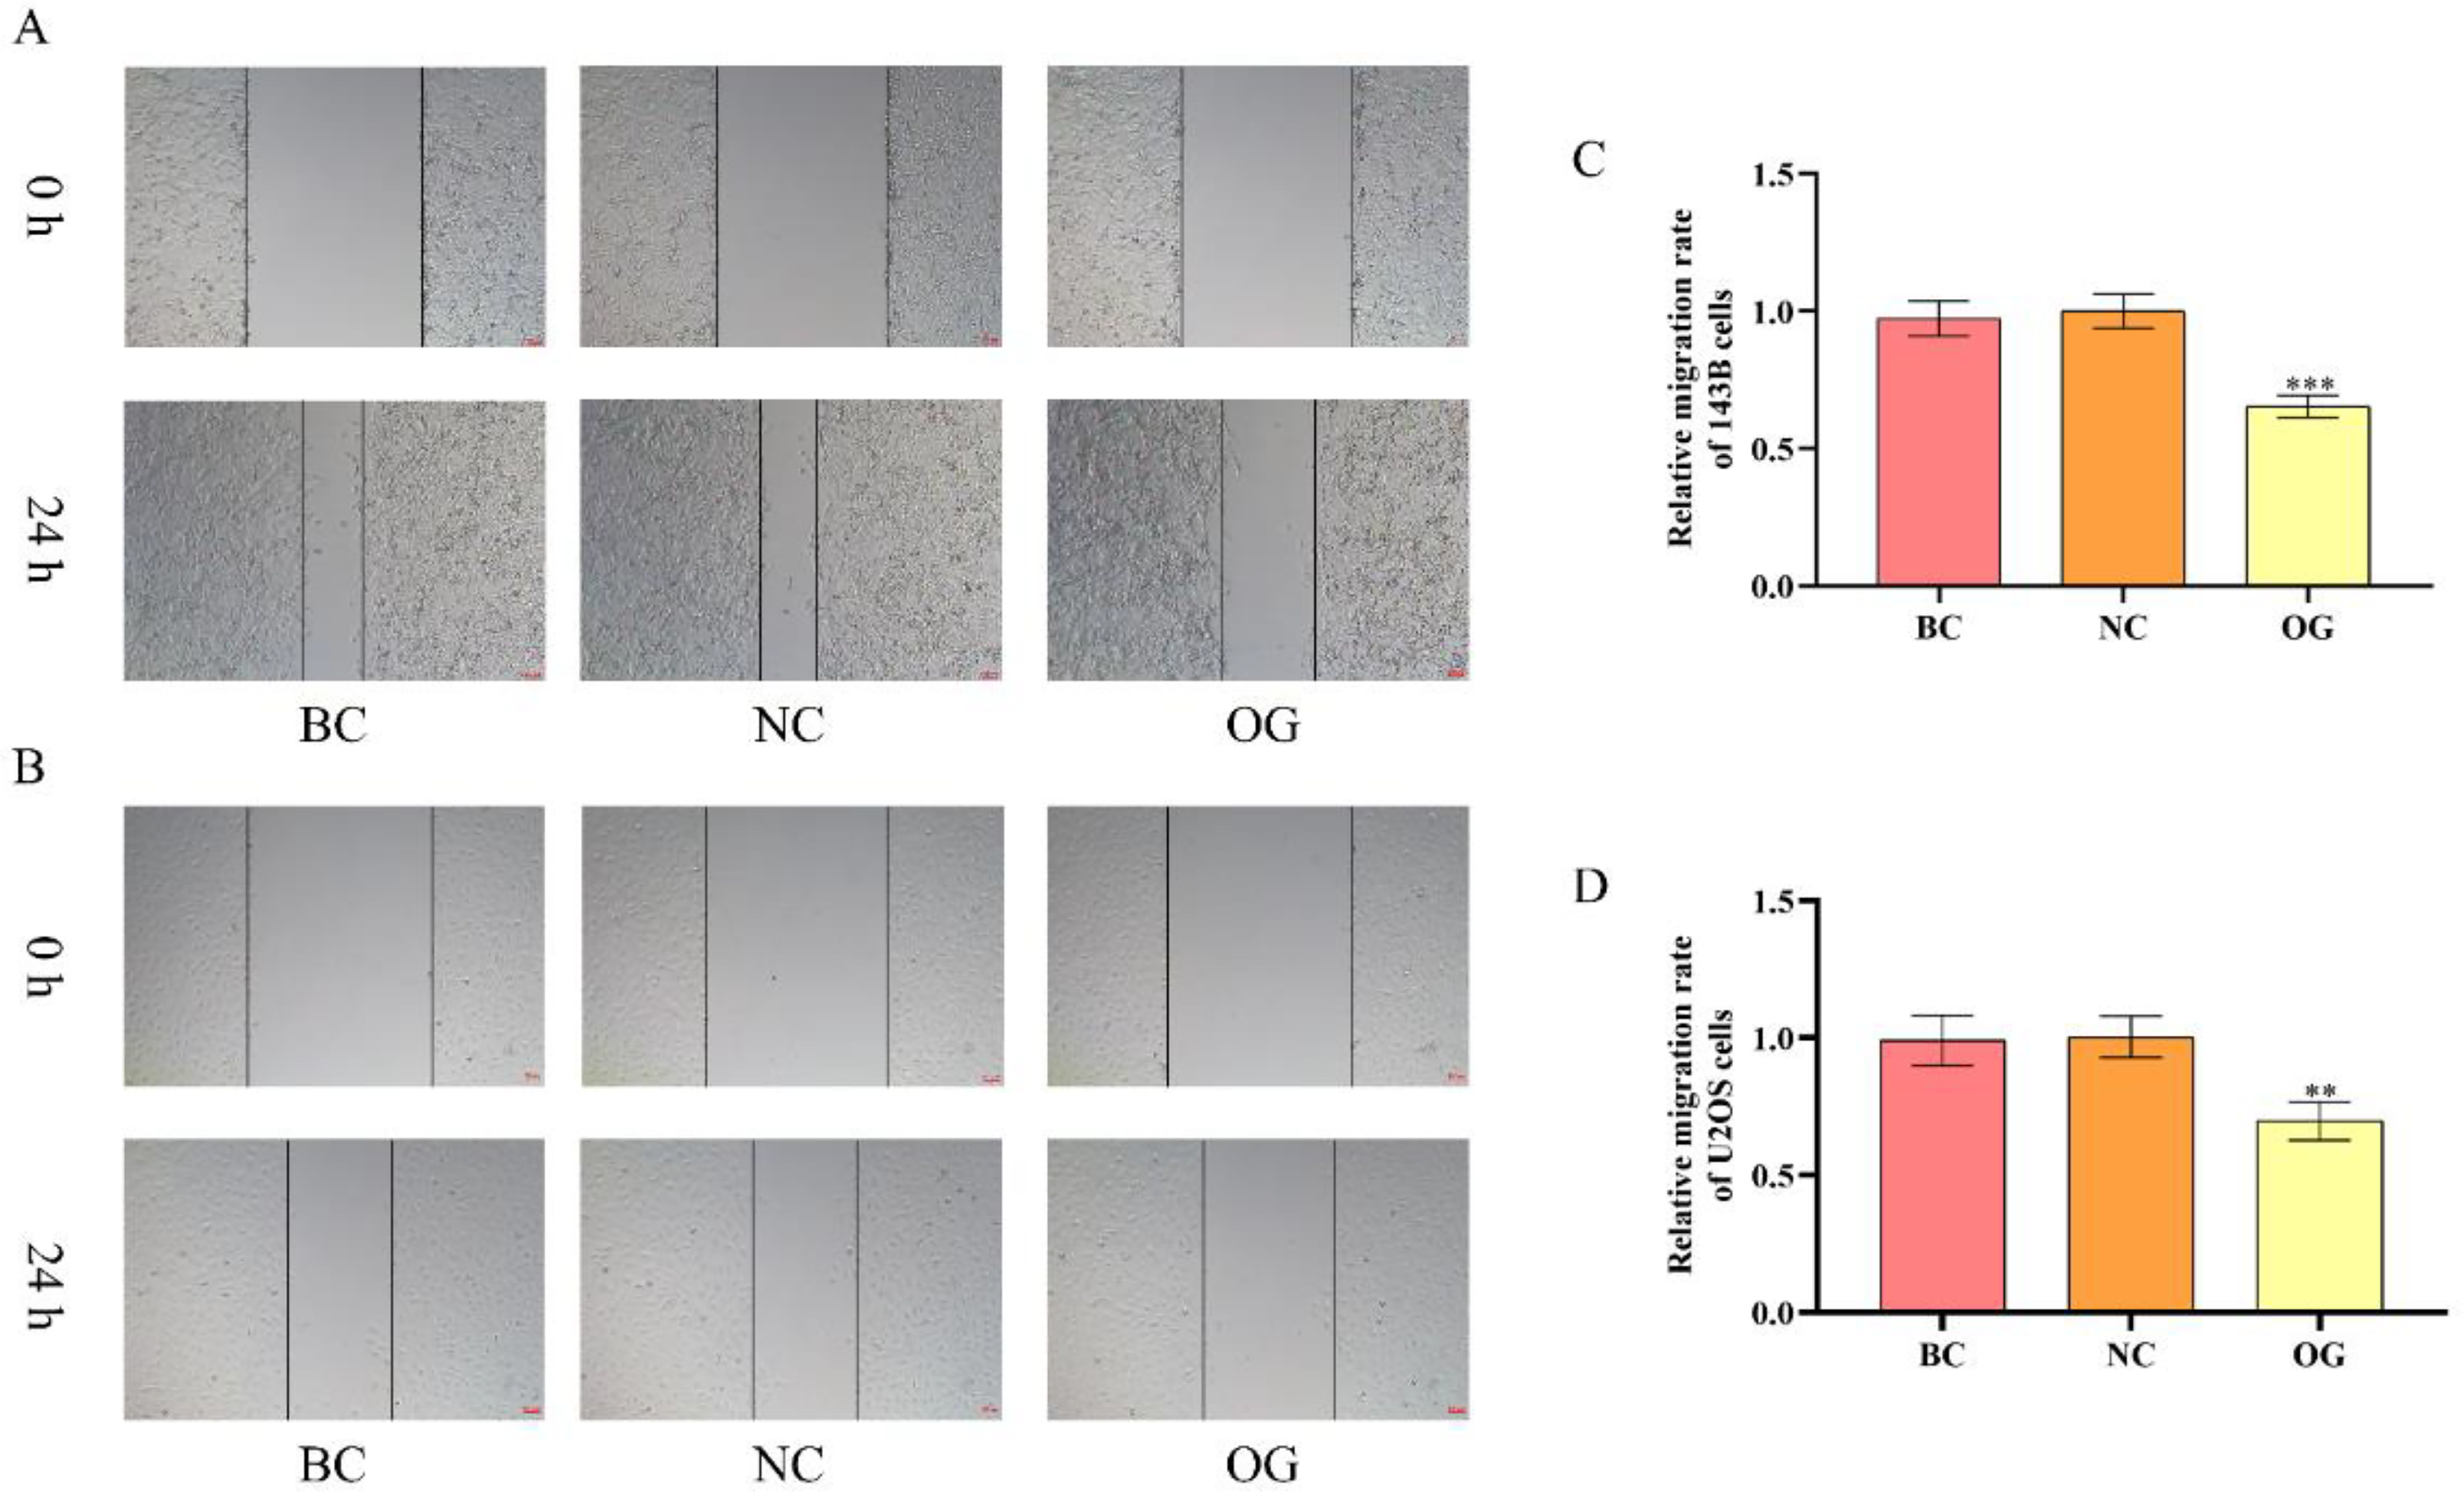
Effects of miR-362-3p on the migration of OS cells. (A) Plate scratches results of 143B cells at 0 h and 24 h (200×). (B) Plate scratches results of U2OS cells at 0 h and 24 h (200×). (C) The relative migration rate of 143B cells. (D) The relative migration rate of U2OS cells. ***/**P < 0.001/0.01, compared with NC.
Effects of miR-362-3p on the Invasion of OS Cells
Except for investigating the effects of miR-362-3p on the migration of OS cells, we further adopted the Transwell experiments to determine the effects of miR-362-3p on the invasion ability of OS cells. As the results illustrated, the transferred number of 143B and U2OS cells in NC was similar to that in BC but was prominently larger than that in OG (Figure 6A to D). The above results indicated that the overexpression of miR-362-3p also declined the invasion ability of OS cells.
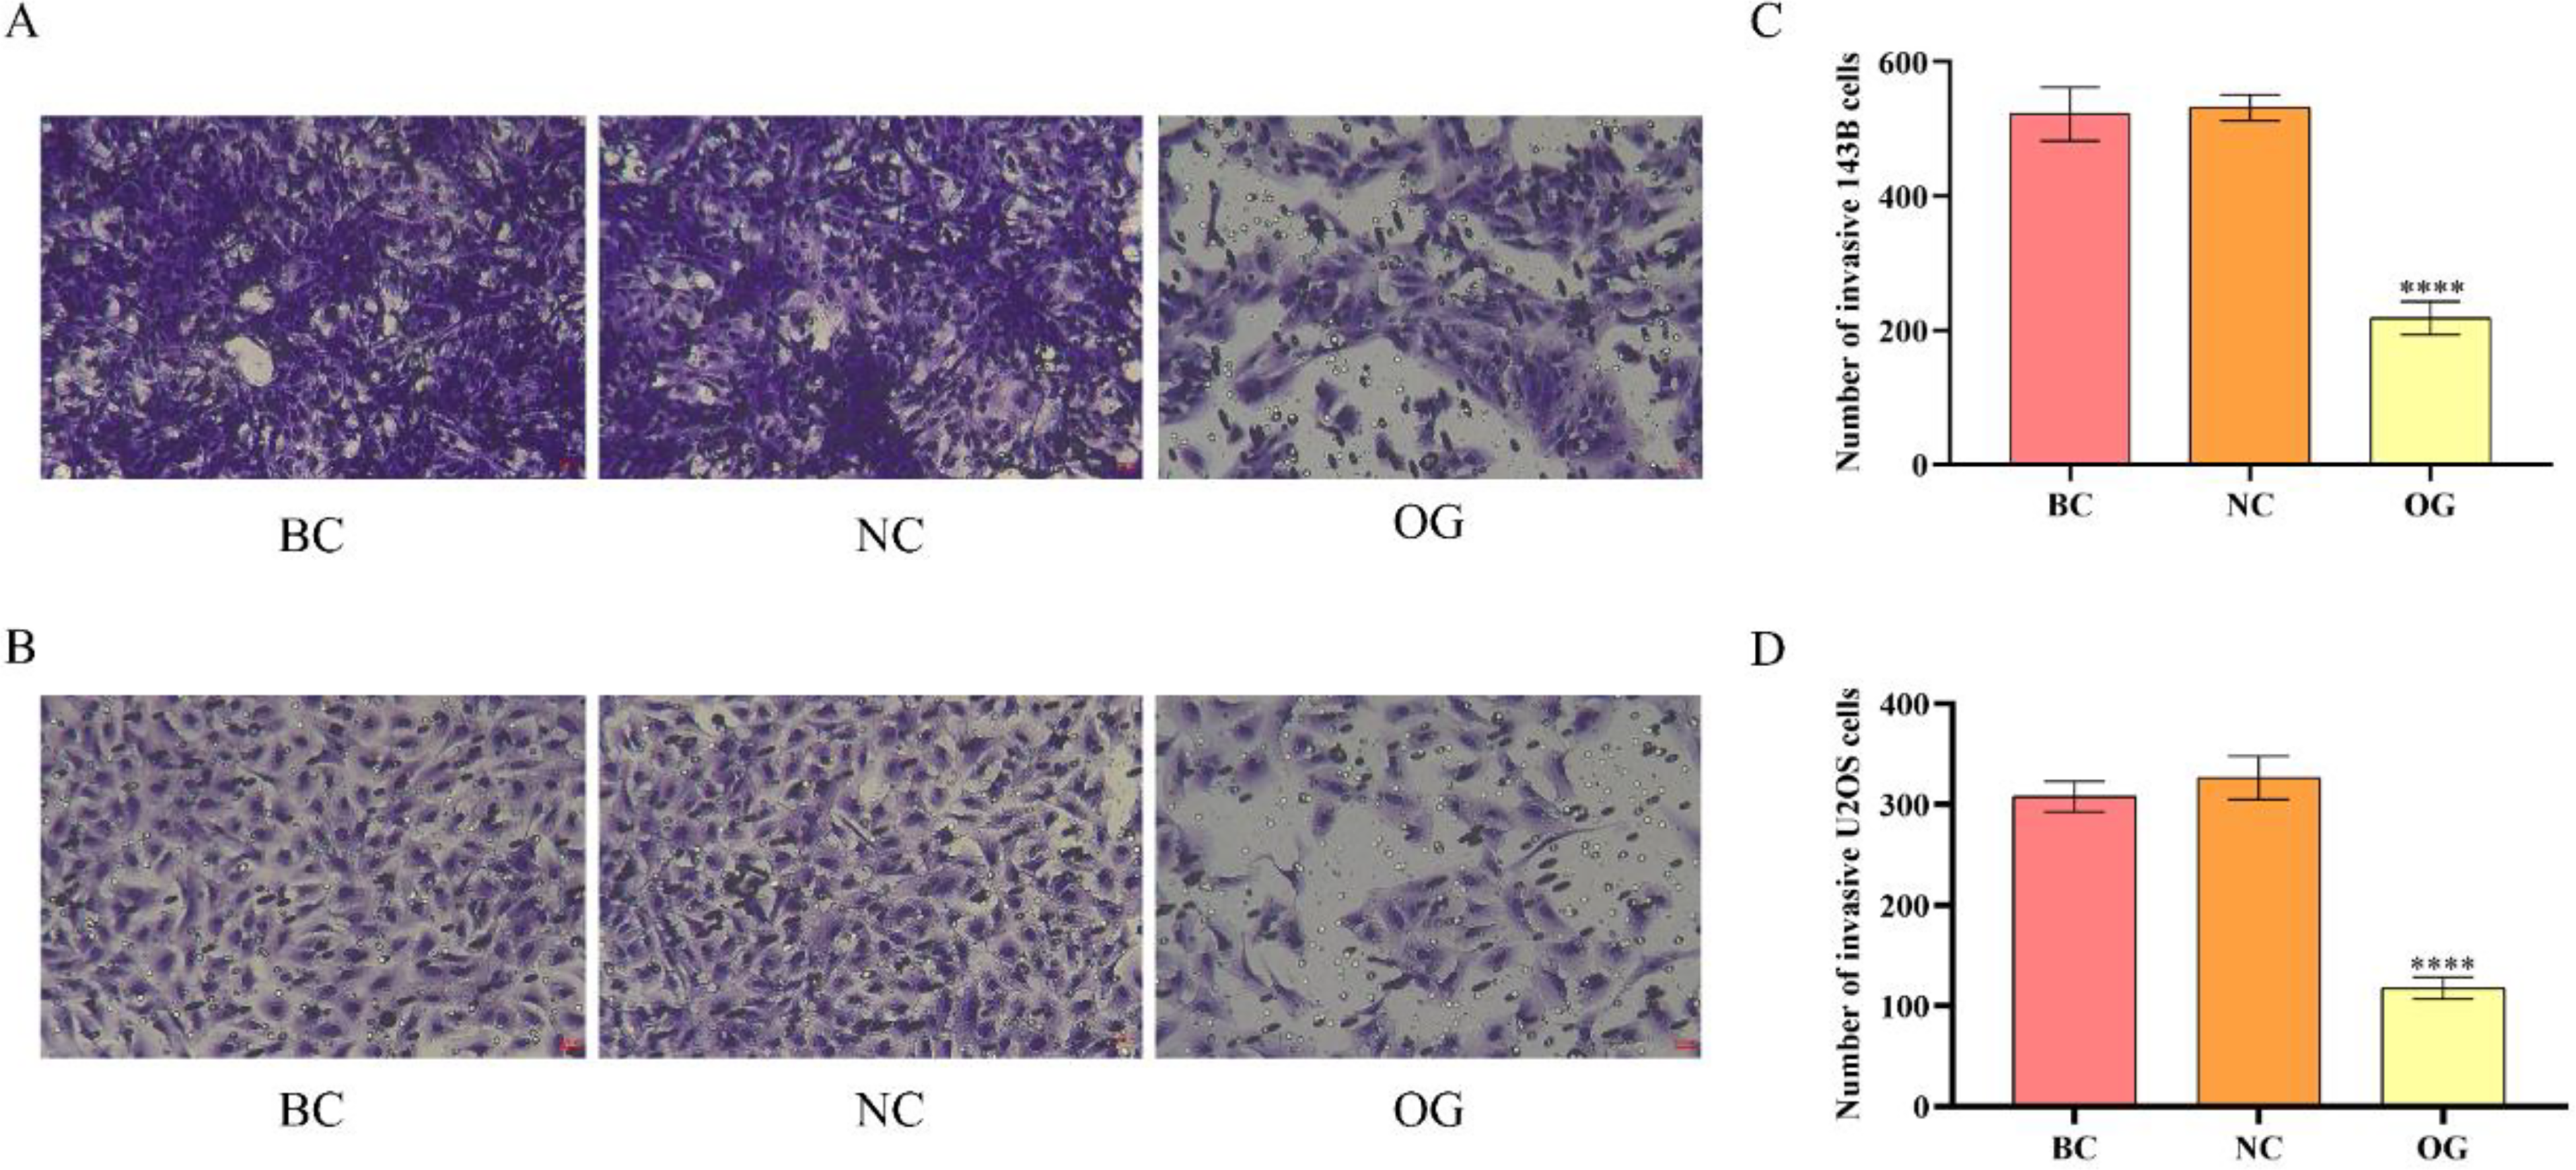
Effects of miR-362-3p on the invasion of OS cells. (A) Results of Transwell experiments of 143B cells (200×). (B) Results of Transwell experiments of U2OS cells (200×). (C) Quantitative analysis results for the number of transferred 143B cells. (D) Quantitative analysis results for the number of transferred U2OS cells. ****P < 0.0001, compared with NC.
Effects of miR-362-3p on the Apoptosis of OS Cells
In the present study, the TUNEL staining approach was employed to determine the effects of miR-362-3p on the apoptosis of OS cells. There was no significant difference in apoptosis of 143B and U2OS cells between BC and NC. Compared with the 143B and U2OS cells in NC, there were prominently more positive TUNEL-stained cells in OG (Figure 7A to D). The above results proved that the overexpression of miR-362-3p promoted the apoptosis of OS cells.

Effects of miR-362-3p on the apoptosis of OS cells. (A) Fluorescence results of 143B cells stained by TUNEL (200×). (B) Fluorescence results of U2OS cells stained by TUNEL (200×). (C) Quantitative analysis results for the apoptosis rate of 143B cells. (D) Quantitative analysis results for the apoptosis rate of U2OS cells. ****P < 0.0001, compared with NC.
Effects of miR-362-3p on the Growth of OS
After the 143B cells in BC, NC, and OG were respectively subcutaneously injected into mice, the growth status of subcutaneous tumors in mice was observed, measured, and recorded daily. Once the protrusion of tumors was observed on the fifth day after the subcutaneous injection, the longest and the shortest diameters were recorded to calculate the tumor volume every three days. As time went on, the difference in tumor volume between NC and OG gradually enlarged (Figure 8B). On the eighteenth day after subcutaneous injection, the tumors were isolated from mice. It was obvious that the tumor volume of OG was smaller than that of NC (Figure 8A). The above results suggested that the overexpression of miR-362-3p suppressed the growth of OS in vivo.

Effects of miR-362-3p on the growth of OS cells. (A) The image of tumors isolated from mice on the 18th day after the subcutaneous injection. (B) The changing trends of tumor volume from the 6th day to the 18th day after the subcutaneous injection. ****/***/*P < 0.0001/0.001/0.05, compared with NC.
Effects of miR-362-3p on the Histopathological Damage of OS
Out of the restrictive effect of miR-362-3p mimics on the growth of OS, we next applied the H&E staining approach to further investigate the effects of miR-362-3p on the histopathological damage of OS. The degree of karyopyknosis and chromatin deepening of tissue in BC and NC was similar but was milder than those in OG (Figure 9). The above results affirmed that overexpressed miR-362-3p effectively aggravated the histopathological damage to facilitate the necrocytosis of OS.

Images of H&E staining for the investigation of miR-362-3p on the histopathological damage of OS cells (200×).
Effects of miR-362-3p on the IL6ST/JAK2/STAT3 Pathway of OS
In vitro and in vivo, we respectively adopted qRT-PCR, Western bot, and immunohistochemical (IHC) approaches to investigate the effects of miR-362-3p on the IL6ST/JAK2/STAT3 pathway of OS by determining the expression level of genes and proteins. In vitro, the results of qRT-PCR and Western blot suggested that the transfection of miR-362-3p prominently suppressed the expression level of multiple genes (including IL6ST, JAK2, and STAT3) and proteins (IL6ST, p-JAK2, JAK2, p-STAT3, and STAT3) of 143B and U2OS cells compared with those in NC (Figure 10A-G). In vivo, we employed the IHC approach to determine the protein expression level of OS tissue. It was demonstrated that there was no significant variation in the positively stained area of OS tissue between BC and NC. The positively stained area of OS tissue in OG was significantly reduced compared with those of OS tissue in NC (Figure 11A-F). It was indicated that the expression level of various proteins (including IL6ST, JAK2, p-JAK2, STAT3, and p-STAT3) in the tissue of OG was dramatically downregulated compared with those in the OS tissue of NC. All in all, the overexpression of miR362-3p alleviates OS by inhibiting the IL6ST/JAK2/STAT3 pathway in vivo and in vitro.

Effects of miR-362-3p on the IL6ST/JAK2/STAT3 pathway of OS cells in vitro. (A) The relative gene expression level of the IL6ST in 143B and U2OS cells. (B) The relative gene expression level of the JAK2 in 143B and U2OS cells. (C) The relative gene expression level of the STAT3 in 143B and U2OS cells. (D) The images of protein blots of 143B cells. (E) The images of protein blots of U2OS cells. (F) The relative expression level of diverse proteins (including IL6ST, JAK2, p-JAK2, STAT3, p-STAT3) in 143B cells. (G) The relative expression level of diverse proteins (including IL6ST, JAK2, p-JAK2, STAT3, p-STAT3) in U2OS cells. ****P < 0.0001, compared with NC.
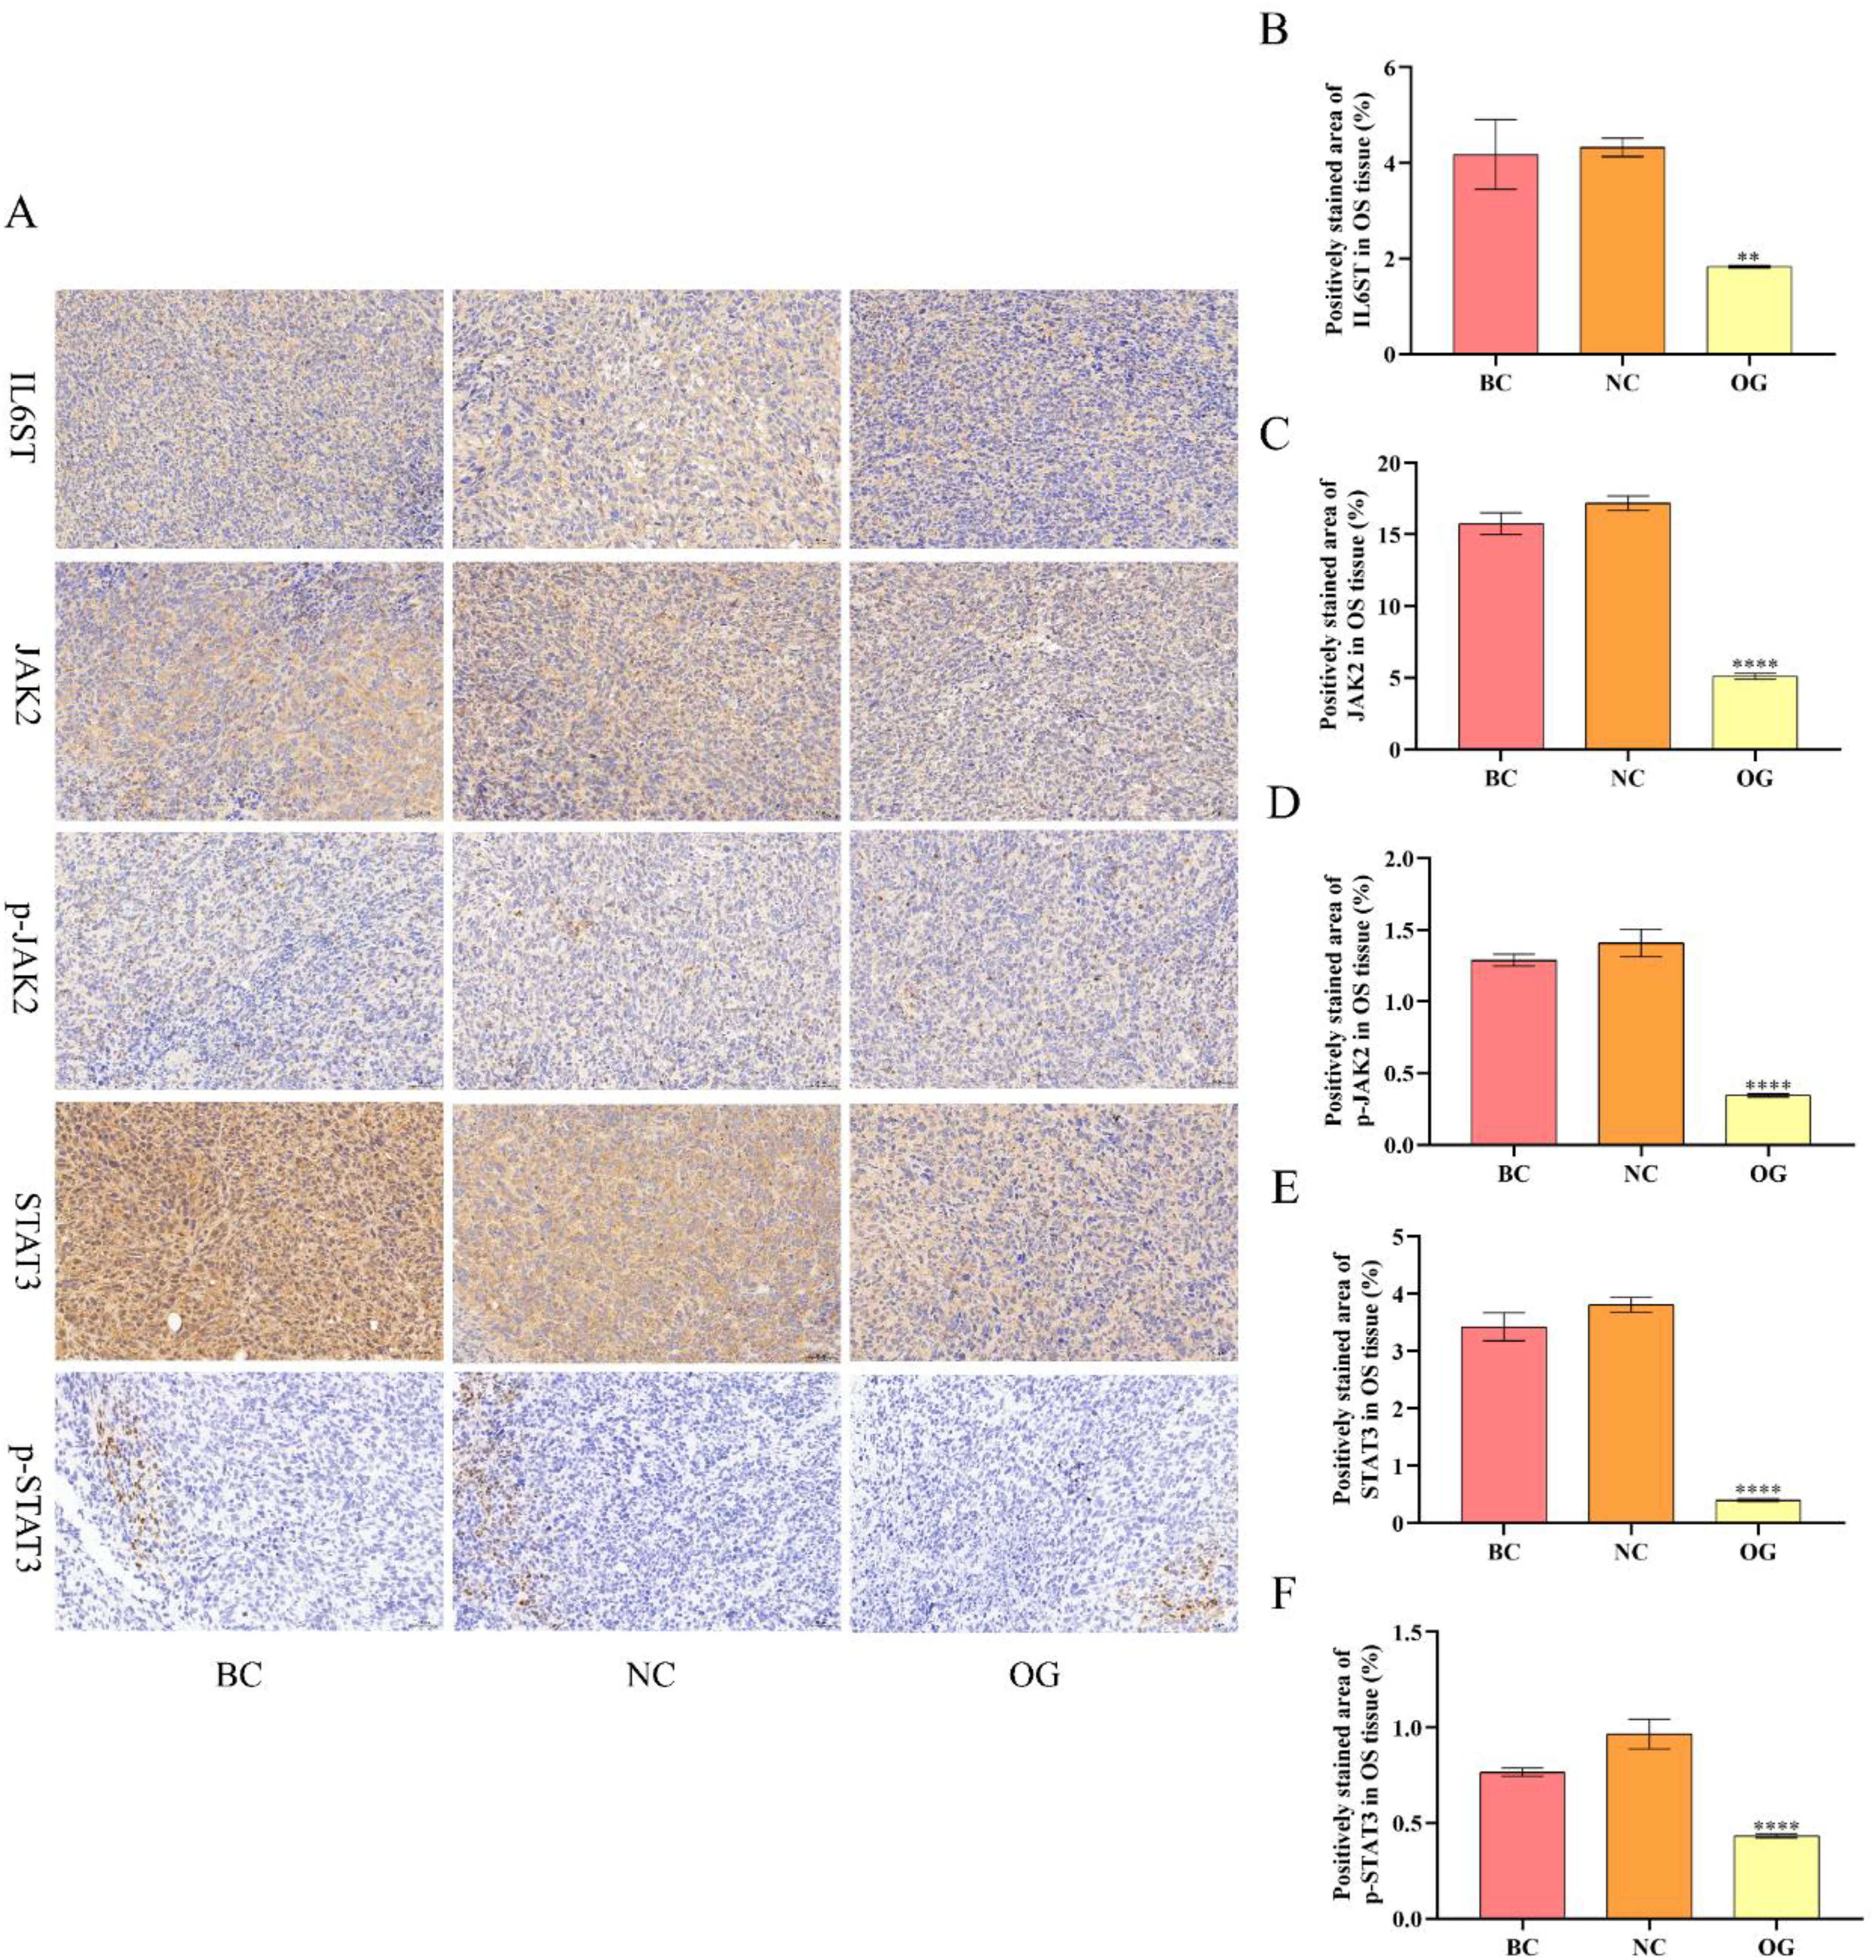
Effects of miR-362-3p on the IL6ST/JAK2/STAT3 pathway of OS cells in vivo. (A) The images of IHC for diverse proteins, namely IL6ST, JAK2, p-JAK2, STAT3, and p-STAT3, in OS tissue (200×). (B) Quantitative analysis results for the positively stained area of IL6ST in OS tissue. (C) Quantitative analysis results for the positively stained area of JAK2 in OS tissue. (D) Quantitative analysis results for the positively stained area of p-JAK2 in OS tissue. (E) Quantitative analysis results for the positively stained area of STAT3 in OS tissue (F) Quantitative analysis results for the positively stained area of p-STAT3 in OS tissue. ****/**P < 0.0001/0.01, compared with NC.
Discussion
In recent years, it was declared that miRNAs played an important role in affecting the progression, migration, invasion, lung metastasis, and chemotherapy resistance of OS. 41 It has been demonstrated that miRNA-324-3p inhibited aerobic glycolysis by targeting PGAM1 to retard the progression of OS. 42 MiR-144-3p aggravated ferroptosis by targeting ZEB1 to suppress the migration and invasion of OS. 43 Moreover, miRNA-491 alleviated the lung metastasis and cisplatin resistance of OS by targeting alphaB-crystallin. 44 However, the effects of miR-362-3p on OS are still unclear. In addition, although it was affirmed that miR-362-3p inhibited the proliferation and migration of most cancers, such as ovarian cancer, cervical cancer, and hepatocellular carcinoma, based on the previous studies, we discovered miR-362-3p may contribute to the progression of some tumors as well.6,45,46 It was affirmed that miR-362-3p promoted the proliferation of gastric carcinoma by regulating CD82. 47 Additionally, one previous study has found that miR-362-3p activated the NF-κB pathway to promote proliferation and suppress apoptosis of gastric carcinoma. 48 Therefore, we investigated the effects and related mechanisms of overexpressed miR-362-3p on 143B cells, U2OS cells, and OS tissue in the present study.
The CCK-8, EdU staining, wound healing assay, Transwell assay, and TUNEL staining were first adopted to respectively determine the effects of overexpressed miR-362-3p on the cell viability, proliferation, migration, invasion, and apoptosis of 143B and U2OS cells in vitro. The results manifested that the cell viability, the positively stained ratio of EdU, the relative migration rate, and the number of invasive cells of 143B and U2OS cells were all prominently down-regulated in the OG compared with those in the NC. In addition, in contrast with the NC, the apoptosis rate of 143B and U2OS cells was memorably up-regulated in OG. The above results suggested that the overexpression of miR-362-3p promoted proliferation, migration, and invasion but suppressed the apoptosis of 143B and U2OS cells in vitro. Meanwhile, approaches of tumor volume detection and H&E staining were employed to respectively determine the effects of overexpressed miR-362-3p on the growth and pathological injury of OS tissue in vivo. The results showed that the tumor volume of OS in the OG was substantially smaller than that in the NC. Compared with the NC, the phenomena of necrocytosis, such as karyopyknosis and chromatin deepening, were more apparent in the OG. The above results demonstrated that the overexpression of miR-362-3p inhibited the growth and aggravated the pathological injury of OS tissue in vivo.
After the effects of the overexpressed miR-362-3p on OS in vivo and in vitro were determined, we further investigated its related mechanisms in alleviating OS. The bioinformatics analysis approaches based on the databases of Encori, Target, and MiRTarBase was first employed to investigate which are the target genes and the involved signaling pathway of miR-362-3p. It was found that IL6ST and SLC6A6 were the target genes of miR-362-3p. The qRT-PCR was subsequently employed to determine the expression level of the 2 genes in 143B and U2OS cells after transfecting with miR-362-3p mimics. Compared with the NC, the gene expression level of IL6ST was dramatically down-regulated but the gene expression level of SLC6A6 was not significantly changed in the OG in 143B and U2OS cells, suggesting IL6ST is one of the downstream target genes of miR-362-3p. Therefore, the PPI network that was established by applying the STRING database was subsequently performed to determine which is the downstream signaling pathway of IL6ST. The results showed the JAK2/STAT3 pathway possessed the minimum false discovery rate, manifesting that the JAK2/STAT3 pathway may acted as the downstream signaling pathway of IL6ST. Therefore, we further investigated whether the effects of miR-362-3p on OS in vivo and in vitro were related to regulating the IL6ST/JAK2/STAT3 signaling pathway.
More importantly, the inhibition of the JAK2/STAT3 signaling pathway has been widely confirmed as an important molecular target for the treatment of various tumors. It was reported that the derivative of the berbamine induced apoptosis of human melanoma cells by inhibiting the JAK2/STAT3 pathway. 48 Withaferin A inhibited the JAK2/STAT3 pathway and induced apoptosis in human renal carcinoma Caki cells. 50 Hwanggeumchal sorghum caused cell cycle arrest and inhibited tumor growth and metastasis of xenotransplanted breast cancer by inhibiting the JAK2/STAT3 pathway. 51 In addition, telocinobufagin inhibits the progression and metastasis of OS by inhibiting the JAK2/STAT3 signaling pathway. 52 In the present study, the qRT-PCR, Western blot, and immunohistochemical staining were applied to respectively investigate the expression level of the IL6ST/JAK2/STAT3 pathway in OS in vivo and in vitro. The results suggested that the overexpression of miR-362-3p not only down-regulated the expression level of multiple genes (including IL6ST, JAK2, and STAT3) and proteins (including IL6ST, JAK2, p-JAK2, STAT3, and p-STAT3) in 143B and U2OS cells in vitro, but also reduced the positively stained area of diverse proteins (including IL6ST, JAK2, p-JAK2, STAT3, and p-STAT3) of OS tissue in vivo. The above results manifested that the overexpression of miR362-3p alleviates OS by inhibiting the IL6ST/JAK2/STAT3 pathway in vivo and in vitro, which is consistent with previous studies.
The comprehensive effects of multiple factors usually cause the occurrence and development of OS. The regulatory mechanisms of OS are complex and frequently involve more than one target gene and pathway. Although the expression level of IL6ST was downregulated after the overexpression of miR-362-3p, it still can’t conclusively prove that IL6ST is the target gene of miR-362-3p only if molecular interaction experiments are employed for verification. One limitation of this study is that the targeting between miR-362-3p and IL6ST was not confirmed through molecular interaction experiments, such as the dual-luciferase reporting and the RNA binding protein immunoprecipitation (RIP) assay. Therefore, we consider that the double-luciferase reporting or RIP assay can be subsequently adopted to accurately validate the target gene of miR-362-3p after applying the bioinformatics analysis approaches. Meanwhile, another limitation of this study is that the experimental evidence for why miR-362-3p is selected to investigate its effects on OS is inadequate. Therefore, we believe that the clinical experiment to enhance the evidence for selecting miR-362-3p, such as determining the expression level of miR-362-3p in the peripheral blood of OS patients, is more comprehensive and reasonable for this study. Moreover, although the JAK-STAT signaling pathway that is presented in Table 2 possesses the minimum false discovery rate, there are still multiple other different subtypes of STAT as Figure 1B illustrates, such as STAT1. Furthermore, some other proteins that are presented in Figure 1B are related to IL6ST. Hence, we believe that some other signaling pathways that contribute to regulating the occurrence and development of OS deserve to be investigated as well, among which at least may include the IL6ST/JAK2/STAT1 signaling pathway. In addition, the expression level of miRNA is also affected by a long-chain noncoding RNA (lncRNA), which is considered a regulator of endogenous miRNA. 53 Therefore, we can also continue to search for lncRNAs that regulate miR-362-3p to replenish the regulatory mechanisms involving miR-362-3p for the treatment of OS.
Conclusions
The overexpression of miR-362-3p not only inhibited the cell viability, proliferation, migration, and invasion and increased the apoptosis of 143B and U2OS cells in vitro, but also suppressed the growth of OS and aggravated the histopathological damage of OS tissue in vivo. Moreover, the overexpression of miR-362-3p downregulated the expression level of genes (ie, IL6ST, JAK2, and STAT3) and proteins (ie, IL6ST, JAK2, p-JAK2, STAT3, and p-STAT3) in vitro, reduced the positively stained area of diverse proteins (including IL6ST, JAK2, p-JAK2, STAT3, and p-STAT3) as well in vivo. Taken together, the overexpressed miR-362-3p suppressed the cell viability, proliferation, invasion, migration, and growth, and aggravated the apoptosis and histopathological damage of OS by suppressing the IL6ST/JAK2/STAT3 pathway in vivo and in vitro.
Footnotes
Abbreviations
Author Contributions
TH cooperated with JL to design and perform all experiments. Moreover, TH wrote the manuscript as well. CL and XZ executed preliminary preparations for all experiments. YW, JL, and ZP analyzed all experimental data. LZ supported the technical support and supervised the progression of experiments.
Authors’ Note
Yunteng Hu and Jianjun Li contributed equally to this work.
Data Availability
The original data and the drug samples applied in this research are accessible from the corresponding author.
Declaration of Conflicting Interests
The authors declared no potential conflicts of interest with respect to the research, authorship, and/or publication of this article.
Ethical Approval
The ethics of this study has been approved by the Southern Medical University at No.1023-1063 South Shatai Road, Baiyun District, Guangzhou City, Guangdong Province, PR China on June 9th, 2022, and this study in accordance with the guidelines of the Ethical Committee of Southern Medical University (ethical code: LAEC-2022-012).
Funding
The authors received no financial support for the research, authorship, and/or publication of this article.
Protocol Statement
The research question, key design features, and analysis plan were prepared before performing the study, and this protocol was not registered anywhere.