
Abstract
Keywords
Introduction
Nasopharyngeal carcinoma (NPC) is one of the most common cancers in southern China, and radiotherapy is the most commonly used irradiation technique to treat it. 1 Numerous organs at risk (OARs) are present in the target area and their adequate protection should be considered when sufficient doses are administered to targets, including the brainstem, spinal cord, optic nerve, optic chiasm, and parotid gland. Intensity-modulated radiotherapy (IMRT) for NPC is one of the most complicated radiotherapy strategies.
NPC planning is an iterative process that requires numerous clinical resources. Obtaining a modern, clinically acceptable plan requires extensive domain expertise. Furthermore, it is excessively time-consuming and spans hours or even days with repeated optimizations, trials, and errors. Therefore, automatic planning technology may yield considerable benefits for the IMRT planning of NPCs. From one viewpoint, this can greatly improve the efficiency of the treatment plan and reduce the planning time; from another viewpoint, it can reduce the level and experience of the planner and improve the robustness of the plan quality.2,3
In the current literature on automatic planning, part of the technological research pertains to the prediction of the target area and organ at risk of dose-volume histograms (DVH) based on prior planning.4–6 With the rapid development of deep learning, studies have recently emerged on predicting three-dimensional (3D) doses based on neural networks7–9 while other studies have focused on the prediction of doses based on convolutional neural network (CNN) as well.10–14 Compared with the prediction of DVH, the realization of automatic planning through 3D dose prediction yields several benefits: (1) satisfies the given DVH objective function with multiple 3D dose distributions, and the objective function based on the 3D dose (voxel level) is determined, which can reduce the problems of planners; and (2) optimization based on the voxel level can clearly tell planner which structural organs are specific to which voxels need to be improved. (3) By anticipating the 3D dose distribution of the patient's plan, the treating physician can review their plan requirements in advance of the plan design, including outlining structural improvements and corresponding dose requirements. (4) To help apply the technique to the treatment planning system in a relatively short period, numerous DVH objective functions of auxiliary regions can be automatically generated based on the predicted 3D dose distribution, thereby improving optimization efficiency and planning quality.
In treatment planning, CT and dose distributions are used as 3D data, with 3D CNNs being more effective. 13 However, this type of calculation requires an increased computational memory and additional training data. A higher resolution slice is required for NPC, which includes significantly small organs such as the optic nerve and lens. Therefore, few studies have employed slice-by-slice methods to perform training and prediction based on the 3D geometric information of CT images.10,14 Since consecutive slices are independent, this method may lack contextual contact information.
Therefore, we attempted to predict dose distribution using a new knowledge-based planning (KBP) architecture by combining the target conformal plan dose (TCPD) dose information with image geometry information. In this study, we evaluated the proposed method's accuracy, generalizability, and robustness and conducted a preliminary study to evaluate the NPC IMRT plans and volumetric modulated arc therapy (VMAT) plans.
Materials and Methods
Patient and Treatment Plan Datasets
A total of 109 NPC treatment plans were selected for training and testing; 62 had T3/T4 stage data, and 47 had T1/T2 stage data. Moreover, 74 cases, 50 with T3/T4 data and 35 with T1/T2 data, were randomly selected as training datasets. Eleven cases were used as the validation dataset, while 24 cases (T3/T4, 12; T1/T2, 12) were selected as test datasets. The dosimetric requirements for the planning target volume (PTVs) and OARs are listed in Table 1. This study has been approved by the institutional review board (IRB) in accordance with good clinical practice (GCP) guidelines of the International Council for Harmonisation of Technical Requirements for Pharmaceuticals for Human Use (ICH), government regulations, and the national legislature. The need for patient consent was exempted in the ethics approval. All patient details in the study have de-identified. The study has followed relevant Equator guidelines. The reporting of this study conforms to STROBE guidelines. 15
Planning Requirements for PTVs and OARs.
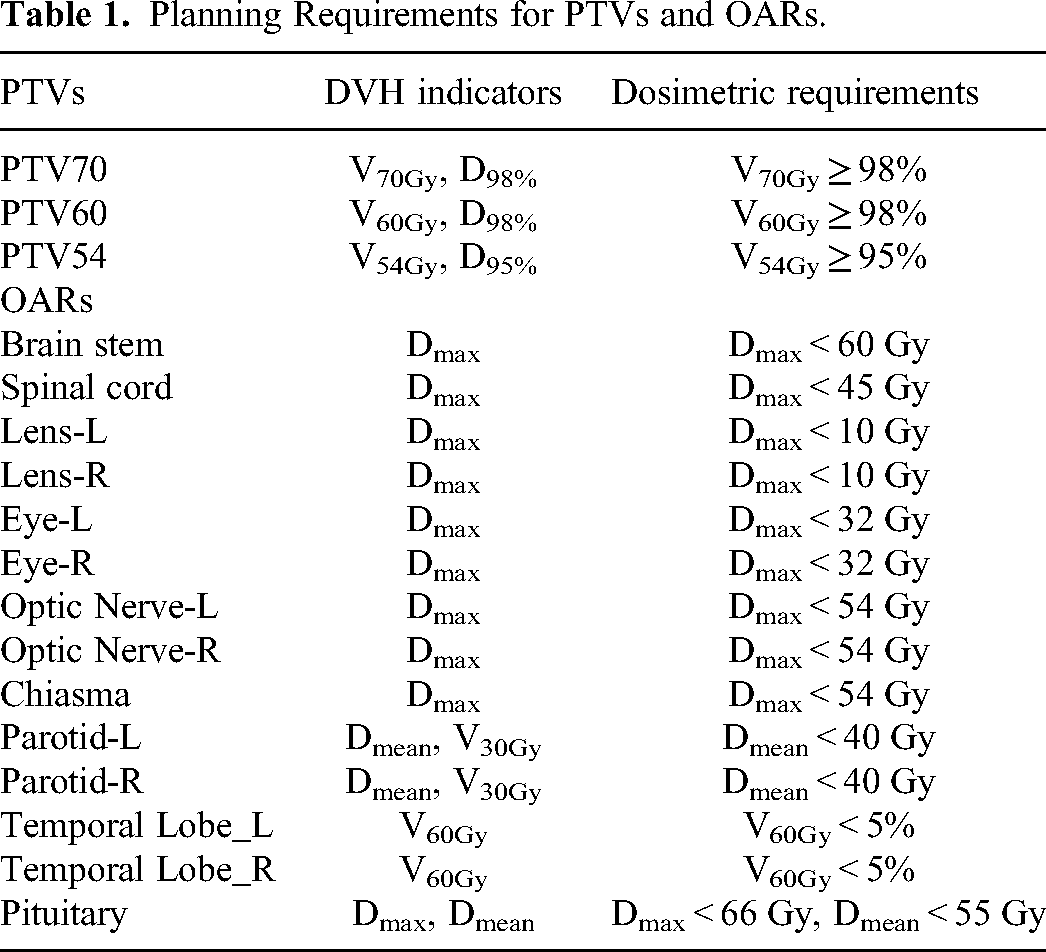
All data included CT images, structures, and IMRT dose distributions. Images were acquired with a large-bore CT scanner (Philips Medical Systems, Netherlands, B. V.) using the following parameters: scan voltage, 140 keV; layer thickness, 3 mm; and image size, 512 × 512. Overall, 87 of 135 slices were acquired from each patient. The treatment plans were created and optimized using Eclipse version 11.0.47 (Varian Medical Systems, Palo Alto, CA, USA), with a computational grid of 2.5 mm. The dose calculation algorithm used was an anisotropic analytical algorithm (AAA). All treatment plans comprised 9-field dynamic multi-lead collimator IMRT plans with gantry angles of 160°, 120°, 80°, 40°, 0°, 320°, 280°, 240°, and 200°. The PTVs had 3 dose gradients with prescribed dose requirements of 70, 60, and 54 Gy.
Data Preprocessing
Geometric Information Data
All the input data were preprocessed as follows:
Each CT slice was resampled to 192 × 192 (columns × rows). A structural image describing the geometry of the targets was generated based on the target structures. Prescription dose values corresponding to each PTV were assigned to the pixel values of PTV70, PTV60, and PTV54. An image describing the geometry of the OARs was generated according to the 11 OARs and body structures. Label values were assigned to the pixel values of each OAR. The 13 OARs included were the spinal cord, brainstem, left lens, right lens, optic chiasm, left optic nerve, right optic nerve, left parotid, right parotid, and pituitary glands.
Target Conformal Plan Dose
Using Eclipse, a simple target conformal plan (TCP) was generated according to the maximum volume PTV (in this study, PTV54). The design steps are as follows: A 9-field conformal treatment plan was created. Each field had the same gantry angle as in the NPC IMRT plan. The radiation fields were shaped to conform to the shape of the PTV54 as visualized through the beam's eye view. All fields were set to have equal weights, and the monitor was set to 100 monitor units (MUs). The dose distributions of this plan were calculated using the AAA algorithm, with a computational grid of 2.5 mm. Each slice of the TCPD image was resampled to 192 × 192 pixels (columns × rows).
Multichannel Information Combination Input
The CT, target, and OAR images generated in section “Geometric Information Data” and the TCPD images generated in section “Target Conformal Plan Dose” were used as multichannel inputs. The size of the input data for TCPD was 192 × 192 × 4 (columns × rows × channels). The CNN model trained using this input is hereafter referred to as the TCPD-CNN. The CNN model trained without TCPD input is hereafter referred to as the non-target conformal plan dose CNN (non-TCPD-CNN). The input size is 192 × 192 × 3 (columns × rows × channels).
The input data for the CT images, OAR labels, and TCPD images were normalized according to the maximum values of the respective channels. To predict the range of values between −1 and 1, the PTVs prescription dose images and dose value of the IMRT plan were normalized according to equation (1).
CNN Architecture
The pixel-based dose prediction process is similar to automatic image segmentation process. The prediction process must identify the categories of the objects in an image and segment the image on a pixel-by-pixel basis. The U-net architecture was initially designed for biomedical image segmentation applications. 16 The encoder gradually reduced the number of spatial dimensions and identified the features of the image, whereas the decoder gradually modified the details and spatial dimensions of objects. The boundary is determined based on a pixel-by-pixel basis by considering that the volumes of the OARs differ in the head and neck region. The DeepLabv3+ architecture uses atrous convolutions and atrous spatial pyramid pooling as encoders for object segmentation at multiple scales and a simple and effective decoder module to refine the segmentation results, particularly along the object boundaries.17–19 In the last layer, convolution with a tanh activation function reduces the number of feature maps for one of the outputs. Schematics of the architectures are shown in Figure 1. A detailed architectural diagram is provided in the Supplemental Material. CNN was constructed using the Keras (https://keras.io) package in Google's TensorFlow (https://www.tensorflow.org) backend.
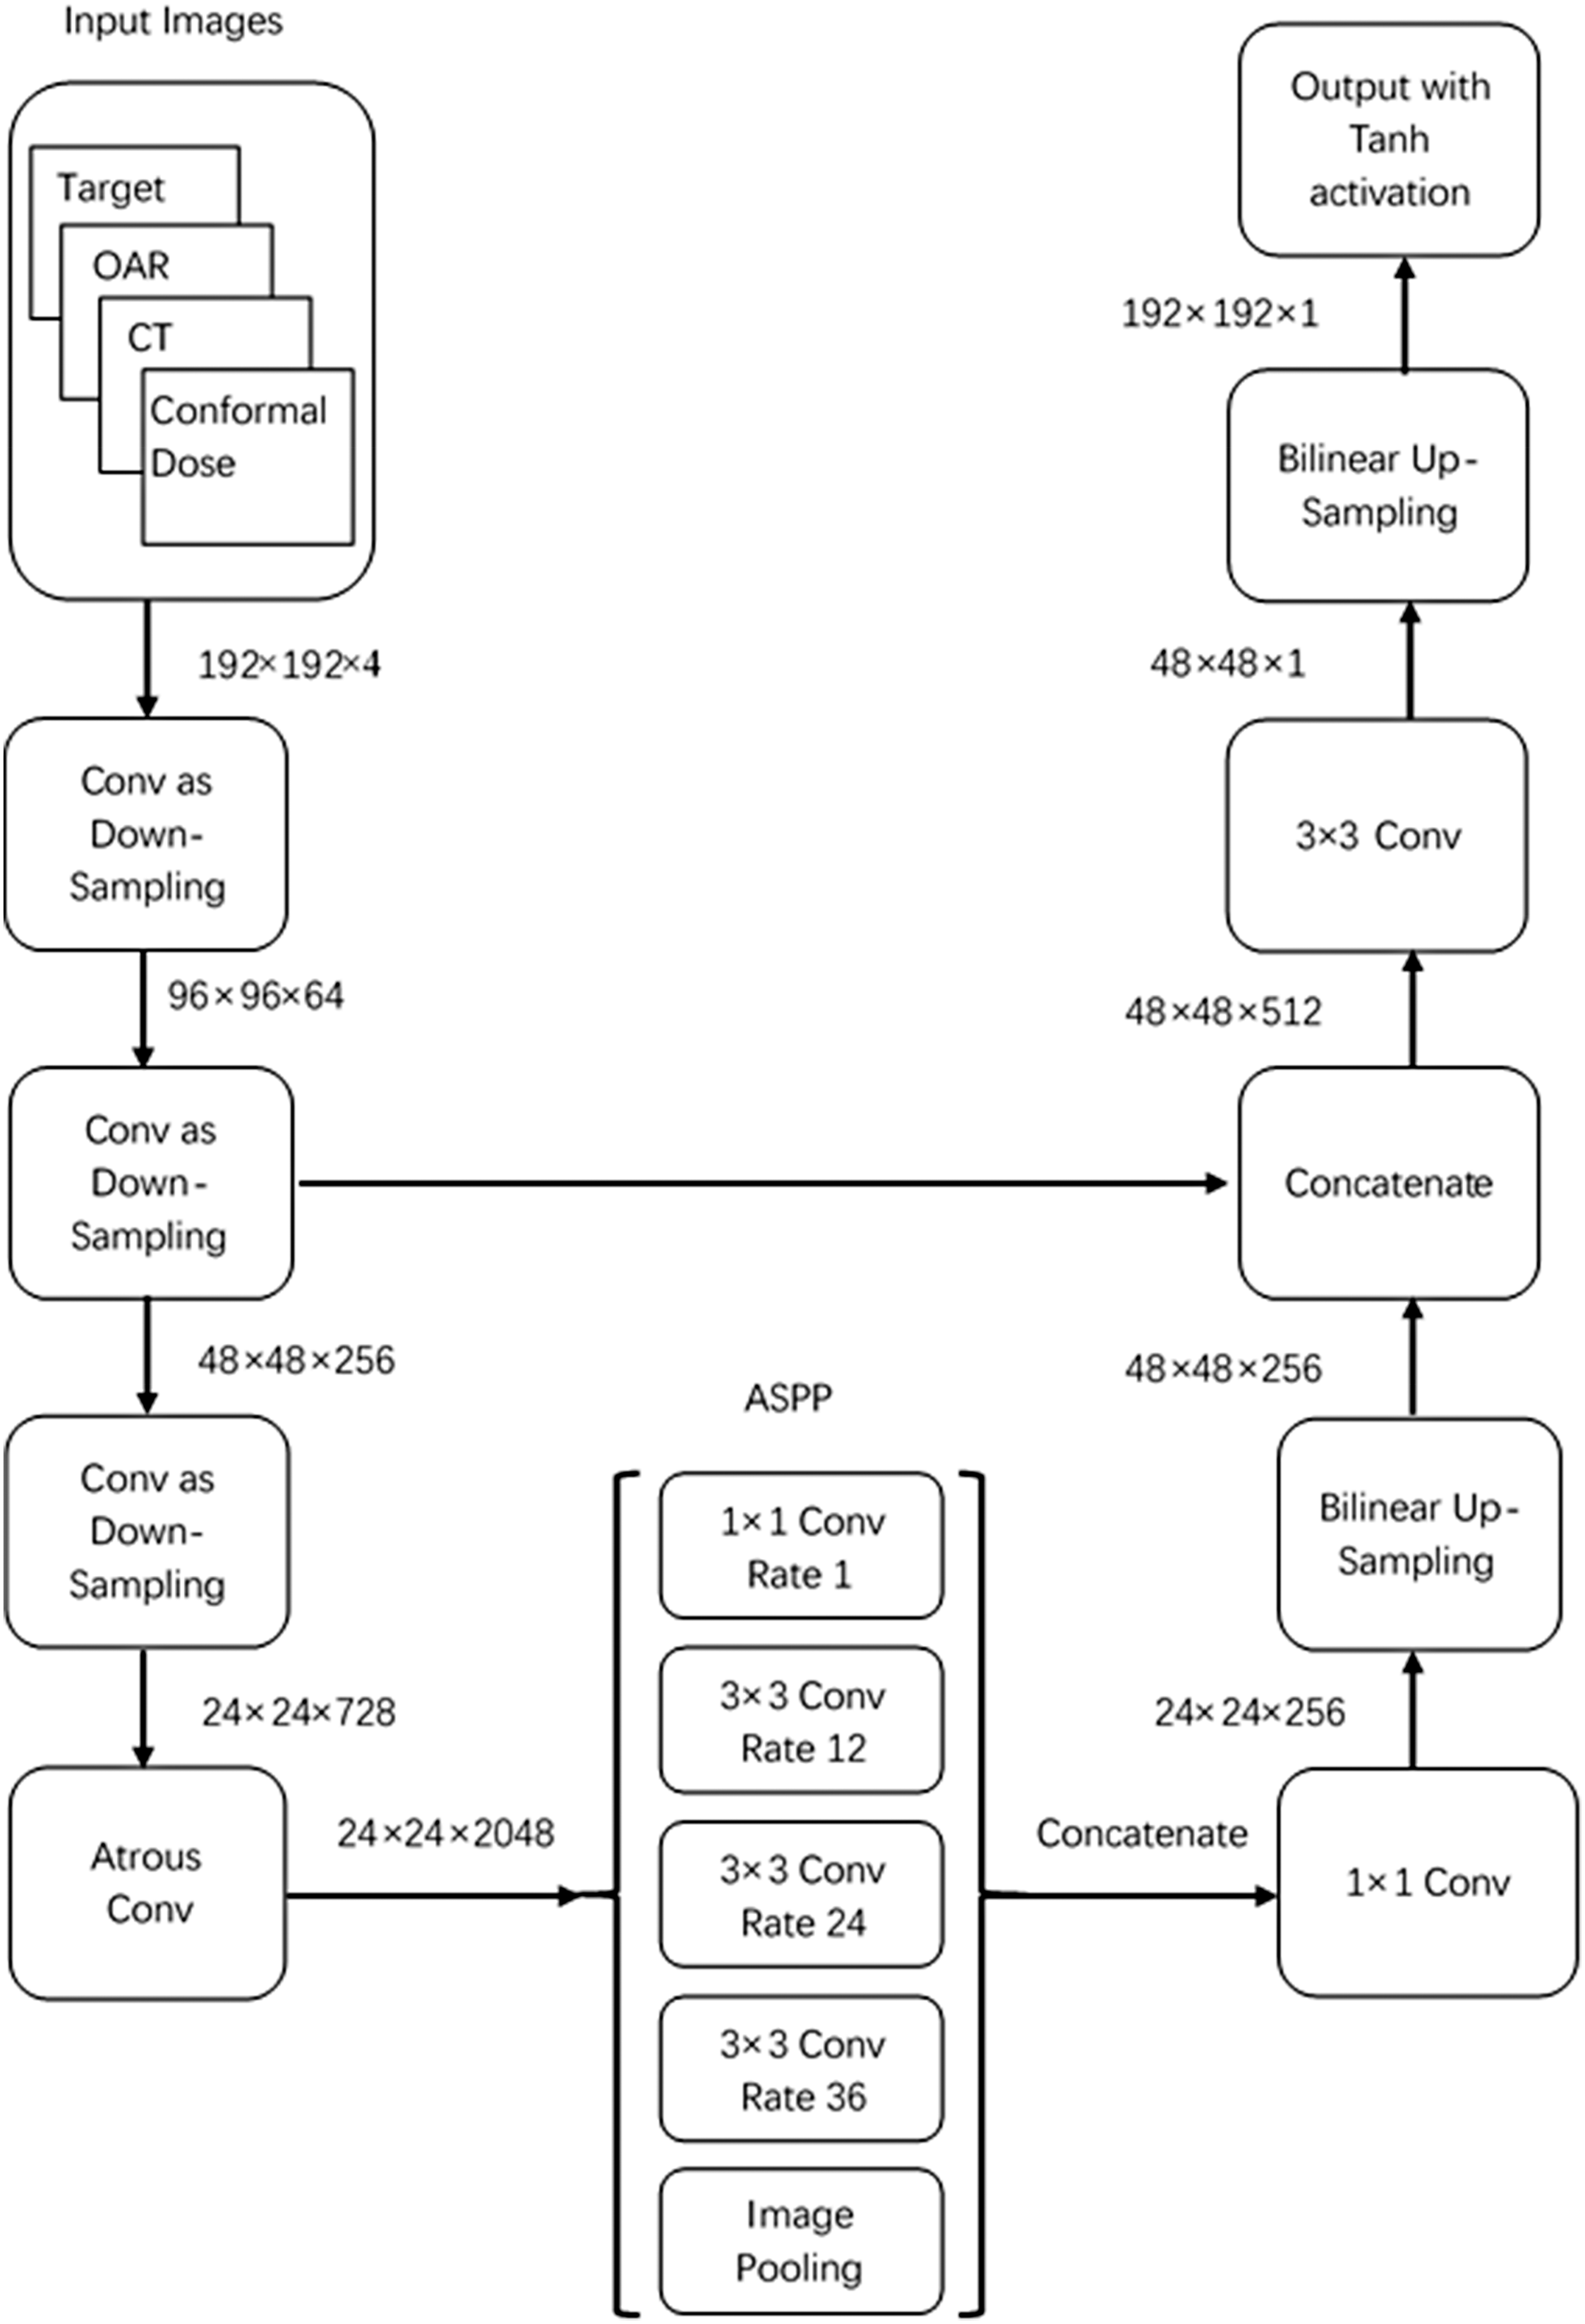
Schematics of the target conformal plan dose (TCPD)–convolution neural network (CNN) and NonTCPD–CNN architectures. The input for NonTCPD–CNN is 192 × 192 × 3.
CNN Training
Adam optimizers were used for training with a learning rate of 0.001. The other parameters were used as default values, as listed in the original publication 20 : beta_1 = 0.9, beta_2 = 0.999, and epsilon = 1×10⁻⁸. To effectively increase the number of training samples, the training data were shuffled, and the following random processing was performed during data training: (1) random rotations in the −15° to 15° range, (2) random horizontal direction shift within 15% of the image width range, (3) random vertical direction shift within 15% of the image height range, (4) random zoom within 10% of the image size range, and (5) random flipping of images in the vertical direction. The training batch size was 2, and the models were trained for 64 epochs. The log(cosh) function was selected as the loss function. The training configuration included a central processing unit i7–7700 K (Intel) and a graphics processing unit GTX 1080 (NVIDIA) with 8GB of RAM.
Evaluation of the Dose Prediction
The predicted dose distributions for the 24 test cases were compared with those of the clinical plans. Accordingly, the DVH, mean dose difference, and 3D gamma evaluations were performed for comparison.
DVH Analysis
To test whether the CNN predictions of the combined dosimetry information met clinical requirements, the DVH indices of the targets and OARs were compared with those of the original clinical plan and analyzed for statistical differences.
To compare the differences in the entire DVH and not only in the indicators, the sum of absolute residuals (SARs) presented by Ma et al was used.
21
The formula is as follows:
Mean Dose Differences
For the targets and OARs, the difference in the mean dose between the clinical plans and 2 prediction methods was compared, and a 3% difference in the prescribed dose (70 Gy in this study) was used as the threshold. The number of structures exceeding the threshold was counted.
3D Gamma Evaluation
The gamma evaluation method is commonly used to compare differences in dose distribution. The commonly used criterion of 3% of the maximum dose was used as the agreed dose criterion, and 3 mm was considered the agreed distance criterion (henceforth referred to as 3%/3 mm). Statistical evaluations were performed for the point at which the dose was greater than 10% of the maximum dose. The gamma pass rates of the 3 gradient target structures and the entire body were counted as a percentage of the gamma value that was not greater than 1.
Robustness Evaluation on Out-of-Training VMAT Plans
To assess the robustness of our network and its potential generalizability to more different technologies, such as more advanced VMAT plans, we performed a test on 12 VMAT patient cases that were not included in the training set. Having trained the model only on an IMRT plans dataset, evaluation of these out-of-training examples could provide useful insights into its potential range of application.
Statistical Analyses
Statistical analyses were performed using the predicted CNN-based and manual results via the ranked Wilcoxon test in SPSS (version 24.0; IBM, NY, USA). Statistical significance was set at P < .05.
Results
TCPD-CNN Prediction Results: DVH Evaluation
The DVH indicators of the target and OAR structures were first evaluated to assess whether the automatic planning requirements were met for the TCPD-CNN model. Table 2 summarizes the DVH indicator results for the test datasets for the PTVs and OARs. Indices that exhibited statistical differences between the original clinical planning and model prediction are highlighted.
Comparison of DVH Indices of PTVs and OARs of the Plans Between Clinical Plans and TCPD–CNN Prediction.
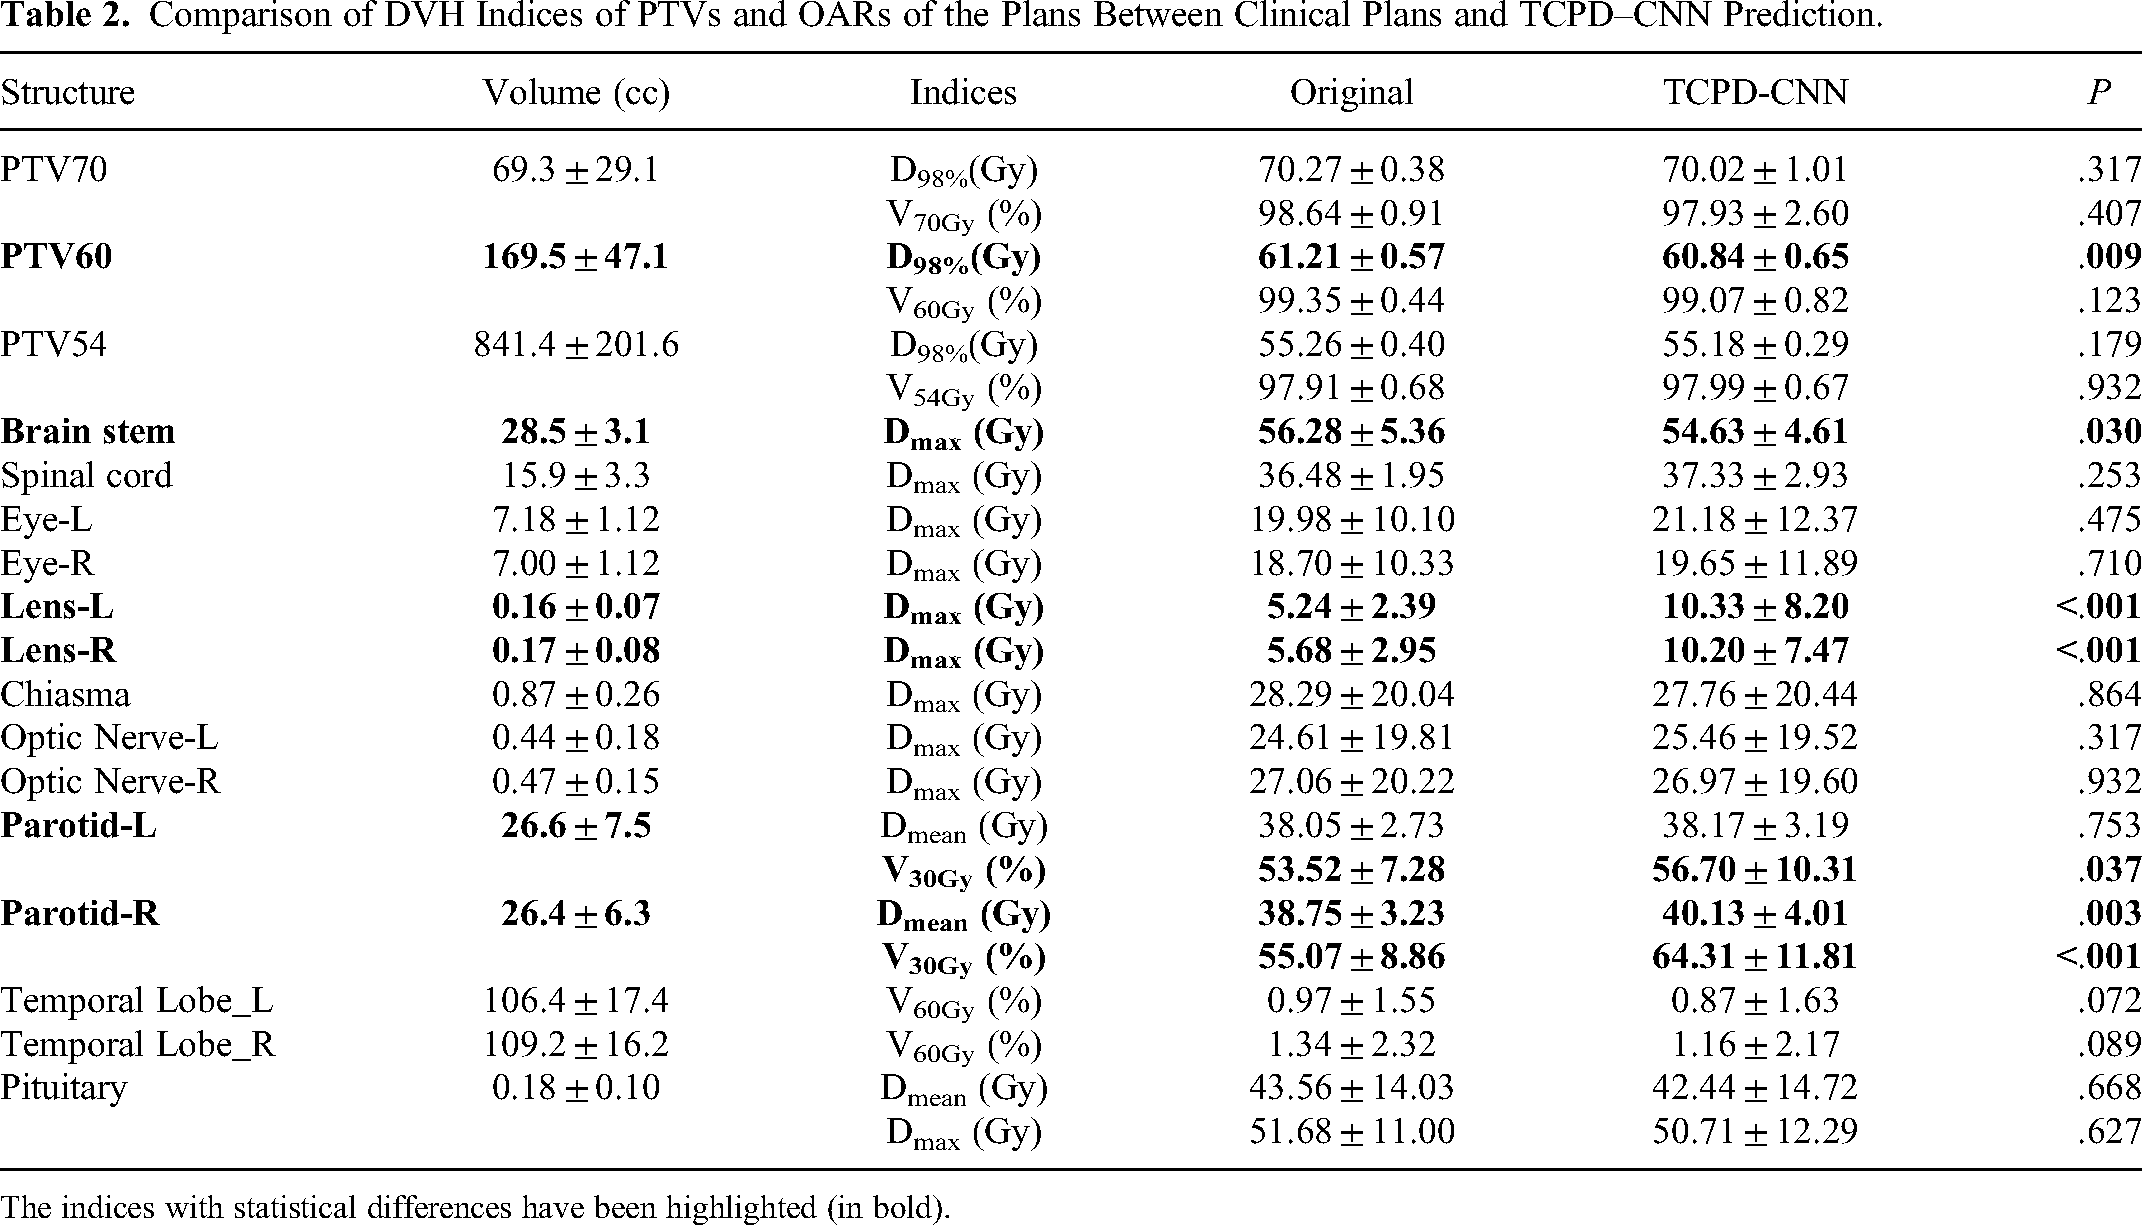
The indices with statistical differences have been highlighted (in bold).
From the results for the PTVs regarding the multidose gradient requirement (70, 60, and 54 Gy), the TCPD-CNN model exhibited no statistical differences compared to the original clinical planning in the case of D98% of PTV60. However, the difference in D98% was less than 0.37 Gy (ie, <0.5% of the prescribed dose). The predicted results of the model were within the clinically acceptable ranges.
For most OARs, there was no statistical difference, even for some small-volume structures, such as the eyes and optic nerves. However, there were still statistically significant differences in the structures of very small volumes, such as lenses. Moreover, the predicted dose to the brainstem was slightly lower than the manually planned dose. In contrast, the predicted dose to the right parotid gland (V30%) was higher than that of the original clinical plan, and was probably related to the overlap of the target volume.
To compare the differences in the entire DVH—not only the indicators—the SARs presented by Ma et al were used. 20 The smaller the SAR value, the closer the DVHs of the predicted results were to those of the clinical plans. Simultaneously, the results of the non-TCPD-CNN without additional dosimetric information were also evaluated herein to clearly understand the differences in the predicted results between the 2 methods. Table 3 summarizes the SARs and P-values of the 2 methods along with the statistical differences. Based on the evoked results, it can be observed that the SARs of the PTV60, spinal cord, optic chiasm, optic nerve, temporal lobe, and pituitary were statistically different, and the SARs of the TCPD-CNN group were smaller than those of the non-TCPD-CNN group.
SARs and P-Values of the Plans Based on the 2 Prediction Methods.

The results with statistical differences have been highlighted (in bold).
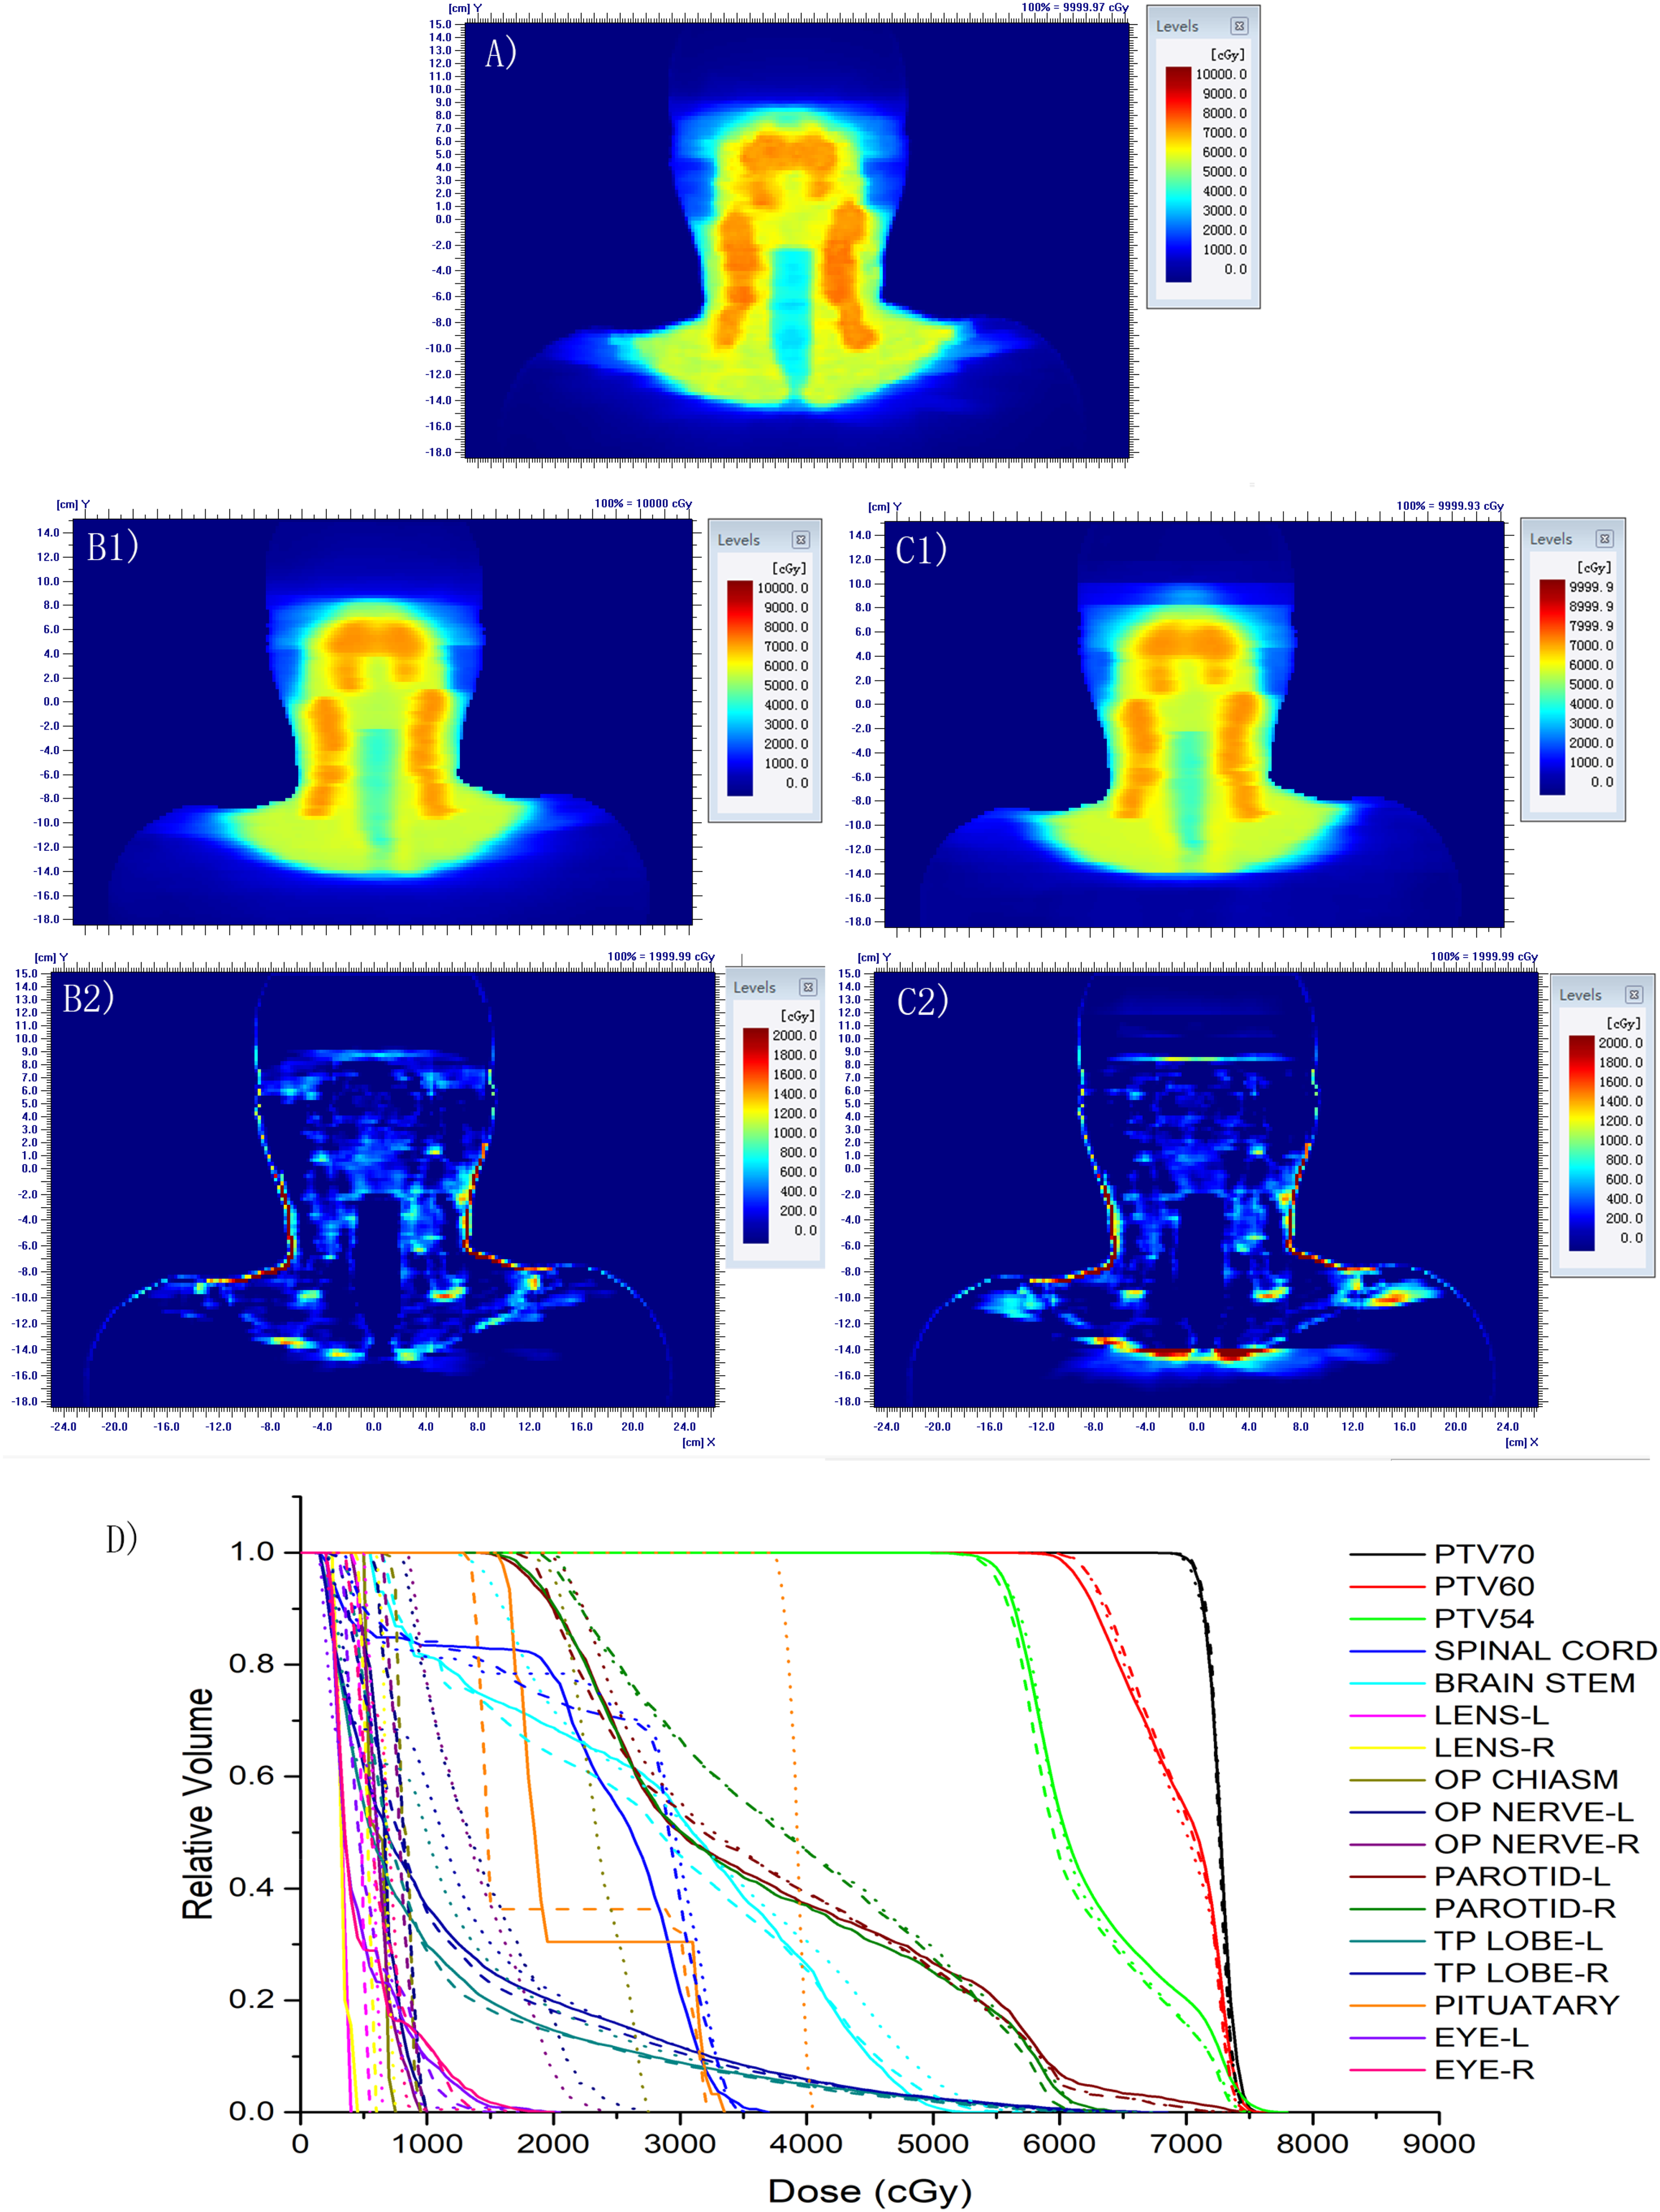
To help visually assess the differences between the 2 methods, the results of the terminal stage (T3N2M0) plan are presented in Figure 2, and the results of the early stage (T2N1M0) plan are presented in Figure 3. In the dose difference map, the display changed from blue to red. When the difference was small, the color was close to blue, whereas when the difference was large, it was closer to red.

A terminal stage (T3N2M0) plan dose distribution and dose volume histogram (DVH) results. (A) clinical plan dose distribution, (B1) TCPD–CNN predicted dose distribution, (B2) different dose distributions between the TCPD–CNN prediction and clinical plan, (C1) NonTCPD–CNN predicted dose distribution, (C2) dose distribution differences of the NonTCPD–CNN prediction and clinical plan, (D) DVH of different structures, with clinical planning (solid line), TCPD–CNN prediction (dash line), and NonTCPD–CNN prediction (dot line). The same color indicates the same structure.
An early-stage (T2N1M0) plan dose distribution and DVH results. (A) Clinical plan dose distribution, (B1) TCPD–CNN predicted dose distribution, (B2) dose distribution differences between the TCPD–CNN prediction and clinical plan, (C1) NonTCPD–CNN predicted dose distribution, (C2) dose distribution differences of the NonTCPD–CNN prediction and clinical plan, (D) DVH of different structures, with clinical planning (solid line), TCPD–CNN prediction (dash line), and NonTCPD–CNN prediction (dot line). The same color indicates the same structure.
Mean Doses of Structures
Figures 4 and 5 depict the mean doses for all planned targets and OARs, respectively, and indicate the differences in the predicted results for all plans, which help in comparing the 2 methods more clearly.

The relationship of the mean dose between the clinical plan and the predicted plan of PTV70, PTV60, and PTV54, whereby the black color is the predicted dose of TCPD–CNN, and the red color is the predicted dose of NonTCPD–CNN. The 2 straight lines denote the ±3% bounds of the prescribed dose.
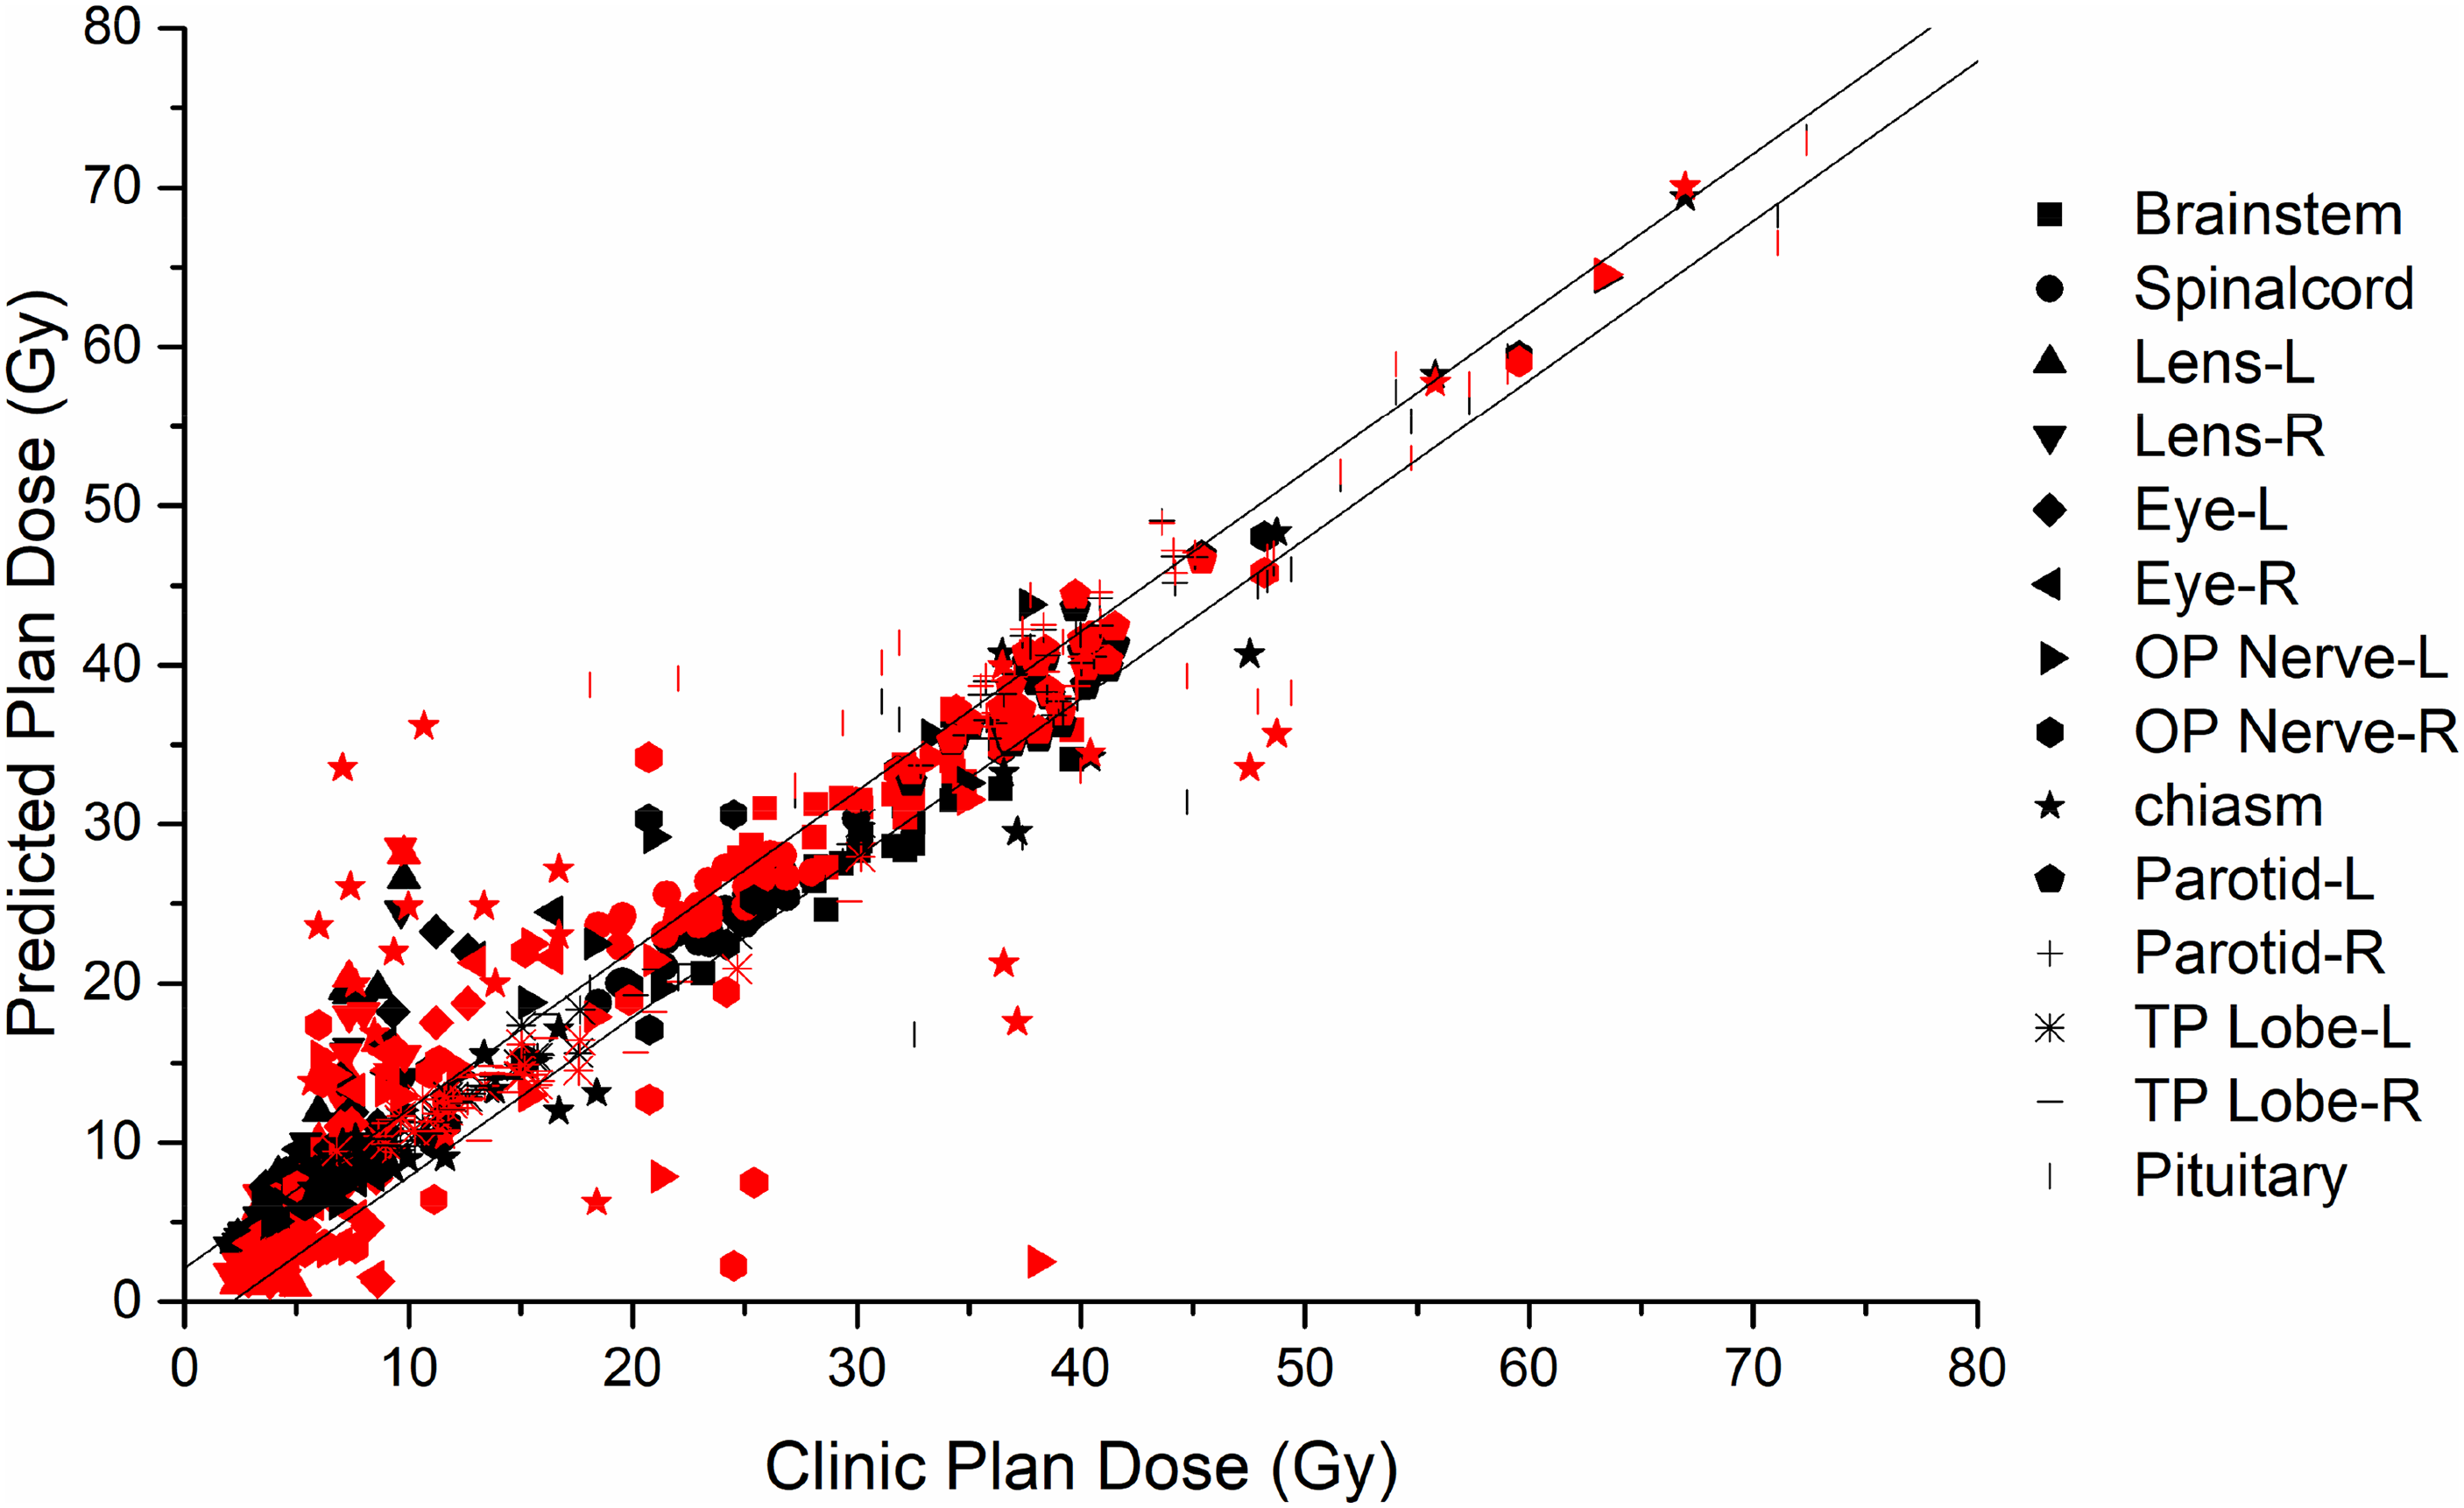
Relationship of mean dose between the clinical and the predicted plans of OARs, whereby the black color is the predicted dose of TCPD–CNN, and the red color is the predicted dose of the NonTCPD–CNN. The 2 straight lines denote the ±3% bounds of the prescribed dose.
Figure 4 shows that the mean doses predicted by the 2 models and clinical plan are different but within 3% of the prescribed dose. The Pearson correlation of the TCPD-CNN model and clinical plan was 0.995, and the P-value was less than .0001. The Pearson correlation of the non-TCPD-CNN model and clinical plan was 0.991, and the P-value was <.0001. As shown in Figure 5, 336 mean dose comparison values for 14 OARs in 24 cases and 228 values (67.9%) based on the TCPD-CNN model were within the prescribed 3% dose difference. Moreover, 182 values (54.2%) in the non-TCPD-CNN model were within the 3% dose difference range for the prescribed dose. The Pearson correlation of the TCPD-CNN model and clinical plan was 0.978, and the P-value was <.0001. The Pearson correlation coefficient of the NonTCPD–CNN model and the clinical plan was 0.931, and the P-value was <.0001. Moreover, the results predicted by the non-TCPD-CNN model were more discrete than those predicted by the TCPD-CNN model.
Gamma Evaluation
Herein, the gamma pass rate, which refers to the concept of treatment plan verification, was used for a more comprehensive evaluation of the differences between the predictions of the models and clinical plans of the dose distribution. The commonly used clinical criterion was 3%/3 mm, with a 10% threshold. Table 4 lists the statistical results of the pass rates for the 3 gradient target structures and the entire body. It can be observed from the results that for the targets, the gamma pass rate of the TCPD-CNN model was >90%. The passing rate was relatively low for the entire body. However, compared to the non-TCPD-CNN outcomes, the TCPD-CNN outcomes were significantly closer to the original clinical plans (P < .05).
3%/3 mm 3D Gamma Pass Rates.
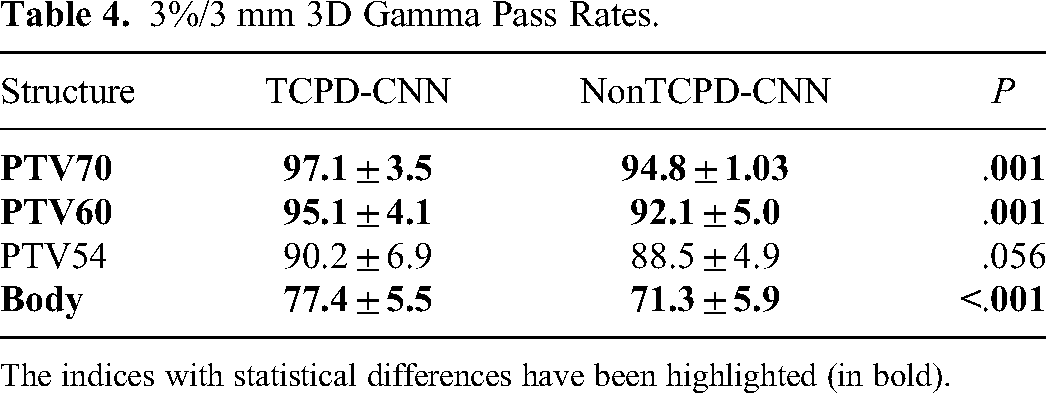
The indices with statistical differences have been highlighted (in bold).
Evaluation of Out-of-Training VMAT Plans
Finally, the performance of our network was tested on 12 previously unseen VMAT plans. For the PTV70, PTV60, and PTV54, the mean dose differences were less than 1%. The mean dose differences of the entire body of TCPD-CNN and non-TCPD-CNN were 3% and 6%, respectively. Table 5 summarizes the SARs and P-values of the 2 methods. Statistical differences have been highlighted. Based on the evoked results, it can be observed that the SARs of the PTV60, spinal cord, optic nerve, and temporal lobe were statistically different, and the SARs of the TCPD-CNN group were smaller than those of the non-TCPD-CNN group. Table 6 summarizes the statistical results of the pass rates for the 3 gradient target structures and the entire body. For the target region, the average pass rates were >90%. Moreover, the results of the TCPD-CNN group were higher than the non-TCPD-CNN group.
SARs and P-Values of the VMAT Plans Based on the 2 Prediction Methods.

The results with statistical differences have been highlighted (in bold).
3%/3 mm 3D Gamma Pass Rates for VMAT Plans.

The indices with statistical differences have been highlighted (in bold).
Discussion
This study introduces a novel automatic planning method integrating patient 3D images, structural outlines, and target conformal dose planning. This approach uses deep CNNs to predict 3D doses and encompasses a broader range of indicator evaluations beyond the traditional DVH node. This will help us further explore new KBP frameworks and quality assurance methods for treatment planning.
In the case of the PTVs of the multidose gradient requirement (70, 60, and 54 Gy), the deep learning frameworks of the TCPD-CNN model exhibited statistical differences compared with manual planning in the case of PTV60. The difference in the DVH index did not exceed 0.5%. The reason for these findings may be attributed to the fact that there is an overlap between the PTVs and the left and right parotids. The results of different target gradients showed that the DVH results were different from the 3D gamma pass rates for 3D dose distribution. It is shown that compared with the prediction of only DVH, the realization of automatic planning through 3D dose prediction would have different results.
For the OARs, the brain stem, the right and left lens, and the right and left parotids are statistical differences. For the brain stem, the average predicted Dmax is less than the clinical plans. However, the predicted dose deviates greatly from the clinical plans. The right and left lenses are considerably smaller structures, with an approximate volume of 0.19 mL, encompassing about 10 pixels in one of the patients tested. This size is notably smaller compared to other anatomical organs. The entire CT set was used as input during training, and the number of voxels used for training this structure was very small. Highly unbalanced samples of small-volume structures are expected to affect the final results.10,22 There was an overlapping area between the parotid gland and the target, and the brainstem was close to the target. The longstanding research topic is the characterization and balance of trade-offs between conflicting structures in radiotherapy planning. 23 Conversely, high doses are required to ensure coverage of the target area, whereas the corresponding OARs require a reduced dose for protection. These 2 conflicting requirements result in an overlapping area that physicians and physicists must assess. Accordingly, there may be differences in clinical decision-making between the different plans in that part of the overlapping area. It is possible to upinterpolate the grids in this area to increase the number of training voxels, and adding information on other clinical indices may potentially improve the results obtained from this area. However, the predicted results for both frameworks were within the clinically acceptable ranges. Moreover, these results were similar to those reported by Fan et al. 10
Increasing the input information is one way to improve the CNN performance with limited training data. In this study, in addition to geometric information, including CT images and structures, attempts were made to increase the 3D dose distribution of the TCP as one of the main pieces of information, along with the CT images and structures. In theory, this input information can improve the accuracy and consistency of predictions. Accordingly, (1) Features of the dose algorithm of the TPS and energy of the LINAC should be included so that the predicted results are more consistent. As shown in Figure 5, the results predicted by the non-TCPD-CNN model are more discrete than those predicted by the TCPD-CNN model. (2) The CNN predicted the dose value. The influence of different model data can be reduced by inputting the dose values using the same model as that used for the predicted value. (3) The dose contributed to each point includes contributions from the primary and surrounding scatter doses.24–26 In other words, the surrounding geometric density distribution of 3D CT reflects the current point-dose value. (4) The robustness of the model can be effectively improved by attaching a stable 3D TCPD input, and according to the Robustness evaluation on out-of-training VMAT plans, the TCPD-CNN model performs more robust than the NonTCPD-CNN model.
In this study, the SAR defined by Ma et al 21 was used to evaluate DVH. To compare dose predictions, the gamma pass rate commonly used in quality assurance was used for dose distribution comparison, and the evaluation results of different dose gradient targets and the entire body based on the 3%/3 mm criterion were provided. Although this method cannot be used to estimate the accuracy of dose prediction, this study used it to compare the prediction of the dose in association with clinical plans in a specific environment.
The study results indicate that if the clinical plans are considered as standard, the accuracy and consistency of the dose prediction can be improved by the addition of dose information. For DVHs, targets, and OARs, the predicted results of the 2 methods yielded statistically different outcomes. Moreover, for some small-volume OARs, such as the optic nerve and chiasm, the SARs were reduced by 100%. The dose distributions of the entire body and TCPD–CNN predicted dose distributions had higher 3D gamma pass rates. It should be emphasized that the average 3D gamma pass rate of the entire body is lower than 90% because the dose distribution predicted by CNN is blurred outside the target structures and lacks fine dose gradient changes (Figure 6). Vasant et al used CNN to predict the dose of a prostate plan, and a lack of fine dose gradient changes was observed outside the target structures. 11 However, the pass rate was much higher for the target structures of the nasopharynx, and PTV70 reached 97%.

Dose distribution along the transverse plane, (A) clinical planned dose distribution, (B) predicted dose of TCPD–CNN.
Compared to the prediction of DVH, only a few studies exist on dose prediction based on deep learning, and specific diseases of NPC. Fan et al first studied the dose prediction of NPC based on images and structural information. 10 Results have shown that the deep-learning-based method could be used for dose prediction. The statistical results of the DVH indices listed in their publications are similar to ours. In a recent study, Ma et al proposed a dosimetric feature-driven method with a PTV-only VMAT plan DVH input to estimate the potentially achievable quality of treatment plans and establish a machine-learning-based DVH prediction framework. 21 Although their study predicted the DVH and used a PTV-only VMAT plan, which differs from this study, they attempted to improve the prediction accuracy based on similar dosimetric data. Barragan-Montero et al proposed a model that considers variable beam configurations to achieve dose prediction in patients with lung IMRT. Their results showed that the model with beam configurations substantially outperformed the model without beam configurations in the low- and medium-dose regions and slightly in the high-dose regions. 12 Furthermore, the preliminary results of this study initially confirmed the feasibility of adding dosimetric parameters to the IMRT of NPC.
Compared with the input CT images and structures, the new method requires an additional step related to the design and output of the dose of the TCP. This task can be completed using a simple template and needs to shape the field to conform to the maximum PTV, and the sets of beam weights of all fields can become equal. This can also be automatically realized using a TPS script. The entire process, including dose calculations, can be completely automated, lasts 2-3 min and can be implemented using an in-house system, which may be more convenient and faster.
We furthermore evaluated our trained model on 12 previously unseen VMAT plans. The predicted dose distributions of these out-of-training examples performed well for the target regions. The performance of the TCPD-CNN model is more robust than that of the non-TCPD-CNN model, which has lower SARs and higher gamma pass rates. Nonetheless, the results of out-of-training examples are purely an indication of the robustness of our approach. Further training on out-of-training radiation therapy techniques will be needed to expand the range of operation of our method. However, we believe that our approach is easily generalizable to more techniques.
One apparent limitation of this study and the resulting model is the size of the training data. Typical deep learning algorithms employ hundreds of thousands or millions of training data points. In such cases, the size of the training data limits the algorithm's performance. However, arranging large, well-labeled, and consistent standard datasets for radiation therapy is difficult. In this study, 74 NPC cases were selected as the training data. Because the model employs slice-by-slice training, each case had approximately 100 slices; thus, there were approximately 7400 training samples. The training data were shuffled to increase the number of training samples effectively, and random processing was performed during training on the data, as described in the Materials and Methods. This image generator can reduce the training difficulty caused by insufficient samples, thereby reducing model overfitting and increasing model stability.
Although this was a preliminary study, the results are encouraging. However, further studies are required to confirm the hypothesis. Possible future scope pertains to the (1) feasibility of the model to improve the accuracy and consistency of the predicted dose, (2) effectiveness of the method for other diseases, and (3) possibility of the corresponding KBP processes being established. Preliminary studies on nasopharyngeal cancer IMRT have shown that including dosimetric information has significant benefits in terms of accuracy and robustness in prediction.
Conclusions
In this study, an IMRT dose distribution prediction method was proposed based on deep learning and in accordance with the introduction of TCP dose distribution as additional dose information. This method can predict the dose distribution that meets clinical requirements with multichannel information input. Moreover, this method possesses a good generalization capacity based on the existence of limited training data, which can constitute the basis for studying other diseases and potentially improve the training effect of deep-learning KBP models.
Supplemental Material
sj-pdf-1-tct-10.1177_15330338241256594 - Supplemental material for Deep Learning-Based Prediction of Radiation Therapy Dose Distributions in Nasopharyngeal Carcinomas: A Preliminary Study Incorporating Multiple Features Including Images, Structures, and Dosimetry
Supplemental material, sj-pdf-1-tct-10.1177_15330338241256594 for Deep Learning-Based Prediction of Radiation Therapy Dose Distributions in Nasopharyngeal Carcinomas: A Preliminary Study Incorporating Multiple Features Including Images, Structures, and Dosimetry by Yixuan Wang, ME, Zun Piao, ME, Huikuan Gu, ME, Meining Chen, MM, Dandan Zhang, PhD, and Jinhan Zhu, PhD in Technology in Cancer Research & Treatment
Footnotes
Abbreviations
Acknowledgments
The authors would like to thank Lixin Chen, PhD for kindly providing help in treatment plans collection.
Author Contributions
All authors contributed to the research, data collection, and analysis. YW and ZP developed the calculation program and performed the data analysis. JZ and DZ conceived of the study, including the study design and coordination. HG and MC assisted with the data collection and filtering. All authors read and approved the final manuscript.
Availability of Data and Materials
The datasets used and analyzed during the current study are available from the corresponding author on reasonable request.
Declaration of Conflicting Interests
The authors declared no potential conflicts of interest with respect to the research, authorship, and/or publication of this article.
Funding
The authors disclosed receipt of the following financial support for the research, authorship, and/or publication of this article: This study was supported by the National Natural Science Foundation of China (12005315, 11905303).
Ethics Approval and Consent to Participate
This study has been approved by the institutional review board (IRB) of the Sun Yat-sen University Cancer Center in accordance with good clinical practice (GCP) guidelines of the International Council for Harmonisation of Technical Requirements for Pharmaceuticals for Human Use (ICH), government regulations, and the national legislature (approval number YB2018-06). All data used in this study was anonymized before import.
Supplemental Material
Supplemental material for this article is available online.
References
Supplementary Material
Please find the following supplemental material available below.
For Open Access articles published under a Creative Commons License, all supplemental material carries the same license as the article it is associated with.
For non-Open Access articles published, all supplemental material carries a non-exclusive license, and permission requests for re-use of supplemental material or any part of supplemental material shall be sent directly to the copyright owner as specified in the copyright notice associated with the article.