
Abstract
Introduction
Nasopharyngeal carcinoma (NPC) is a very common type of head and neck tumor in certain parts of Southeast Asia and China, though it ranks 23rd worldwide. 1 Due to the numerous organs at risk (OARs) locating at the nasopharynx, radiotherapy is one of the standard treatment methods for NPC patients, especially with intensity-modulated radiotherapy (IMRT) and volumetric-modulated radiotherapy (VMAT). Radiotherapy for NPC patients usually lasts 6 to 7 weeks, and the long treatment course will lead to changes of anatomic structures and deviations of radiation dose. The investigation of Brouwer et al. showed that the mean dose differences of parotid gland for some patients between planning CT (pCT) and repeat CT were up to 10Gy. 2 Thus, these radiation dose deviations may cause overdose to OARs and underdose to tumor target.
In order to reduce the radiation dose differences, it is necessary to monitor the dose during the treatment. In current clinical routine, we haven't been able to verify the delivered dose to tumor target and OARs for every treatment. Adaptive radiotherapy (ART), which could provide adjustment of the treatment plan according to the guided images before dose delivery, is a possible solution. CT is the ideal guided image, however, it's not appropriate to perform CT scan before each treatment. It will increase extra burden to patients and unnecessary radiation dose.
As a common image-guided device, cone beam CT (CBCT) is frequently performed for patient's setup alignment in most clinics. If the CBCT images could be used for monitoring the anatomical changes and dose deviations, both the staff and patients would benefit from the limited medical resources. However, the poor image quality makes it impossible for doctors to clearly recognize the boundary of certain OARs and tumor target on CBCT. Also, the dose calculation is challenging because of the inaccuracy of Hounsfield units (HU) on CBCT images. Thus it is not feasible to directly use original CBCT for ART.3,4
CBCT images have many imaging artifacts inherently, such as noise, streaking, hardening, ring and cupping artifacts caused by scatter contamination.5,6 There have been many methods to improve the CBCT image quality. Preprocessing methods including the air-gap, 7 bowtie filter 8 and anti-scatter grid 9 are mainly hardware-based methods. The hardware-based approach prevents a certain number of scattered photons from reaching the detector, but the number of initial photons will be reduced simultaneously. This would lead to more imaging dose received by patients if the same signal-to-noise ratio (SNR) was maintained. Postprocessing methods are software-based, including analytical modeling, 10 Monte Carlo simulations,11–13 measurement-based methods, 14 and modulation methods. 15 The limitations of those methods include time-consuming processing or large anatomic changes.
In recent years, artificial intelligence (AI) has already been implemented widely in the medical field.16,17 Deep learning methods were proposed for correction of CBCT images by learning the mapping functions between CBCT and pCT images using available loss, such as U-Net and CycleGAN models. The U-Net is a popular neural network architecture in biomedical image segmentation. 18 It utilizes encoding-decoding structures and skip connections to capture shallow and deep sematic features, and enables precise localization at the same time. There are many kinds of generative adversarial networks (GANs), which are designed to solve the image-to-image translation problems naturally. CycleGAN19,20 consists of several competing neural network models named as generator and discriminator. During training process, the U-Net model is supervised training with paired images, while the CycleGAN model are in absence of paired datasets. Hansen et al. 21 proposed a fast method based on convolutional neural network (called ScatterNet) for shading correction in projection domain space. After the scattering correction, the average absolute error of CT HU value decreased from 144HU to 46HU. Kida et al. 22 used a U-Net to improve the CBCT image quality for prostate cancer patients. Chen et al. 23 proposed a deep U-Net-based approach and hybrid loss function to synthesize CT-like images with precise HU value while keeping anatomical structures of CBCT images. Harms et al. 24 used CycleGAN with residual blocks and compound loss function to improve CBCT image quality, and the MAEs at the site of brain and pelvis were 13.0 ± 2.2 HU and 16.1 ± 4.5 HU, respectively. Liang et al. 25 improved the synthetic CT (sCT) images quality by CycleGAN model, and the results indicated that the anatomical accuracy by CycleGAN outperformed the deformed registration method. These studies generated sCT from CBCT images by using either U-Net or CycleGAN methods. However, there is still a lack of detailed comparison between supervised and unsupervised deep learning methods for CBCT-to-CT generations and dose calculations.
In this study, we aim to generate sCT images with high quality from CBCT and pCT that can be used for accurate radiation dose calculation. The supervised and unsupervised deep learning methods were used for quality improvement in CBCT image domain, including CycleGAN, Pix2pix, and U-Net model. The optimal parameters of deep learning models were trained in a training set of 135 NPC patients and then tested the performance in a testing cohort of 34 NPC patients. The Mean Absolute Error (MAE), Root Mean Squared Error (RMSE), Peak Signal to Noise Ratio (PSNR), and Structural Similarity Index (SSIM) were used to quantify the accuracy of the proposed algorithm. Dose calculations were also performed to compare the quantitative gamma analysis between pCT and sCT based treatment plans.
Material and Methods
Data and Image Pre-Processing
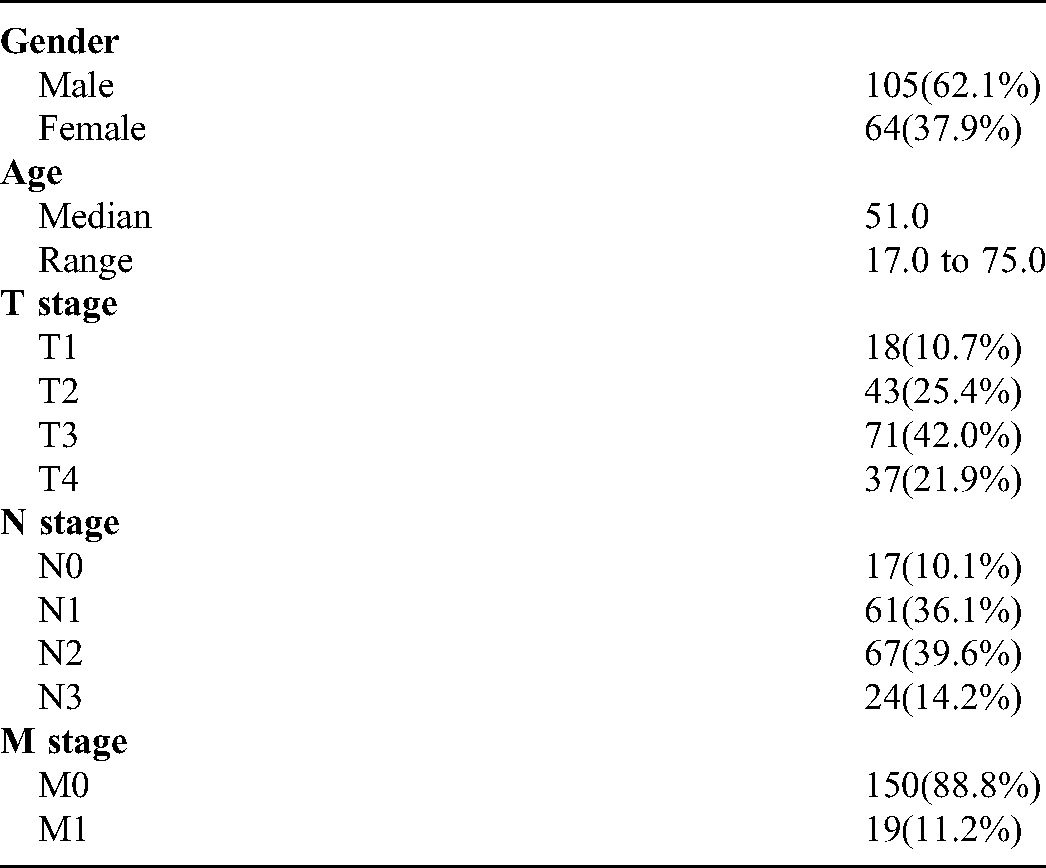
169 nasopharyngeal carcinoma patients treated in Hubei Cancer Hospital between January 2017 and December 2019 were retrospectively selected. The patient demographics are shown in Table 1. The CBCT images were acquired on a Varian Edge LINAC (Varian Medical System, Inc. Palo Alto, USA). The x-ray tube voltage and current used for CBCT scanning were 100 kV and 20 mA, respectively. The matrix size, resolution, and slice thickness of CBCT images were 512 × 512, 0.5112 mm, and 1.9897 mm, respectively. In order to reduce the difference between the planning CT(pCT) and CBCT, only the first fraction CBCT scans before treatment of all patients were included. The pCT simulations were acquired on a Philips Brilliance CT Big Bore scanner (Philips Healthcare) with a tube voltage of 120 kV. During CT simulation, patients were immobilized in supine position with a thermoplastic mask and underwent contrast-enhanced CT scan. The original matrix size, pixel size, and slice thickness of pCT were 512 × 512, 1.1719 mm × 1.1719 mm, and 3 mm respectively. A rigid registration was performed to align pCT images with the CBCT images. Hence, the registered pCT images had the same pixel size and thickness with corresponding CBCT images.
Demographics of Enrolled NPC Patients
In image pre-processing process we used a binary body mask to separate the body area from external structures such as treatment couch and immobilization devices. The process was as follows: (1) the Otsu thresholding algorithm was applied to each CBCT and pCT images; (2) the body masks were generated after the small gaps or holes were filled with morphological closing operations; (3) all the pCT and CBCT images were multiplied by each corresponding body mask. The pixel values outside the body mask were replaced with an HU value of −1000. The intensity of both pCT and CBCT images were clipped to [−1000, 2000] HU, and then normalized to [−1, 1] range for training, validation and testing according to the formula:
Deep Learning Methods
U-Net model
We implemented a U-Net model in Keras package, 26 which consists of a contracting path via multiple max-pooling or convolution layers with strides over two, a symmetric expanding path via up-convolution and skip concatenation layers. In encoder and decoder structures, convolution-convolution-ReLU-BatchNormalization blocks were used. The loss function used in U-Net model was MAE loss. Adam optimizer was used with a initial learning rate of 0.001 for 100 training epochs, and the weight decay factor was 0.8.
Pix2pix model
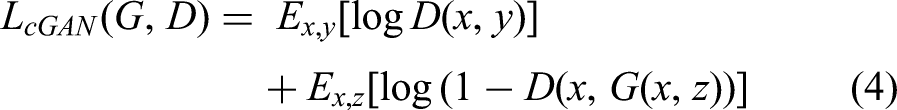
Pix2pix model consists of one generator (G) and discriminator (D) as shown in Figure 1(a) and (b). The Generator have a structure of encoder-decoder and concatenation operations like U-Net architectures. This structure includes a contracting path to capture context through 4 × 4 convolution with stride 2, a symmetric expanding path to localize features through up-sampling and concatenation operations. Convolution-InstanceNormalization-ReLU were used in encoder layers, and Up-sample -convolution-InstanceNormalization-ReLU were used in decoder layers. At the last layer, a convolution with stride 1 was applied to produce a 1-dimensional output. Figure 1(b) showed a 70 × 70 Patch GAN discriminator. The architecture was the same as the encoder in generator except for the first layer, as an Instance Normalization was not used in the first layer. All ReLUs activation functions were leaky ReLU with slope of 0.2. The loss function in Pix2pix combined a conditional GAN loss with L1 Norm loss as follows:


The structures of (a) generator and (b) discriminator used in Pix2pix and CycleGAN models; (c) the total architecture of CycleGAN model, including four generators and two discriminators, respectively.
CycleGAN Model
As one member of GAN family, CycleGAN is committed to convert one image domain to another without paired training examples, such as grayscale to color, image to sematic labels. 19 CycleGAN is a circular structure consisting of four generators and two discriminators, as shown in Figure 1(c). The architecture of CycleGAN was as follows:(1) Generator G imported CBCT images and generates sCT domain images; (2) Generator F outputted CBCT images with CT images inputting; (3) Discriminators DCBCT aimed to distinguish synthetic CBCT images from real ones; (4) and Discriminators DCT also aimed to distinguish fake CT domain images from real ones. The Generator G and F, Discriminators DCBCT and DCT had the structures similar to those of Pix2pix model.
The full objective in CycleGAN model included two categories of terms: adversarial losses for matching the distribution of the generated images with the data distribution of source domain; and cycle consistency losses to ensure the transferring style by mapping G and F to be consistent. The loss function of adversarial losses was designed as follows: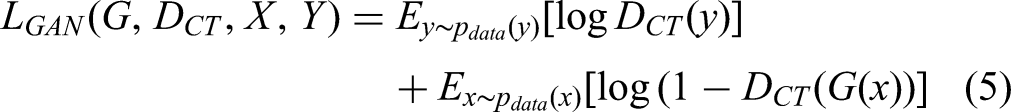
As Zhu et al.
19
pointed out that the input X can't be guaranteed to match the desired Y target by using the adversarial loss alone. In other words, after you convert the picture of X to Y space, you should be able to convert it back. This prevents the model from converting all pictures of X to the same picture in Y space. So the cycle consistency loss was proposed to reduce the random mapping probabilities:
Another identity mapping loss was introduced to preserve the HU value between input and output, which means that if the Generator G is defined as generating CT images from CBCT images, when we feed G with pCT images, the output should be near CT image domain as well: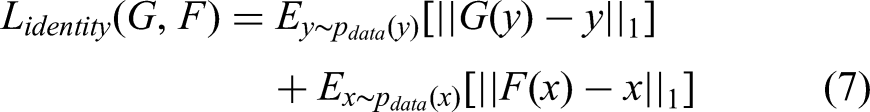

Training process
Of the 169 patients, 135 patients were chosen as the training and validation set, and the remaining 34 patients acted as testing set. The aligned pCT images by rigid transformation were taken as the reference data. The Adam optimizer was used in Pix2pix and CycleGAN with initial learning rate of 0.0002 in the first 50 epochs, and linearly decaying the rate to zero over the next 50 epochs. The two models were implemented in Python using the Pytorch package 27 on a supermicro workstation with Intel Xeon Processor E5-2695 CPU and an NVIDIA Tesla V100 GPU with 16 GB memory.
Evaluation
In this study, four metrics including Mean Absolute Error (MAE), Root Mean Squared Error (RMSE), Peak Signal to Noise Ratio (PSNR), and Structural Similarity Index (SSIM) were used to evaluated the HU and anatomical accuracy between sCT images and pCT images.MAE is the mean sum of absolute differences between actual and predicated values. Ideal value of MAE would be 0. The function is as follows:


Dosimetric evaluation
Dose calculation was performed on pCT images and sCT images on Eclipse treatment planning system (TPS) for 4 NPC patients. Before dose calculation, the contours of OARs and target of tumor were mapped to sCT images from pCT images via deformable registration. The dose was calculated on pCT images firstly, and then the same treatment plan was copied over to sCT images. The dose was recalculated on sCT images by following the same fluence. The dose volume histogram (DVH) metrics between two plans were compared.2D gamma index analysis wasalso compared at 3 mm/3%, 3 mm/2%, 2 mm/3% and 2 mm/2% with 10% dose threshold.
Results
Figure 2 shows the transverse, sagittal and coronal orientation of original CBCT, pCT, sCT-CycleGAN, sCT-Pix2pix, sCT-U-Net images from one selected patient. From the figure, we can see that the sCT images generated by using three deep learning methods had less artifacts and noise, and kept the overall anatomy of original CBCT at the same time. Quantitative evaluations for HU accuracy are shown in Table 2 including MAE, RMSE, PSNR and SSIM metrics. The average MAE values between sCT by U-Net, Pix2pix, CycleGAN models and pCT were 26.8 ± 10.0 HU, 24.3 ± 8.0 HU, 23.8 ± 8.6 HU, comparing to 42.2 ± 17.4 HU for CBCT and pCT. The mean RMSE values obtained from three models decreased to 107.5 ± 24.7 HU, 83.5 ± 18.7 HU, 79.7 ± 20.1 HU from 134.3 ± 31.0 HU of original CBCT too. As for the SSIM and PSNR metrics, the mean values increased to 29.1 ± 1.7, 31.3 ± 1.9, 37.8 ± 2.1 from original 27.2 ± 1.9, and 0.94 ± 0.01, 0.95 ± 0.01, 0.96 ± 0.01 from original 0.91 ± 0.03, respectively. Among these deep learning models, CycleGAN model achieved smaller MAE, RMSE and higher PSNR and SSIM values compared to other two models on average. Nonetheless, these deep learning models could improve the HU accuracy and reduce artifacts significantly compared to original CBCT images.

The transverse, sagittal and coronal visualization of (a) original CBCT, (b) pCT, (c) sCT by CycleGAN, (d) sCT by Pix2pix and (e) sCT by U-Net models from one selected NPC patient. Display window is [−160, 240] HU.
Evaluation Metric Values Obtained by Different Deep Learning Network Models for Generation of sCT Images.

The difference images between sCT images and pCT images were plotted in Figure 3. The bottom row images in Figure 3 demonstrate that there was less difference between sCT and pCT as compared to the difference between corresponding CBCT images and pCT images. The typical line HU profile of one patient is shown in Figure 4 which passed through soft tissue and bone structures. From Figure 4(a) the HU profile in CBCT image was noisy and inaccurate, while the HU values in sCT images by three models displayed the improvement of HU smoothness and accuracy. However, some local details of soft tissue in sCT images by U-Net model were not as clear and rich as that of CycleGAN and Pix2pix models, as shown in Figures 3 and 4.

Difference map between sCT images generated by different models and pCT. Display window [−160, 240] HU

Comparison of HU profiles (the second row) of the pink lines on different images as shown in the first row. Display window is [−160, 240] HU.
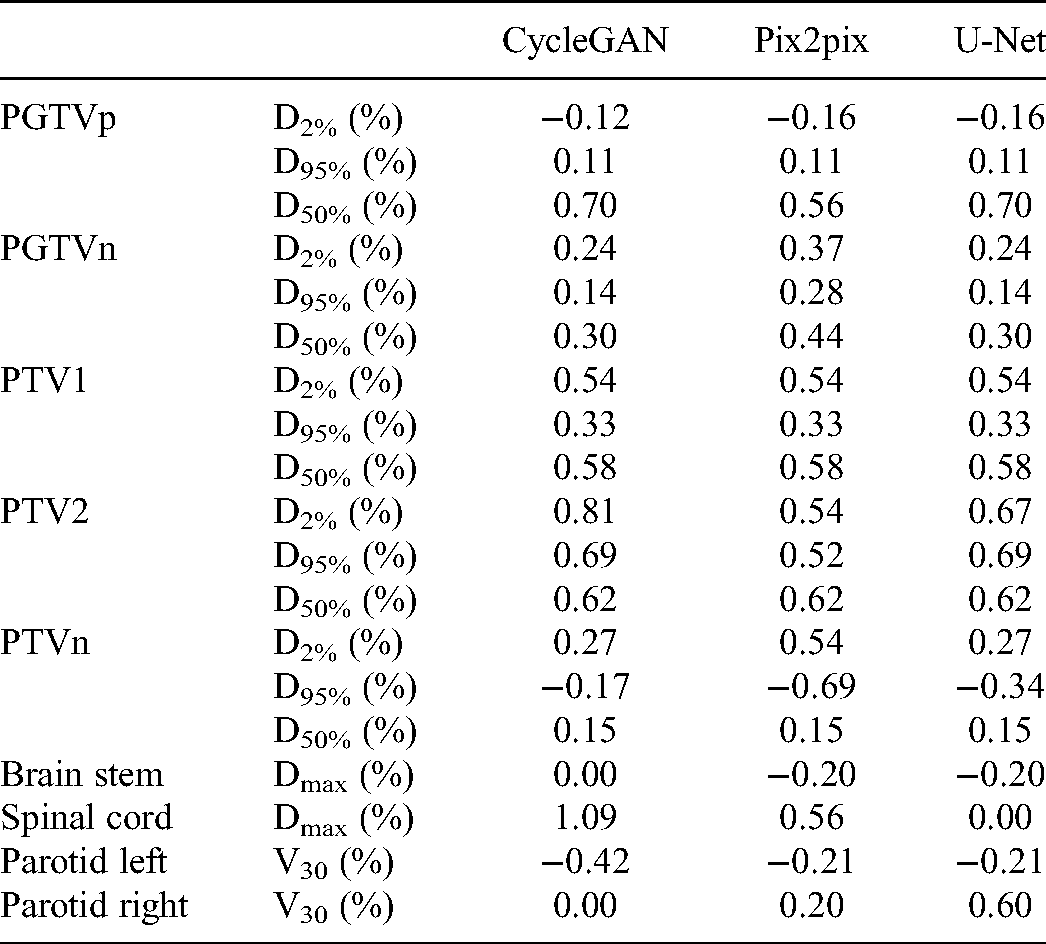
Figure 5 shows the 3D dose distribution of one NPC patient on pCT, sCT-CycleGAN, sCT-Pix2pix, and sCT-U-Net based treatment plans. The transverse, sagittal and coronal planes are displayed from first to third rows. In the dose visualization, the dose distribution of the three synthetic CT based plan were much close to that of pCT plan. The DVH of selected contours between different plans were plotted in Figure 6. There are some slight differences for PGTVp, PTV1 and PTV2 while the maximum dose differences of PGTVn are relatively larger. However, the OARs almost have the same DVH between the two plans. The deviation of the DVH metrics for PTVs and OARs are summarized in following Table 3. The deviation was calculated as follows:

Dose distributions comparison of pCT and synthetic CT based treatment plans.

Comparison of the DVH between pCT and sCT-CycleGAN based plans in one NPC patient. The circled lines, squared lines, triangle lines and diamond lines represent the DVH of plan based on pCT, sCT-CycleGAN, sCT-Pix2pix, and sCT-U-Net, respectively.
The Deviation for Selected Regions of Interest by Different Models from the Same Patient of Figure 6.
Preserving the anatomical structures is significant for image generation problem. In Figure 7 (a) and (b), a case of difference in anatomy was displayed maybe due to the long interval between pCT and CBCT scanning. In order to observe the anatomical changes clearly, a red minimum bounding rectangle of body contour in CBCT was also applied on other four images. The sCT-CycleGAN and sCT-Pix2pix shared the nearly same outer body contour with original CBCT, while the outer anatomical body of U-Net model changed. In addition, a yellow bounding box showed the same region of muscle on different images. The sCT-CycleGAN show the same structures with pCT, and the Pix2pix and U-Net models showed the white fake structures. The comparison results demonstrated that the unpaired deep learning methods ie CycleGAN models could preserve the anatomical structures better.

Visualizations of neck regions on (a) CBCT, (b) pCT, (c) sCT-CycleGAN, (d) sCT-Pix2pix and (e) sCT-U-Net. The red bounding boxes represented minimum bounding rectangle of original CBCT body contour. The yellow bounding box showed the same region of muscle on different images.
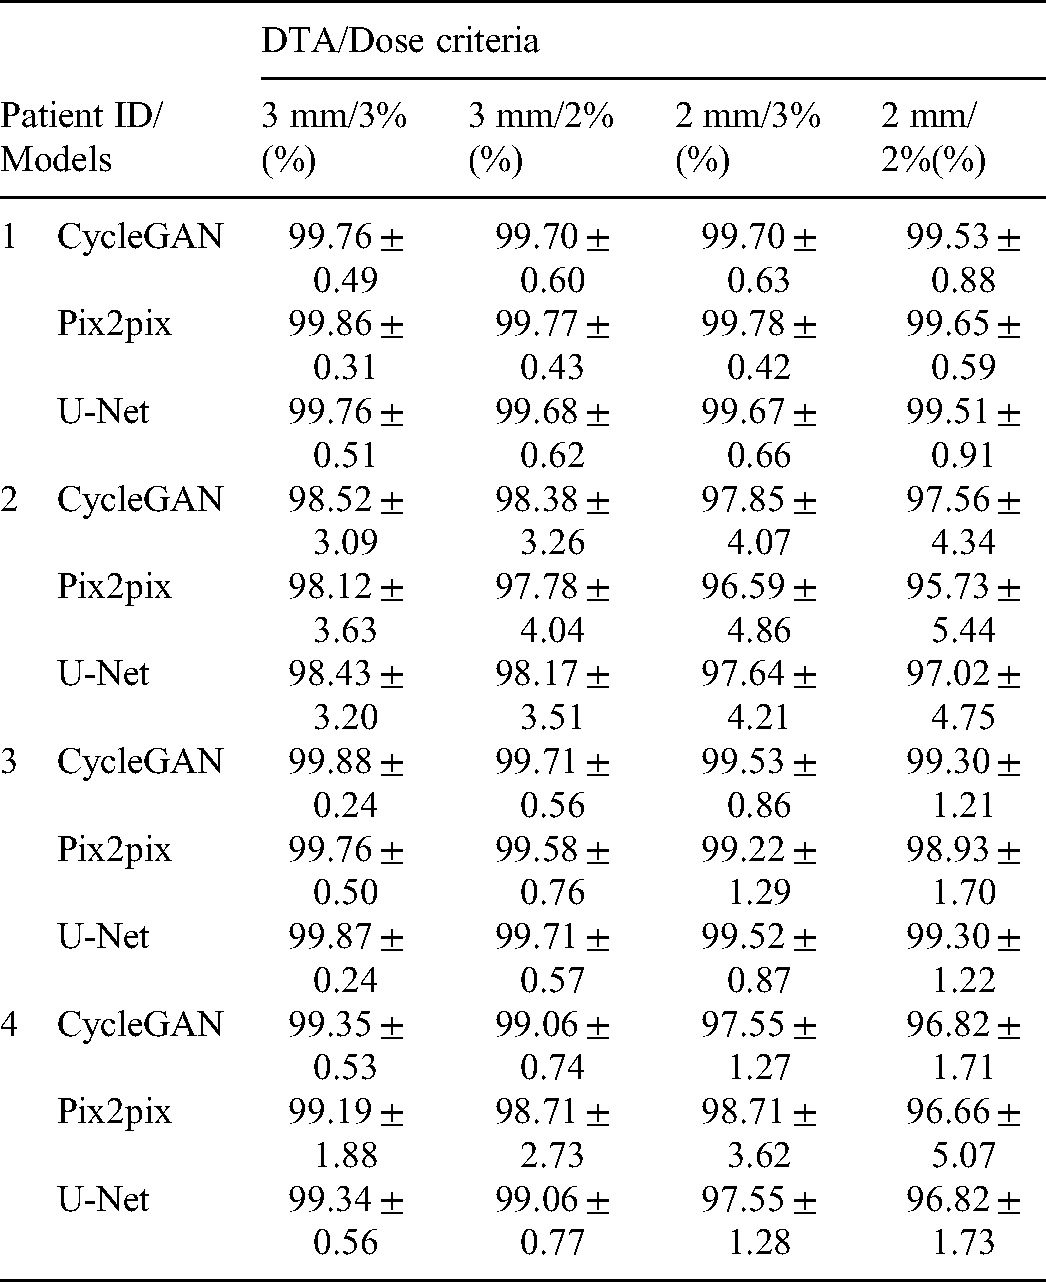
Gamma Index Evaluation for Dose Distribution Based on sCT-CycleGAN, sCT-Pix2pix, and sCT-U-Net Treatment Plans Compared to that of pCT Plans. The Percent Numbers are Mean Passing Rates and sTandard Deviations of Gamma Index.
Discussion
In this study we generated the sCT images using three deep learning methods, which learned the mapping functions from original CBCT images and corresponding pCT images. The visual and quantitative results showed that the noise and artifacts had been significantly restrained. The average MAE and RMSE values between sCT by different models and pCT reduced by 15.36 HU and 26.78 HU at least, while the mean PSNR and SSIM metrics between sCT by different models and pCT increased by 10.57 and 0.05 at most, respectively. Though all the sCT had achieved better evaluation metrics than those of CBCT, the performance of CycleGAN model was proved to be best among three methods.
There are many imaging artifacts in CBCT currently.5,6 According to the source of artifacts, these artifacts can be divided into the following three categories: (a) the noise, ring, hardening and scattering artifacts were due to the inaccuracy of projection data received by the detector;(b) patient-based artifacts include motion and metal artifacts;(c) incomplete projection data usually lead to streak and truncation artifacts. In this study, we didn't analyze the source of artifacts, and just fed the deep learning models with original CBCT images as input and pCT images as output. After the training process, the complicated nonlinear mapping functions between CBCT (with artifacts) and pCT(less artifacts) images were built. The new incoming CBCT images would be transformed to sCT images for dose calculation by using these mapping functions, ie CycleGAN, Pix2pix, and U-Net deep learning models.
In our clinic most head-and-neck scans range from −180 deg to 20 deg in Elekta infinity LINACs and Varian LINACs. Image-to-image translation is a class of vision and graphics problems where the goal is to learn the mapping between an input and an output image. The AI function greatly depends on how effectively the leaning algorithm function performs. 16 Proper deep learning models and image datasets could be performed to fix an incomplete CBCT image set. In this study, we performed unsupervised and supervised deep learning methods to train the generation models with the same training and testing cohort. All the sCT had achieved better evaluation metrics than those of CBCT. The MAE, RMSE, PSNR and SSIM evaluation metrics of Pix2pix models were comparable with those of CycleGAN model, while the quantitative results of U-Net model were worse than the previous two models. The visualizations also proved that, as shown in Figure 7. The sCT-CycleGAN showed the more similar structures to pCT than the Pix2pix and U-Net models. The reason was possibly due to the use of contrast enhanced pCT, which led to high HU value of cervical lymph node. The comparison results demonstrated that the unpaired deep learning methods ie CycleGAN models could preserve the anatomical structures better. Therefore, even the CBCT image set is not complete and missed some portions, the deep learning method can fix an incomplete CBCT image set.
For the HU matching between CBCT and pCT, it requires different calibrations on the CT-sim and CBCT scanner. In our study, the two kinds of CT images were pre-processed during the same procedure. Thus, the input and output images were normalized to the same intensity range, regardless of the absolute pixel values. After the normalized synthetic CT images were predicted by the CNN models, we can deduce the true value of each pixel in the synthetic images according to the equations and the input CBCT images.
The objective in this study is to generate sCT images from CBCT images to calculate radiation dose accurately. The universal tolerance limits for IMRT and VMAT QA analysis were ≥95% gamma passing rates with 3%/2 mm and a 10% dose threshold according to AAPM TG 218. 29 Our results showed that passing rates under 3 mm/3% 3 mm/2%, 2 mm/3%and 2 mm/2% criteria were all higher than 95%. Thus, the HU mapping through the deep learning methods were available. The sCT images by three deep learning methods are capable for accurate dose calculation for future adaptive radiotherapy.
Although the CycleGAN deep learning methods has achieved the best improvement of image quality, there were still several limitations. Firstly, there were some fake structures in sCT images, especially in the region of cervical lymph node. Replacing the pCT images with no contrast enhanced ones as training dataset for deep learning model may eliminate these fake structures, and thus improve the dose calculation accuracy. Secondly, since medical images were 3 dimensional, the continuity of anatomical structures was crucial for image generation. 3D convolutional neural networks were usually employed for medical images analysis. Due to the computation limitation, we can't perform 3D CycleGAN training yet with whole image as input. Thirdly, although the dose calculation based on sCT by deep learning methods was comparable with that based on pCT, there were still some problems in the segmentation task on sCT. In particular, some unexpected fake structures could significantly reduce the segmentation accuracy. Future work includes applying the deep learning method to distinguish true and fake structures, and further improving the accuracy of image generation and segmentation.
Conclusion
In this study we proposed to use supervised and unsupervised deep learning methods to generate sCT images from CBCT and pCT for dose calculation, including CycleGAN, Pix2pix and U-Net models. All the sCT had achieved better evaluation metrics than those of original CBCT, while the performance of CycleGAN model was proved to be best among three methods. The dosimetric agreement confirmed the accuracy of HU and consistent anatomical structures of sCT. The sCT by deep learning models can be used for further ART planning in clinical practice.
Footnotes
Acknowledgements
The authors would like to thank Dr. Xiao Wang for fruitful discussion and English editing, who is from Rutgers-Robert Wood Johnson Medical School.
Conflict of Interest Statement
The authors declare that they have no competing interests.
Funding
This study was supported by the National Natural Science Foundation of China (No. 12075095), the Natural Science Foundation of Anhui Province (No. 1808085QH281), the Fundamental Research Funds for the Central Universities (No. WK9110000127), the Health Commission of Hubei Province scientific research project (No. WJ2021M192).