
Abstract
Introduction
We introduce a standardized necrosis rate—percent reduction in enhancing tumor diameter normalized by baseline tumor diameter—with a threshold of ≥30%. This endpoint is derived from the mRECIST partial response criteria but is normalized to mitigate tumor size-dependent bias. A clinical–radiomics model was developed to assess necrosis in hepatocellular carcinoma (HCC) patients treated with transarterial chemoembolization (TACE).
Methods
Retrospectively, 95 HCC patients undergoing TACE were included. Radiomics features were selected via LASSO regression, and clinical variables via logistic regression. Separate radiomics and clinical models were developed, and a combined model was constructed using multivariable logistic regression. The cohort was randomly split into training (70%) and validation (30%) sets, with all preprocessing, feature selection, and model training confined to the training set to prevent data leakage. Model performance was evaluated using discrimination (AUC), calibration, clinical utility (decision curve analysis), and a nomogram.
Results
From 1,316 extracted radiomics features, six were retained for Rad-score calculation. Key clinical predictors included hepatitis group, standardized viable tumor ratio, and vascular invasion. The integrated model achieved AUCs of 0.865 (95% CI: 0.768–0.961) in training and 0.853 (95% CI: 0.716–0.990) in validation (n=29), outperforming the clinical model (AUCs: 0.808 (95% CI: 0.695-0.922) and 0.666 (95% CI: 0.465-0.866), respectively). Decision curve analysis and calibration plots confirmed the combined model’s superior performance.
Conclusion
The radiomics–clinical nomogram, based on a standardized necrosis rate, may enable early prediction of TACE response, offering potential insights for therapeutic decision-making, risk stratification, and liver transplantation management. External validation is warranted before clinical application.
Keywords
1. Introduction
Hepatocellular carcinoma (HCC) is a leading cause of cancer-related mortality worldwide, characterized by significant biological heterogeneity and aggressive behavior, with the majority of patients being ineligible for curative surgery at the time of diagnosis. 1 For patients with unresectable intermediate-to-advanced HCC, transarterial chemoembolization (TACE) serves as the first-line locoregional treatment. Additionally, TACE is often employed as a bridging or downstaging strategy for liver transplantation, aiming to control tumor progression during the waiting period and optimize transplant eligibility and post-transplant outcomes. 2 TACE induces ischemic tumor necrosis through a combination of embolic and chemotherapeutic effects, thereby reducing the viable tumor burden.3,4
The evaluation of therapeutic efficacy directly impacts waiting list management and transplantation timing. Traditionally, the response to treatment is assessed using RECIST 1.1, which considers only changes in maximal tumor diameter. However, this metric inadequately reflects tumor necrosis and microenvironmental changes. To address this, mRECIST focuses on reductions in arterial-phase enhancement, aligning more closely with the actual mechanism of TACE. According to mRECIST, complete response (CR) is defined as the absence of any enhancing tissue, while partial response (PR) is a reduction of at least 30% in the longest dimension of the enhancing area. The combined CR and PR responses constitute the “Objective Response” (OR) endpoint.5-7 Although mRECIST is widely adopted, its limitations arise from its subspecialized, unidimensional approach, which fails to consider overall tumor burden and structural heterogeneity. Moreover, accumulating evidence indicates that overall tumor burden significantly influences post-TACE prognosis, with larger or more numerous tumors correlating with poorer outcomes.8-10 The limitations of unidimensional assessment have prompted the development of more advanced, volumetric response criteria that aim to capture the three-dimensional tumor burden more comprehensively. Among these, volumetric RECIST (vRECIST) quantifies the total volume of the entire tumor, providing a more accurate measure of tumor size change than single-directional diameter. A more refined approach, quantitative EASL (qEASL), goes a step further by specifically measuring the three-dimensional volume of the arterial-enhancing (viable) tumor tissue. For instance, quantitative tumor burden analysis(via 3D enhancing tumor volume) has been shown to be a biomarker for survival in patients undergoing intra-arterial therapies for liver metastases. 11 While these volumetric methods provide a superior assessment of tumor response, their widespread clinical adoption is currently hampered by requirements for specialized segmentation software, significant time investment, and a lack of standardized, fully automated workflows.
Previous studies have demonstrated that combining imaging response with tumor dimensions can successfully categorize recurrence risk following transplantation. 12 In clinical practice, the ability to predict whether a patient will achieve an OR early in the postoperative stage would facilitate reinforcement of bridging or downstaging treatments, timely adjustments to therapeutic strategies, and more flexible scheduling for those likely to respond well, thereby enhancing individualized candidate management.
To address these challenges, this study established a novel necrosis rate endpoint, calculated as the reduction in enhancing volume normalized by baseline tumor diameter. This approach aims to bridge the gap between simplistic unidimensional criteria and complex volumetric analyses. A necrosis rate of ≥ 30% was defined as the threshold for a significant treatment response, and a nomogram integrating clinical variables and radiomics features was developed. This model may enable individualized predictions of post-TACE necrosis rate, thereby enhancing the accuracy and reliability of efficacy assessments while also providing valuable guidance for the selection and timing of liver transplantation candidates. This endpoint is exploratory and analytically distinct from mRECIST PR.
2. Methods
2.1. Patient Cohort
This study was a retrospective analysis based on the HCC-TACE-Seg dataset from The Cancer Imaging Archive (TCIA; https://doi.org/10.7937/TCIA.5FNA-0924). 13 The original dataset represents a retrospectively collected cohort, the original data collection and imaging acquisition are described in the primary publications.14,15 This retrospective analysis included 95 patients with HCC from the aforementioned dataset who underwent initial TACE at the University of Texas MD Anderson Cancer Center from 2002 to 2012. In alignment with the research objective, we applied the following inclusion criteria: undergoing the first TACE session as the sole first-line or bridging therapy for HCC; contrast-enhanced CT images were available both before and after TACE, with pre-treatment scans obtained within 1–12 weeks prior to the procedure (mean interval approximately 3 weeks) and post-treatment scans acquired within 14 weeks after TACE (median interval 9.0 weeks; interquartile range, 7.0–11.9 weeks). Exclusion criteria included: incomplete imaging or clinical data; missing or only a single post-treatment tumor diameter measurement; presence of multiple HCC lesions, ensuring that necrosis rate calculations were based on a single index tumor.
Ethical approval or patient consent for this study was waived because it analyzed pre-existing, anonymized data from a public repository (the HCC-TACE-Seg dataset). All data were fully de-identified and publicly available. The original data collection was approved by the University of Texas MD Anderson Cancer Center institutional review board (IRB) with informed consent waiver. The reporting of this study conforms to the STROBE statement. 16
2.2. Image Acquisition and Feature Extraction
All CT scans were performed on 16- or 64-detector GE LightSpeed scanners using a dedicated liver protocol (120–140 kVp, 150–630 mA, section thickness 0.63–5 mm, a standard reconstruction kernel, pitch 0.9–0.98, rotation 0.4–0.8 s, FOV 360–460 mm). Pre-contrast, arterial (17 s after aortic peak), portal-venous (60 s), and delayed (150 s) phases were obtained. Pre-treatment CT images were manually segmented by experienced radiologists using 3D Slicer software (version 5.6.2), with careful delineation of tumor lesions and surrounding anatomical structures. Regions of interest (ROIs) were contoured following a standardized protocol and reviewed by a consensus of multiple experts to ensure consistency in segmentation. Image analysts were blinded to clinical outcomes. All image preprocessing and feature extraction steps were conducted in compliance with the Image Biomarker Standardisation Initiative (IBSI) guidelines to ensure reproducibility. Radiomics feature extraction was conducted using PyRadiomics (v3.0.1) in 3D Slicer (v5.6.2). The extraction protocol employed linear interpolation for resampling to a 1.0 mm3 isotropic voxel size and a fixed bin width of 25 HU for gray-level discretization. Features were extracted from the following classes: First-order, Shape (2D & 3D), GLCM, GLRLM, GLSZM, GLDM, and NGTDM. Texture was enhanced using Laplacian of Gaussian (LoG) filters (sigma: 1.0, 2.0, 3.0, 4.0, 5.0 mm) and wavelet transformations. All features were Z-score normalized prior to modeling to harmonize scale differences and enhance model stability. The normalization parameters (mean and standard deviation) were calculated solely on the training set and then applied to the validation set.
2.3. Outcome Variable and Derived Metrics
The cohort was randomly divided into a training set (n = 66) and an internal validation set (n = 29) in a 7:3 ratio. The study endpoint was defined as the post-TACE necrosis rate, dichotomized as necrosis ≥ 30% or < 30%. A necrosis rate ≥ 30% was classified as an OR. The necrosis rate was assessed based on change in the longest diameter of enhancing region of the single index lesion, according to the “modified Response Evaluation Criteria in Solid Tumors” (mRECIST).
17
Three radiologists independently measured tumor diameters (d1: pre-treatment enhancing tumor region; d2: post-treatment enhancing region), and the average measurement was used. The necrosis rate was calculated as follows:

Where D1 is the baseline longest diameter of the single index lesion. This normalization by baseline longest diameter helps mitigate enhancement-related bias. All measurements followed standardized procedures to ensure consistency. The inter-observer agreement for manual measurements of tumor diameters (d1 and D1) was quantified using the intraclass correlation coefficient (ICC), which was 0.953 (95% CI: 0.93 to 0.97). Bland-Altman analysis quantified the measurement variability, revealing a mean difference of -2.60 mm and 95% limits of agreement from -48.80 mm to 43.60 mm.
Derived variables included:
Standardized viable tumor ratio (d1_D1_ratio_std): the ratio ‘r = mean(d1)/mean(D1)’ was calculated, and then was standardized, calculated as [r – mean(r)]/sd(r). As shown in Figure S2.
2.4. Predictor Selection and Predictive Model Development
All preprocessing steps were confined to the training set to prevent data leakage and overfitting.
2.4.1. Clinical Model
A univariate analysis was initially conducted for all candidate clinical variables to evaluate their association with a necrosis rate ≥ 30%, using logistic regression. Candidate clinical variables included Barcelona Clinic Liver Cancer (BCLC) stage, tumor nodularity, vascular invasion, Child–Pugh classification score (CPS), cirrhosis evidence, portal vein thrombosis, hepatitis group, tumor involvement, Cancer of the Liver Italian Program (CLIP), Okuda classification, TNM stage, diabetes, BCLC performance status, metastasis, lymph node involvement, serum alpha-fetoprotein (AFP) level, age, and standardized viable tumor ratio (d1_D1_ratio_std). Patients were classified as ‘infected’ if they had HBV, HCV, or co-infection, and as ‘non-infected’ in the absence of both. Variables from the univariate analysis with a P-value < 0.1 were included in a multivariable logistic regression model, which utilized backward stepwise elimination based on the Akaike Information Criterion (AIC) 18 to determine the optimal set of clinical predictors.
2.4.2 Radiomic Model
Candidate radiomics features were screened using parametric (Student’s t-test) or non-parametric tests (Mann-Whitney U test), depending on their distribution. This univariate screening was performed only within the training set. Given that conventional multiple testing correction using the False Discovery Rate (FDR) at α=0.05 may prove too conservative and select no features in our high-dimensional setting, we employed a two-stage strategy. This involved initial univariate screening without correction, followed by final feature selection using the least absolute shrinkage and selection operator (LASSO) with L1 regularization to mitigate overfitting. 19 The optimal regularization parameter λ was determined through five-fold cross-validation, and variables with non-zero coefficients were selected as key predictors. A radiomics signature, referred to as the Rad-score, was computed for each patient in the study cohort to quantify the collective contribution of the selected imaging features. This feature selection strategy is widely recommended for high-dimensional data analysis due to its stability and interpretability. Additionally, the distribution of Rad-scores was compared between patients with necrosis ≥ 30% and < 30% within each cohort.
2.4.3. Combined Model
Clinical variables and Rad-score were integrated using the lrm function from the R package rms to construct a multivariable logistic regression model. The final model was presented as a nomogram using the nomogram() function, which visually represents the model and facilitates individualized probability estimation.
2.5. Model Assessment
2.5.1. Discrimination
Discrimination was assessed using the area under the receiver operating characteristic (ROC) curve (AUC) for the clinical, radiomic, and combined models, with performance differences compared using DeLong’s test or the likelihood ratio test (LRT).
2.5.2. Robustness Assessment
To internally validate the model and address potential optimism due to the sample size, multiple bootstrap techniques were employed. First, optimism correction was performed on the training cohort using 1000 bootstrap samples to obtain a bias-corrected estimate of performance. Second, to evaluate the stability of the validation set performance estimate (n = 29), a non-parametric bootstrap procedure with 1000 replications was conducted. Finally, post-hoc calibration of the validation set predictions was carried out using the Platt scaling method.
2.5.3. Calibration
Calibration was evaluated through calibration curves generated by bootstrap resampling (1,000 iterations). The calibrated probabilities were regressed against the original linear predictor to estimate the calibration slope and intercept. The 95% confidence intervals for the slope and intercept were derived from the standard errors of this regression model. The maximum absolute difference between the calibration curve and the ideal 45°line (denoted E_max) was reported as a measure of the overall calibration error.
2.5.4. Sensitivity Analysis
To evaluate the robustness of the model to variations in the endpoint definition, sensitivity analyses were conducted. The performance of the pre-trained combined model (developed using the ≥30% necrosis threshold) was assessed under two scenarios: using alternative dichotomous thresholds (≥50% and ≥70%) for the necrosis rate; and treating the necrosis rate as a continuous outcome variable. For the continuous outcome, a linear regression model was fitted using the same predictors as in the combined model.
2.5.5. Clinical Applicability
Clinical applicability was determined through Decision Curve Analysis (DCA), which measures net clinical benefit across various probability thresholds. The clinical context is the management of patients receiving TACE as a bridging or downstaging therapy, where the primary goal is to preserve liver function while identifying candidates suitable for subsequent curative treatments (e.g., surgery or transplantation). Two decision pathways are modeled: when the model-predicted probability of a necrosis rate ≥30% was low, suggesting potentially insufficient initial TACE response, clinicians might opt for treatment intensification (e.g., combining with local ablation, radiotherapy, or initiating systemic therapy) to control tumor progression. Conversely, a high predicted probability would support continuing the planned TACE course, as effective TACE is crucial for achieving bridging or downstaging objectives. The threshold probability represents the minimum probability at which a clinician would choose to switch from “continuing the planned course” to “pursuing intensified treatment.”The full threshold range from 0 to 1.0 (in increments of 0.01) was evaluated and interpretation on the clinically reasonable range of 0.10 to 0.80 was focused. This range was selected because a probability below 10% indicates a very low likelihood of response, rarely justifying TACE alone, while a probability above 80% signifies a high likelihood of benefit, making the decision to continue the planned course a clear consensus with little need for model guidance.
The clinical utility of the combined model was further quantified using net reclassification improvement (NRI).
2.6. Statistical Analysis
The distribution of categorical variables was analyzed using the Chi-square test or Fisher’s exact test, as appropriate. For continuous variables, group comparisons were made using the independent samples t-test (for normally distributed data) or the Mann-Whitney U test (for non-normally distributed data). The events per variable (EPV) ratio in the training set was 10.75, which meets the commonly suggested minimum. Data quality was ensured by excluding variables with a high proportion (≥20%) of missing values, the final analysis was conducted on a complete-case basis, which had no missing data. A random seed was set (seed = 42) prior to data splitting and resampling to ensure reproducibility. Key software packages included R (version 4.5.0), Python (version 3.8.20), and PyRadiomics (version 3.0.1), with a significance threshold set at P < 0.05 for all two-tailed tests.
Potential biases were minimized through standardized inclusion criteria, blinded image analysis, and internal validation procedures.
3. Results
3.1. Baseline Characteristics
Baseline Characteristics of Patients in Training and Validation Cohorts

*Active tumor ratio (std): Standardized value of d1_D1_ratio (z-score).
3.2. Feature Selection and Model Construction
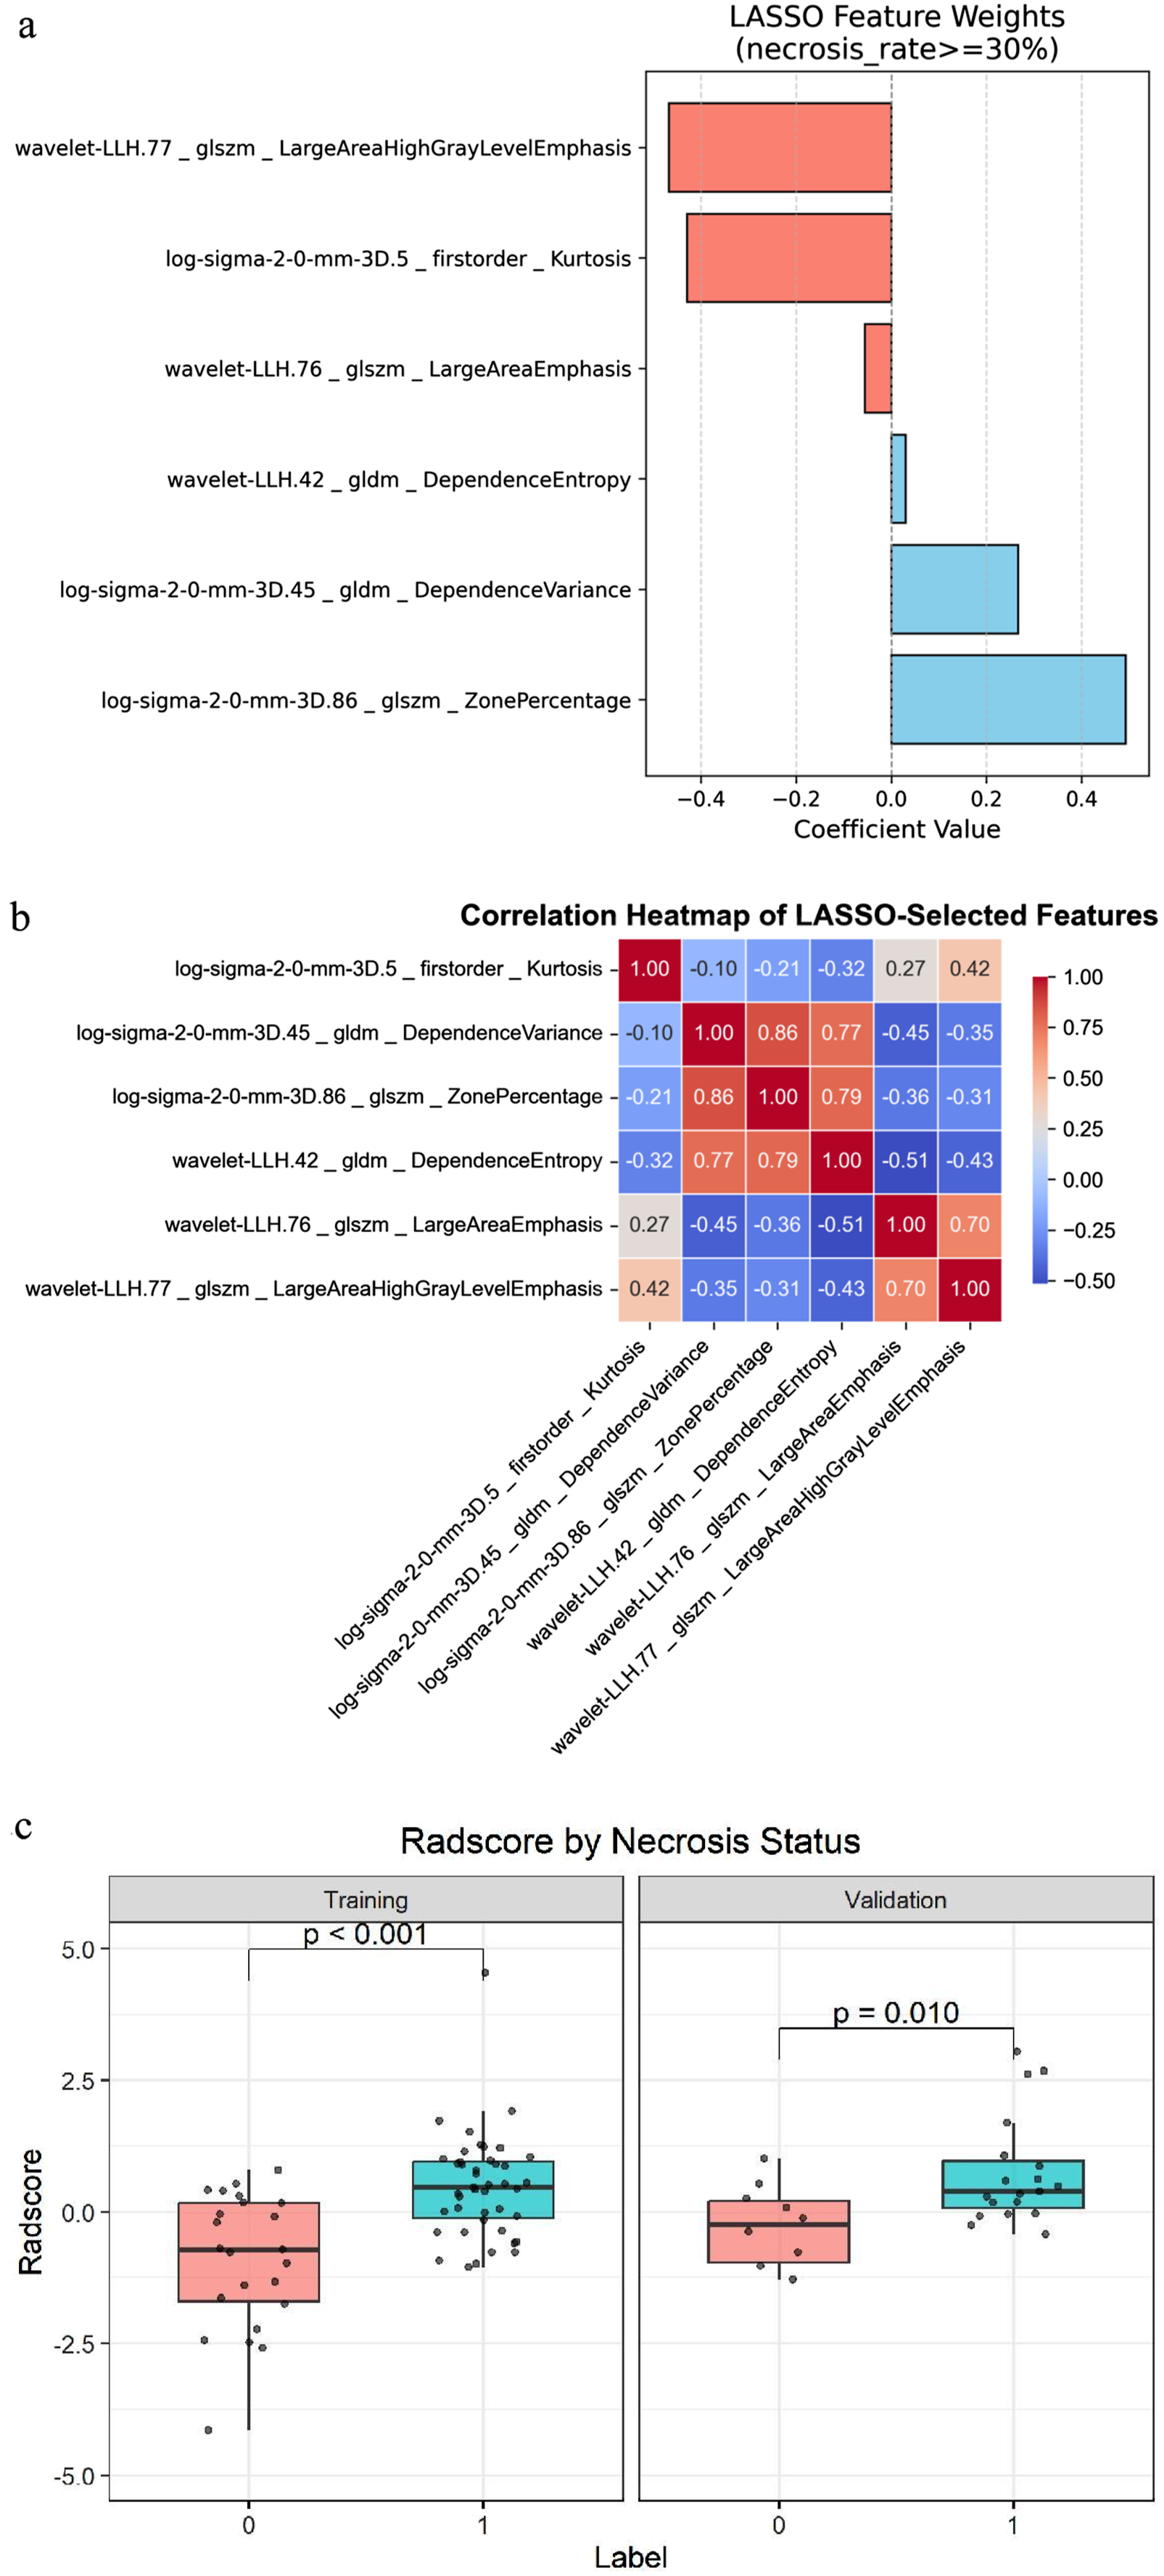
Following preprocessing, 1,316 standardized CT radiomic features were extracted. Initial univariate analysis identified the 30 features most strongly associated with the outcome. Subsequent LASSO regression selected six features with non-zero coefficients, encompassing first-order statistics, gray-level size zone matrix (GLSZM), and gray-level dependence matrix (GLDM) groups. These included: ‘log-sigma-2-0-mm-3D_firstorder_Kurtosis’ (abbreviated as K, indicating the peakedness of gray-level distribution tails), ‘wavelet-LLH_glszm_LargeAreaEmphasis’ (abbreviated as LAE, highlighting large homogeneous regions), ‘wavelet-LLH_glszm_LargeAreaHighGrayLevelEmphasis’ (abbreviated as LAHGLE, emphasizing large high-intensity zones), ‘log-sigma-2-0-mm-3D_gldm_DependenceVariance’ (abbreviated as DV, quantifying heterogeneity of dependence sizes), ‘log-sigma-2-0-mm-3D_glszm_ZonePercentage’ (abbreviated as ZP, the ratio of the number of zones to total voxels in the ROI), and ‘wavelet-LLH_gldm_DependenceEntropy’ (abbreviated as DE, measuring structural uncertainty or complexity) (Figure 1A and B; Figure 2A and B). The optimal regularization parameter C (1/λ) for LASSO was 0.616. The coefficients of the final six features are provided in Figure 2A. The Rad-score was computed as a linear combination of the selected features using the following formula: Rad-score = (0.030 × DE) + (-0.056 × LAE) + (0.267 × DV) + (-0.429 × K) + (-0.468 × LAHGLE) + (0.493 × ZP). Bootstrap stability analysis (100 resamples) showed that the six features had selection frequencies ranging from 30% to 81% (Table S1). As shown in Figure 2C, patients with necrosis ≥ 30% had significantly higher Rad-scores compared to those with necrosis < 30% in the training set (P < 0.001), with similar findings in the validation set (P = 0.010). These results validate that the Rad-score effectively stratifies necrosis response. LASSO regression model Summary visualization of LASSO-selected radiomics features.
Clinical Variables Selected by Univariate and MultivariableLogistic Regression Analysis

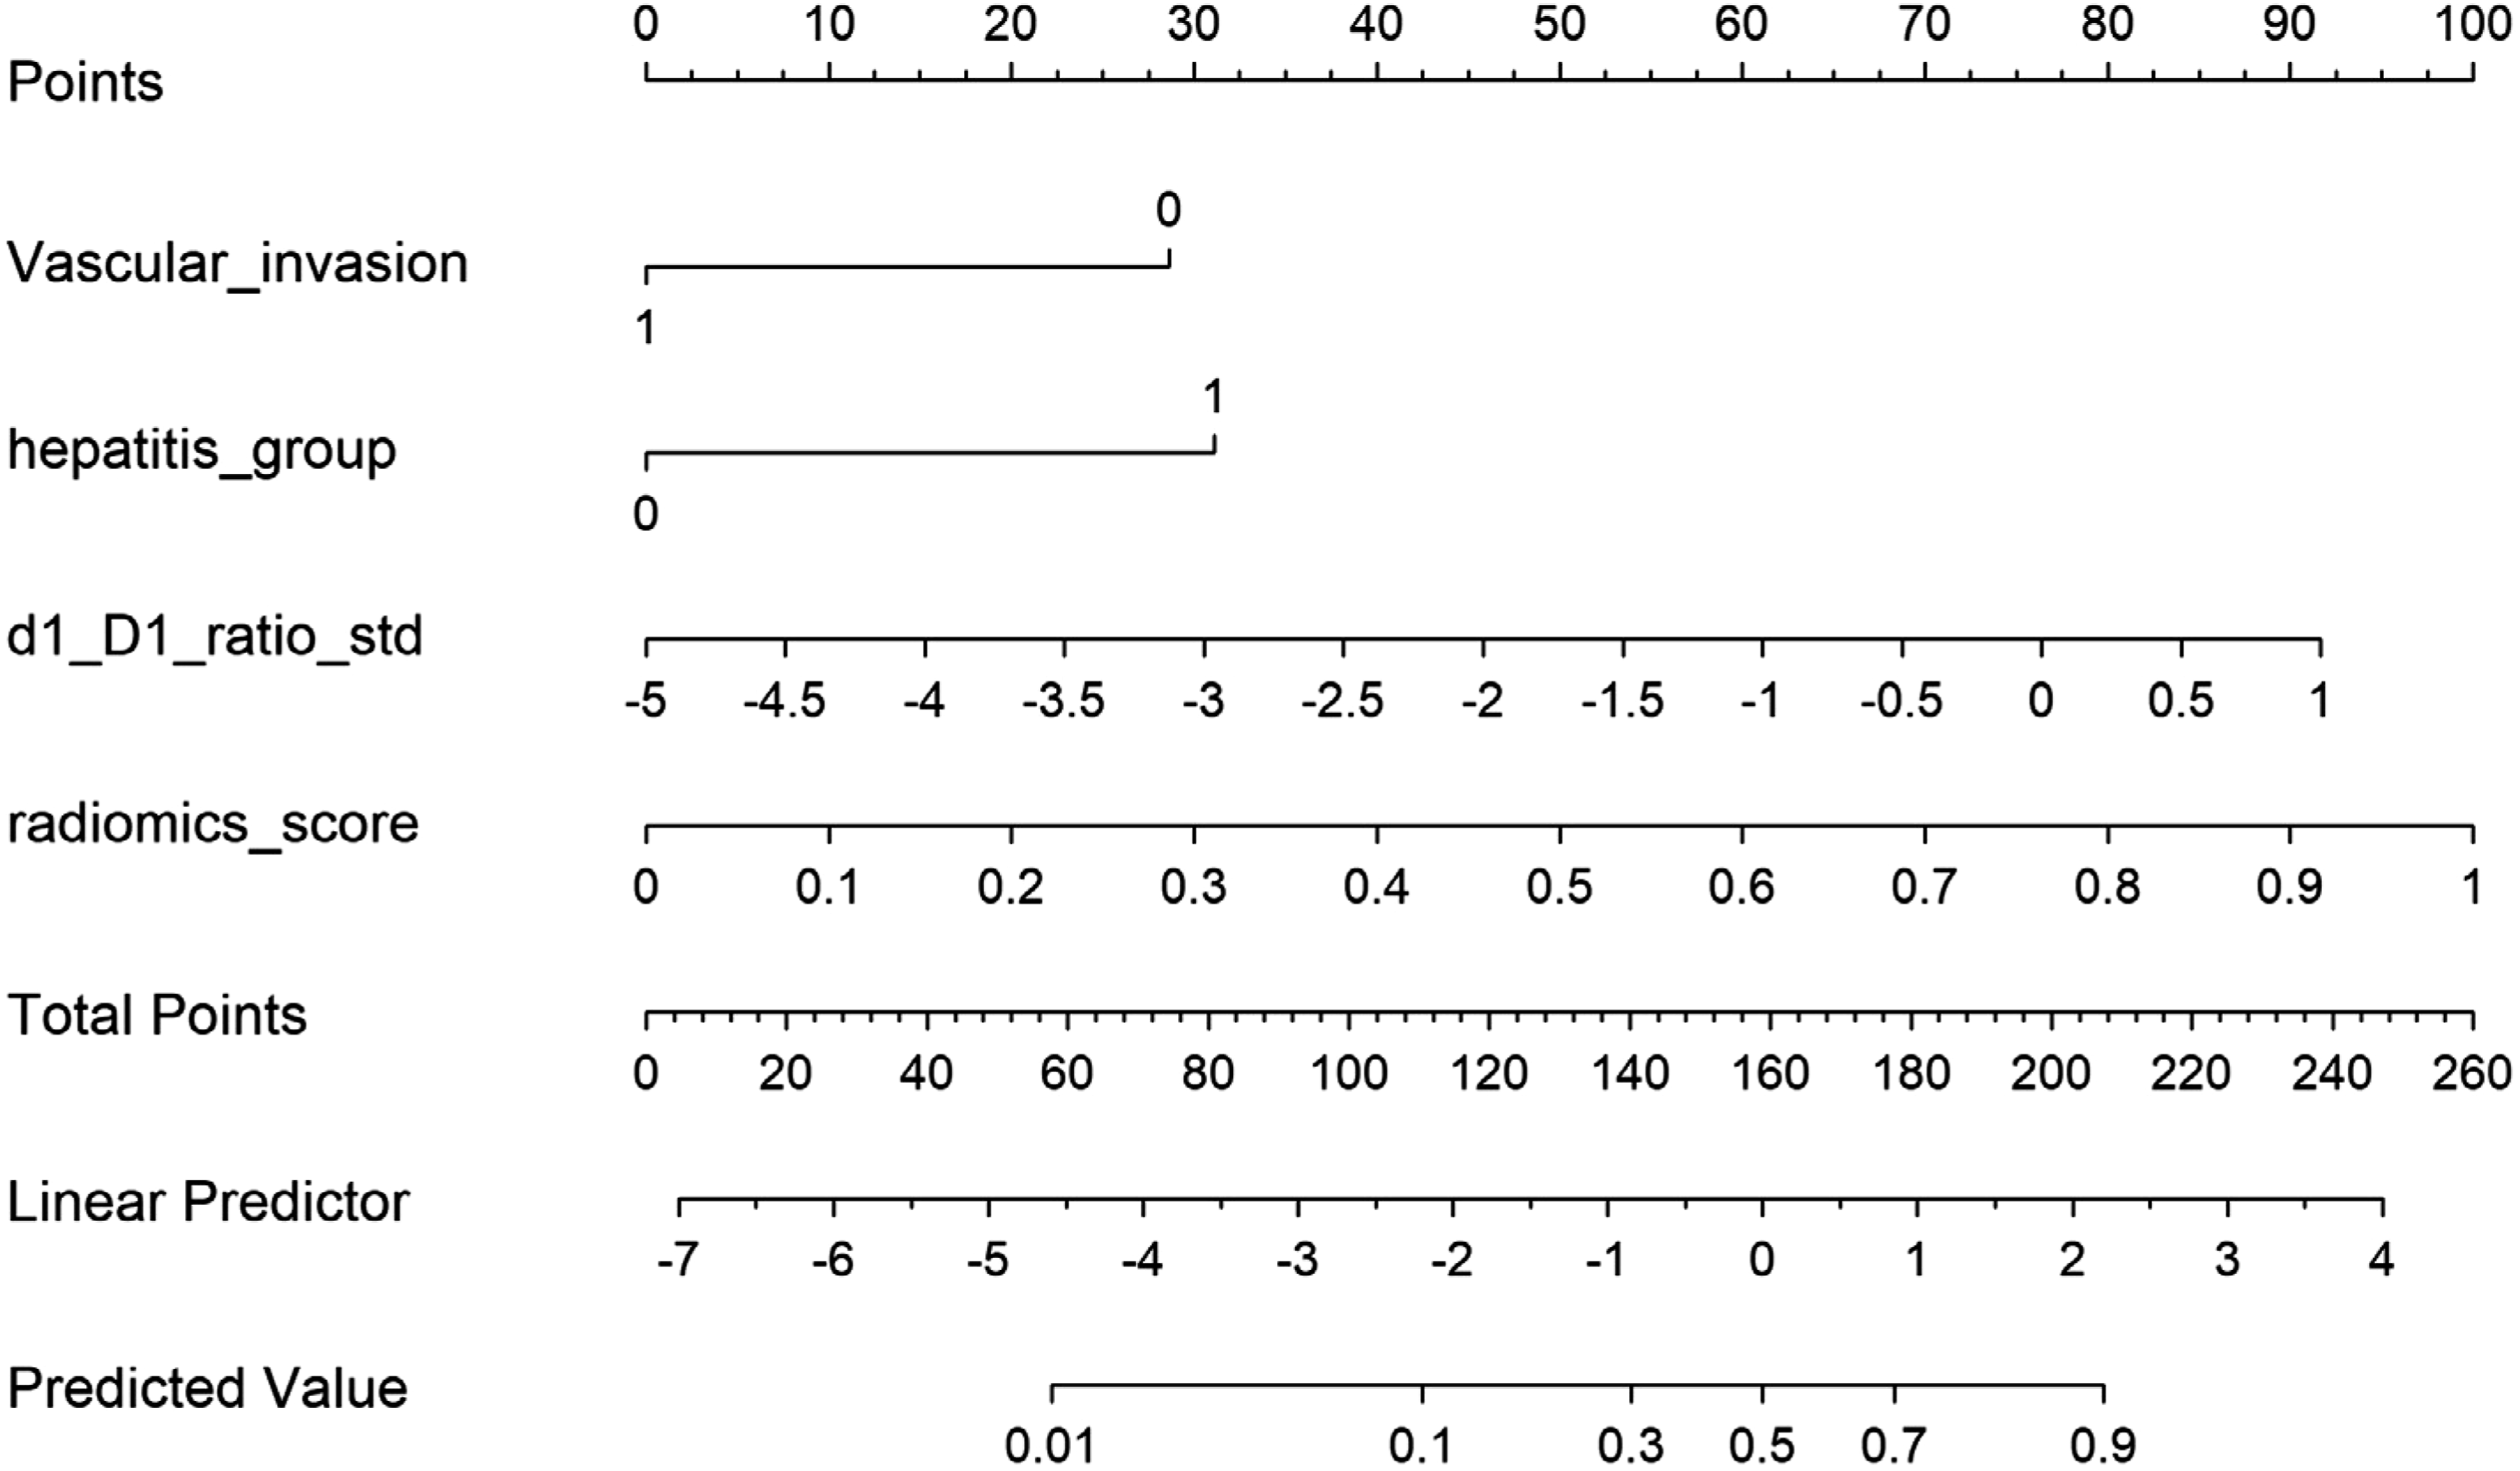
Nomogram for predicting high post-TACE tumor necrosis rate. The nomogram integrates radiomics score, hepatitis infection status (0 = none, 1 = infected), standardized pre-TACE active tumor ratio (d1/D1), and vascular invasion, to predict high post-TACE necrosis rate. Each variable corresponds to a point on the axis; summing the points yields the total points, which may be mapped to the predicted probability of ≥ 30% necrosis on the bottom scale. Hepatitis infection and vascular invasion are categorical predictors (displayed as 0 or 1), while radiomics score and tumor ratio are continuous. The bottom axis shows the resulting predicted event probability
3.3. Model Performance
Diagnostic Performance and Model Comparison in Training and Validation Sets

Abbreviations: AUC, area under the curve; CI, confidence interval; LRT, likelihood ratio test.T, Training;V, Validation
†DeLong test: Combined model vs. Clinical model.
‡LRT: Combined model vs. Clinical model.
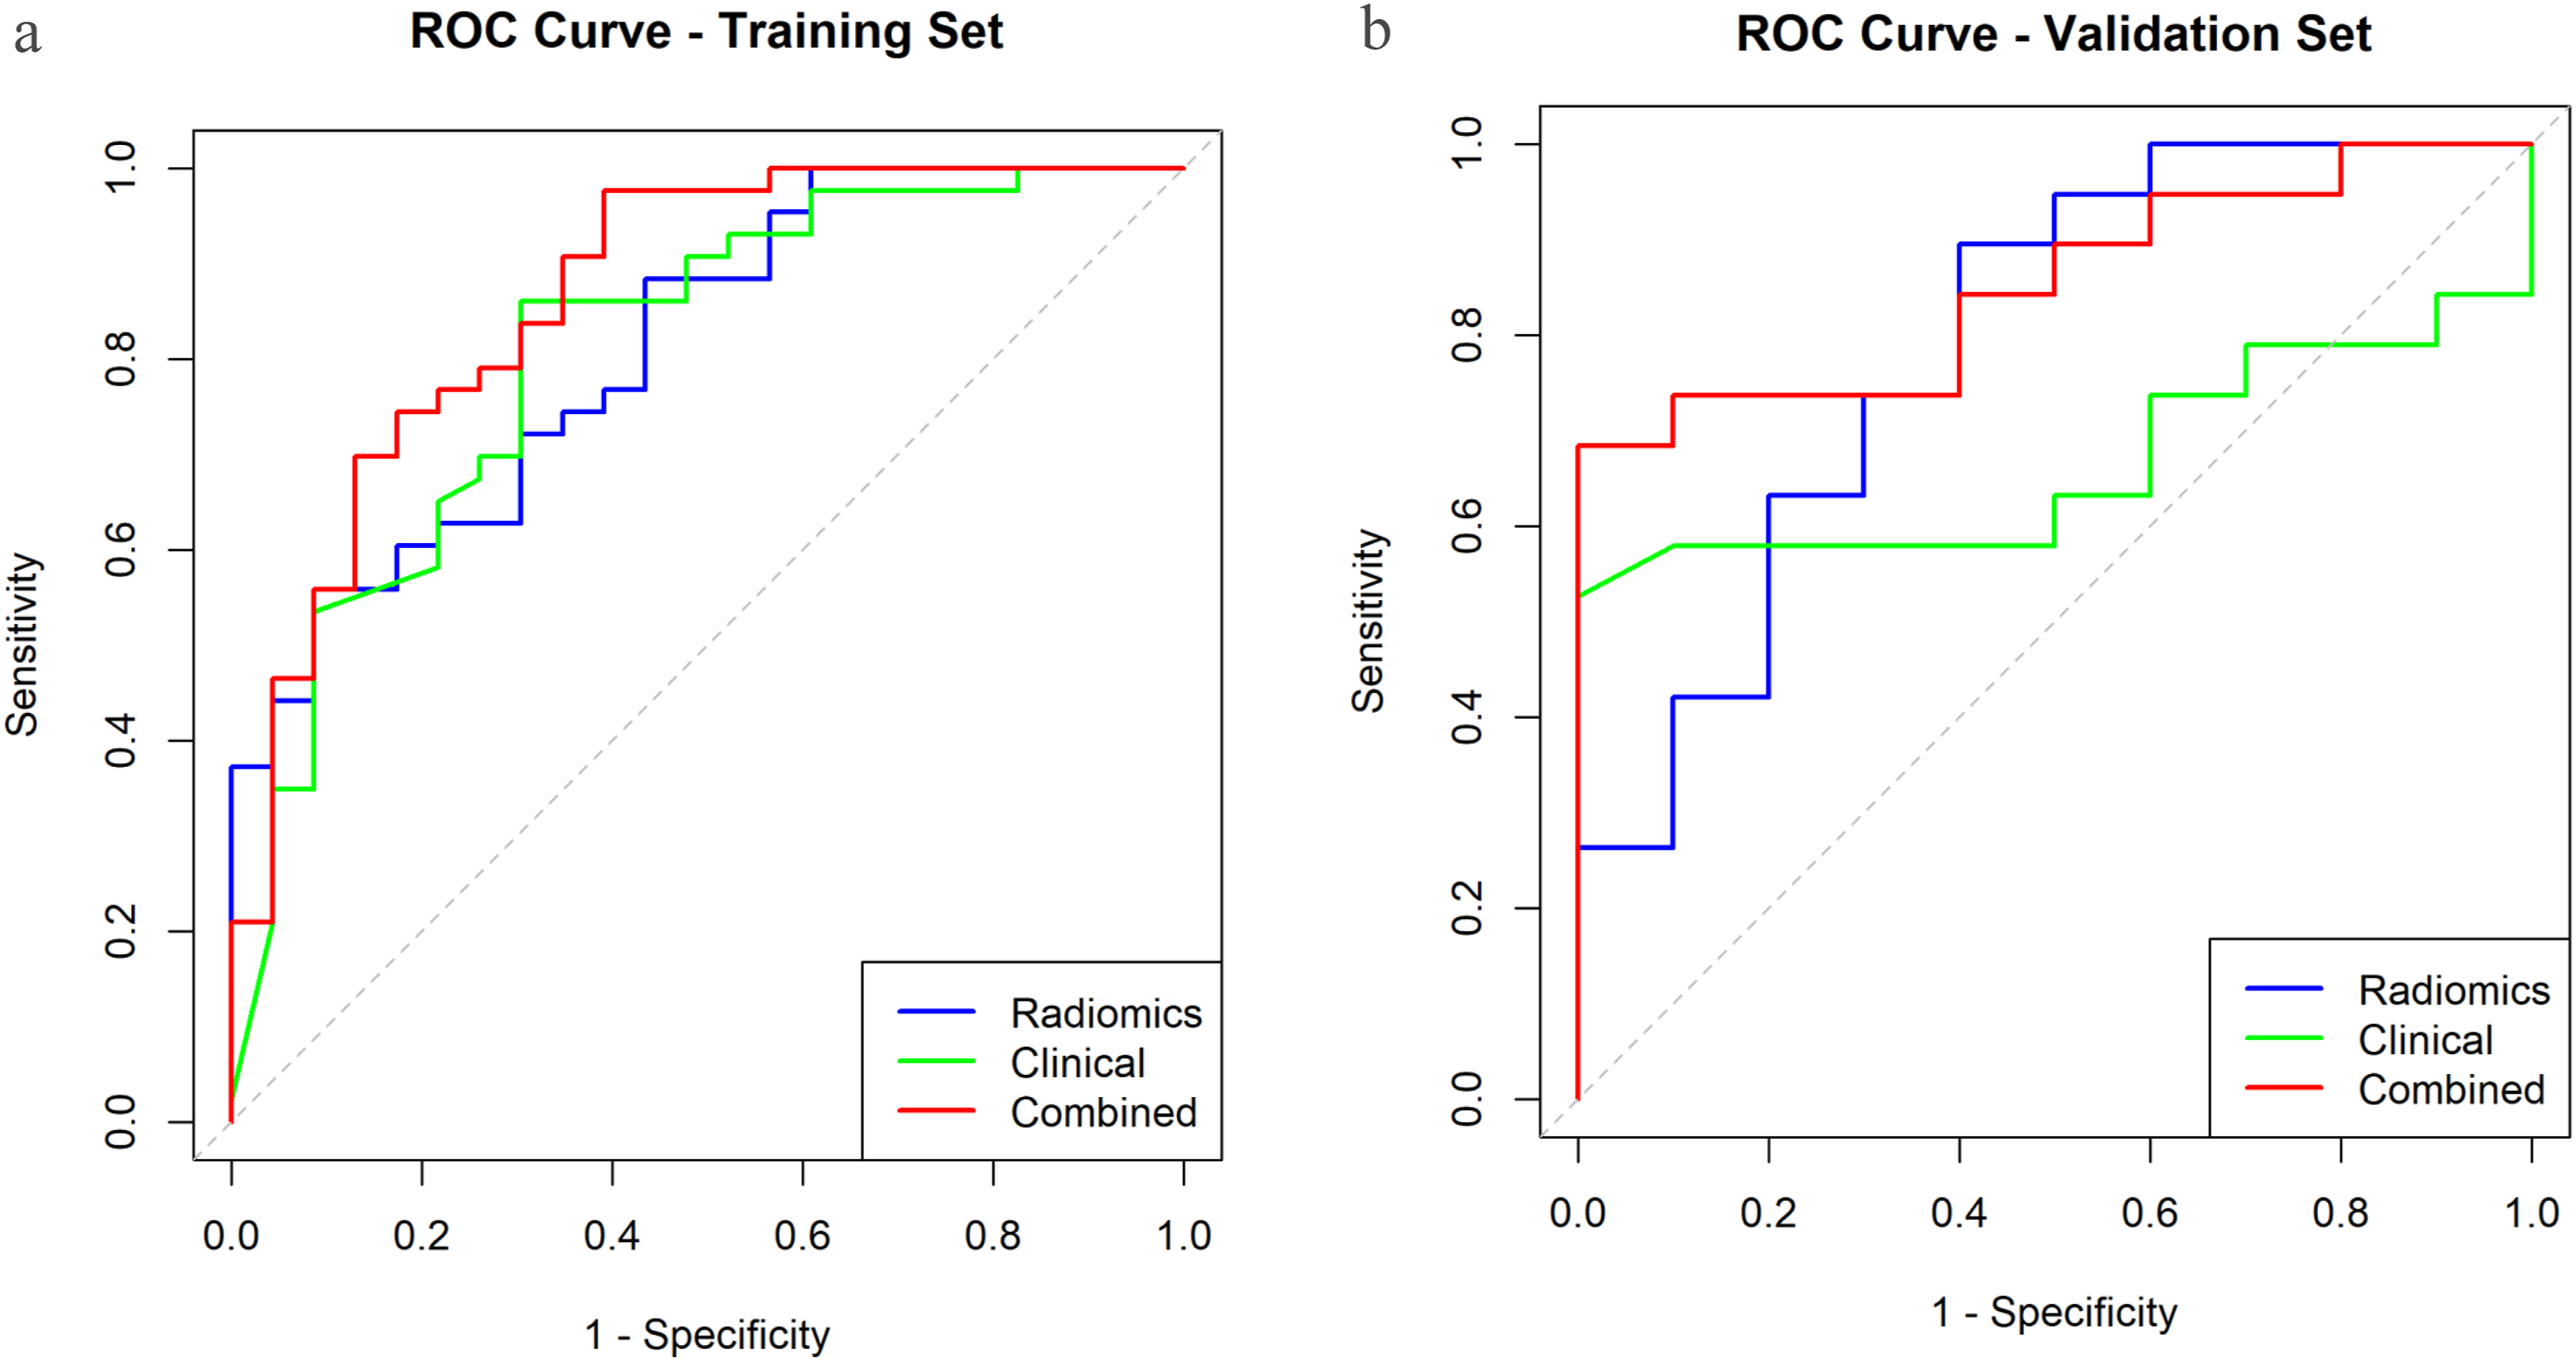
ROC curves for models
The bootstrap internal validation confirmed the robustness of the combined model. Optimism correction on the training cohort yielded a corrected C-index (AUC) of 0.831 from an apparent performance of 0.865 (optimism = 0.033), indicating only mild overfitting. The non-parametric bootstrap on the validation set produced a nearly identical AUC estimate of 0.853 (95% CI: 0.682–0.970), underscoring the stability of the initial result. Post-hoc calibration via Platt scaling maintained the model’s discriminative ability (AUC = 0.853, 95% CI: 0.716–0.990) and resulted in a comparable Brier score of 0.174 (original: 0.165). Collectively, these analyses demonstrate that the model provides a robust performance estimate despite the limited validation cohort size.
As shown in Table S2, the calibration slope was nearly ideal at 0.937 (95% CI: 0.780-1.095) in the training set and 0.949 (95% CI: 0.796-1.102) in the validation set, with both confidence intervals encompassing the ideal value of 1. The calibration intercept was -0.055 (95% CI: -0.158-0.048) in training and -0.064 (95% CI: -0.164-0.036) in validation, with both intervals containing the ideal value of 0. The maximum calibration error (Emax) was 0.253 and 0.248 in training and validation sets, respectively. The calibration curves demonstrate consistency between the training and validation cohorts (Figure 5A and B). Calibration curves for models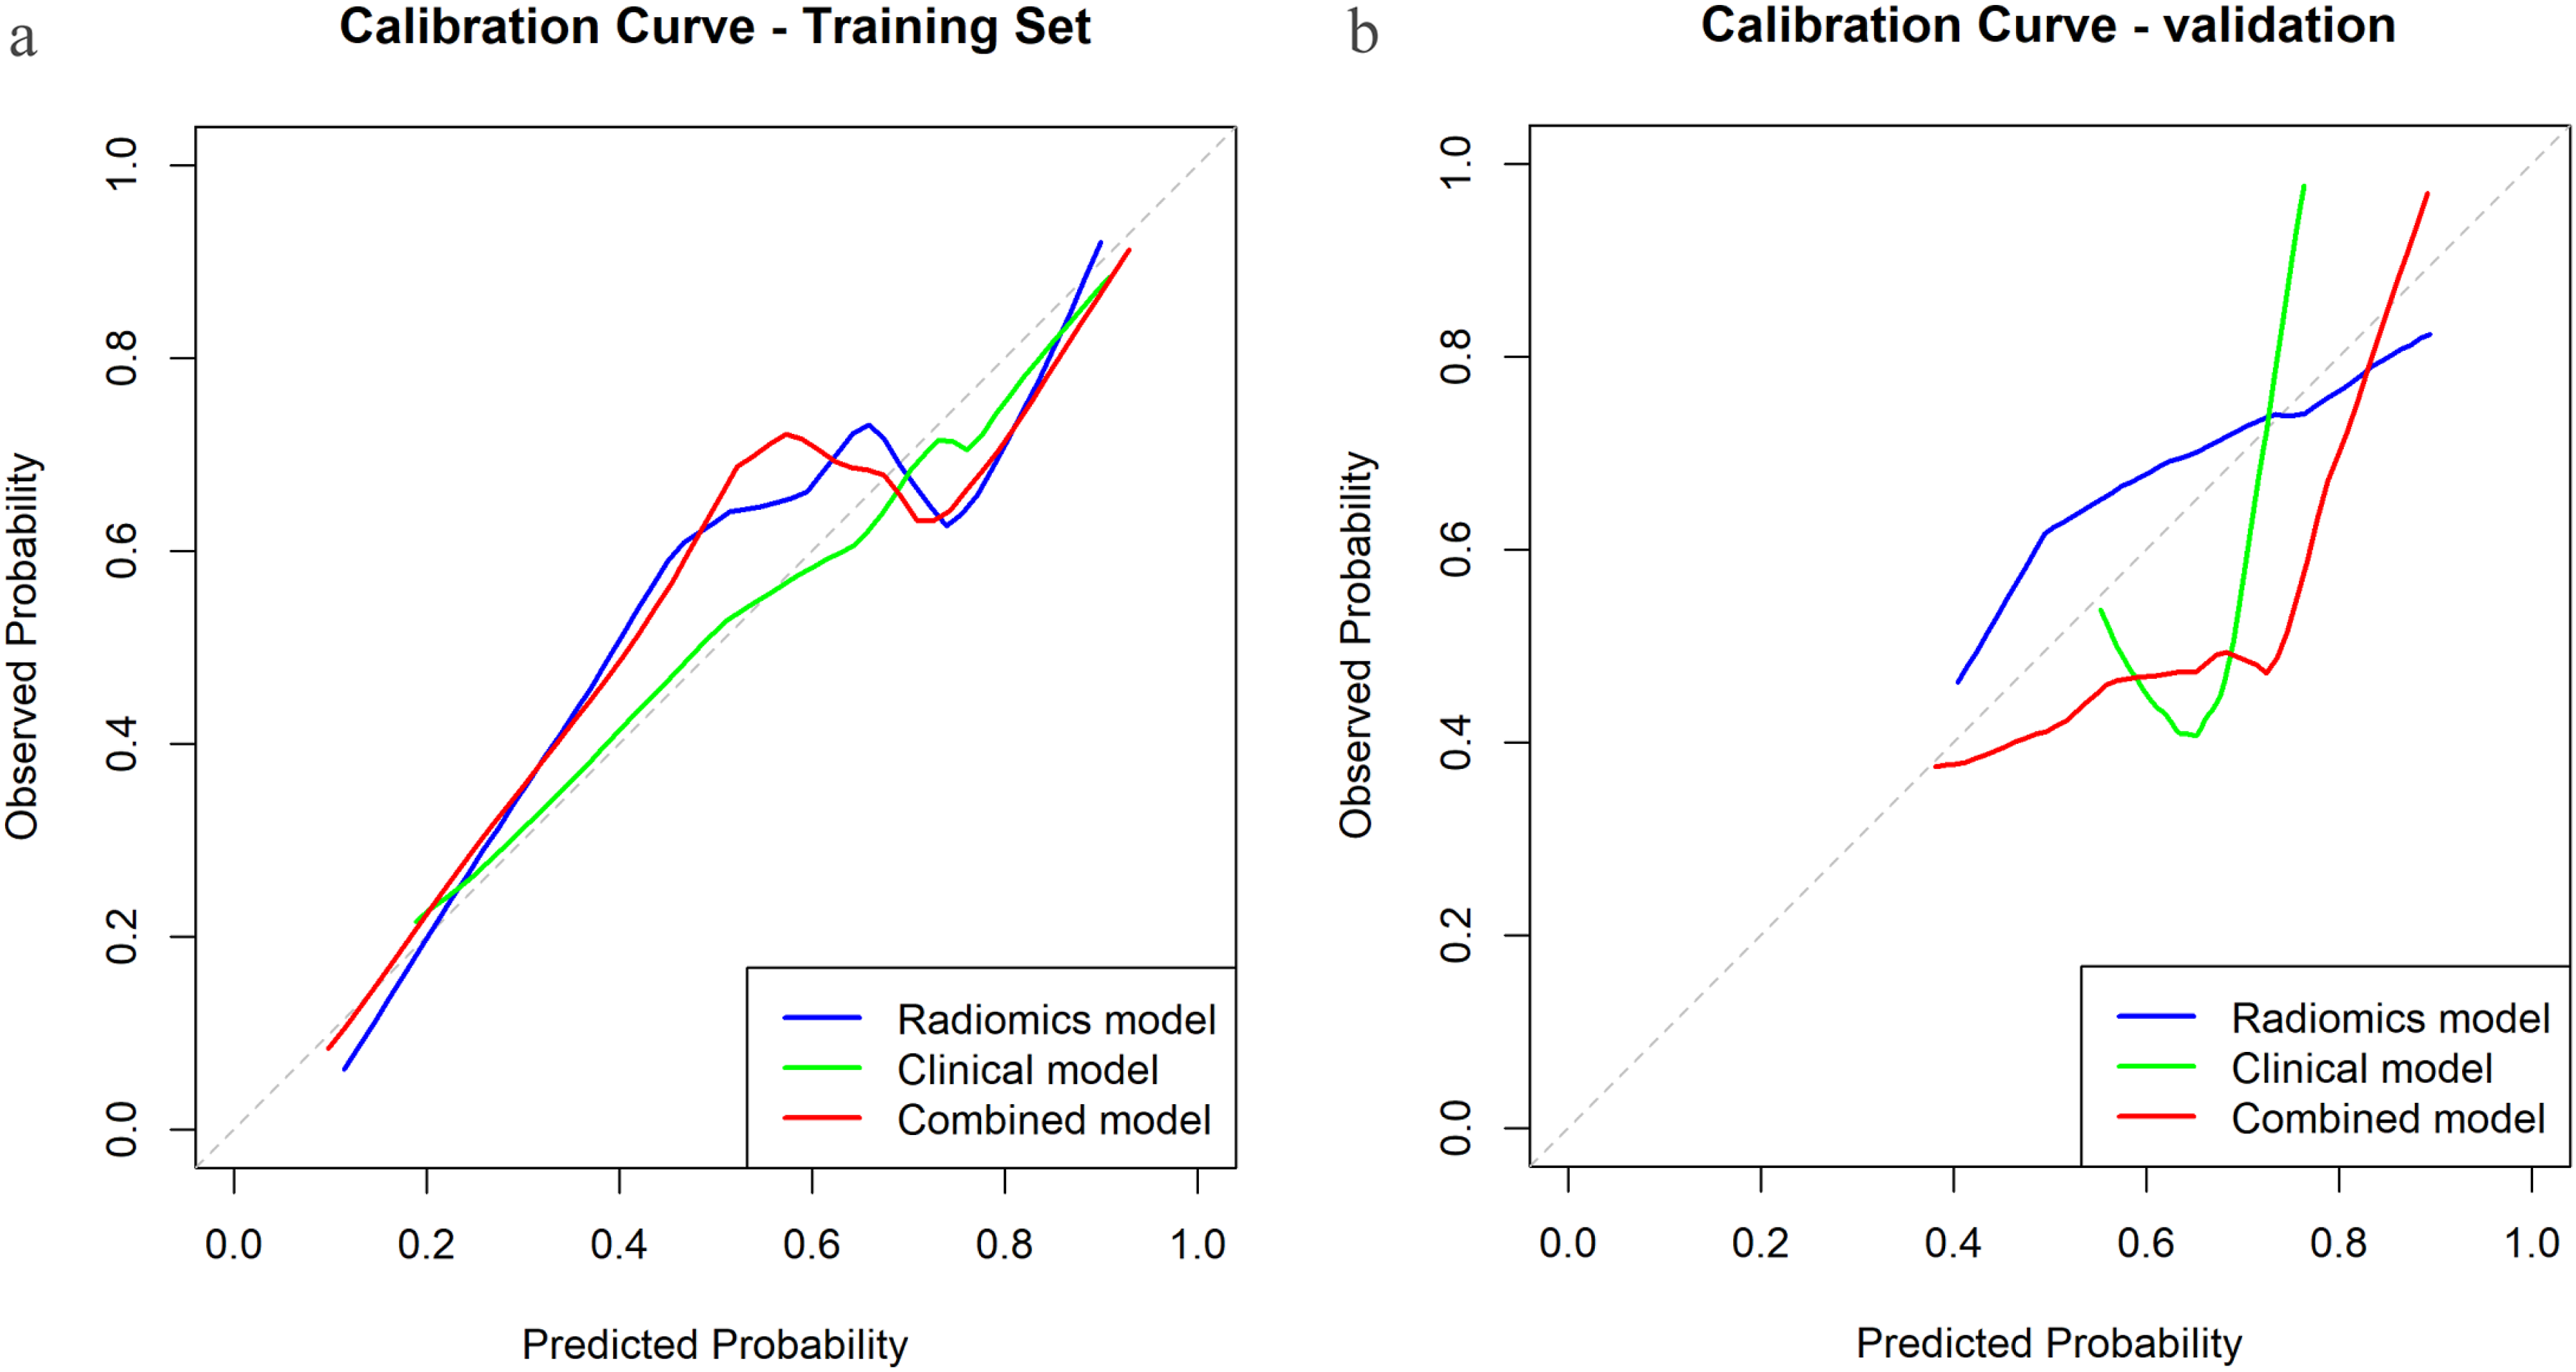
3.4. Sensitivity Analyses
When the pre-trained combined model was applied to predict the more stringent necrosis threshold (≥50%), it achieved an AUC of 0.779 in the validation set (Table S3). The threshold (≥70%) was not evaluated due to an insufficient number of positive events (n < 5).
When the necrosis rate was treated as a continuous variable, the combined model accounted for 37.1% of the variance (R2 = 0.371) in the validation set, outperforming the clinical model (R2 = 0.152) (Table S4).
3.5. Clinical Utility
DCA demonstrated that the integrated model provided superior net clinical benefit compared to the clinical model across threshold probabilities of 0.2-0.8 in the training set. In the validation set, the combined model demonstrated superior net clinical benefit compared to the “treat all,” “treat none,” clinical-only, and radiomics-only strategies across a threshold probability range of approximately 0.3 to 0.65.
When the decision-threshold lies within the 0.3-0.65 range, it implies that clinicians implicitly weigh the harm of a missed favourable response against the harm of an unnecessary intervention at a ratio of roughly 1:2 to 2:1. It is within this “clinical grey zone” that the combined model offers the decision-support value by accurately distinguishing likely responders from non-responders. At threshold probabilities between 0.1 and 0.3, the net benefit of both the “treat-all” strategy and the predictive models are comparable, supporting the rationale for universal intensified treatment in very high-risk patients when response probability is very low. At threshold probabilities between 0.65 and 0.8, for patients highly likely to respond, the consensus is clear to complete the planned TACE course. Furthermore, detailed examination of higher thresholds revealed a critical divergence between models. In the narrow 0.65–0.75 range the clinical model showed a slight advantage; however, above ∼0.75 its net benefit rapidly declined to the level of the “treat-none” strategy, suggesting diminished clinical utility in this high-threshold context. In contrast, the combined model maintained a rising net benefit, indicating potentially more robust performance even when high clinical certainty is required (Figure 6A and B). Decision-curve analysis for models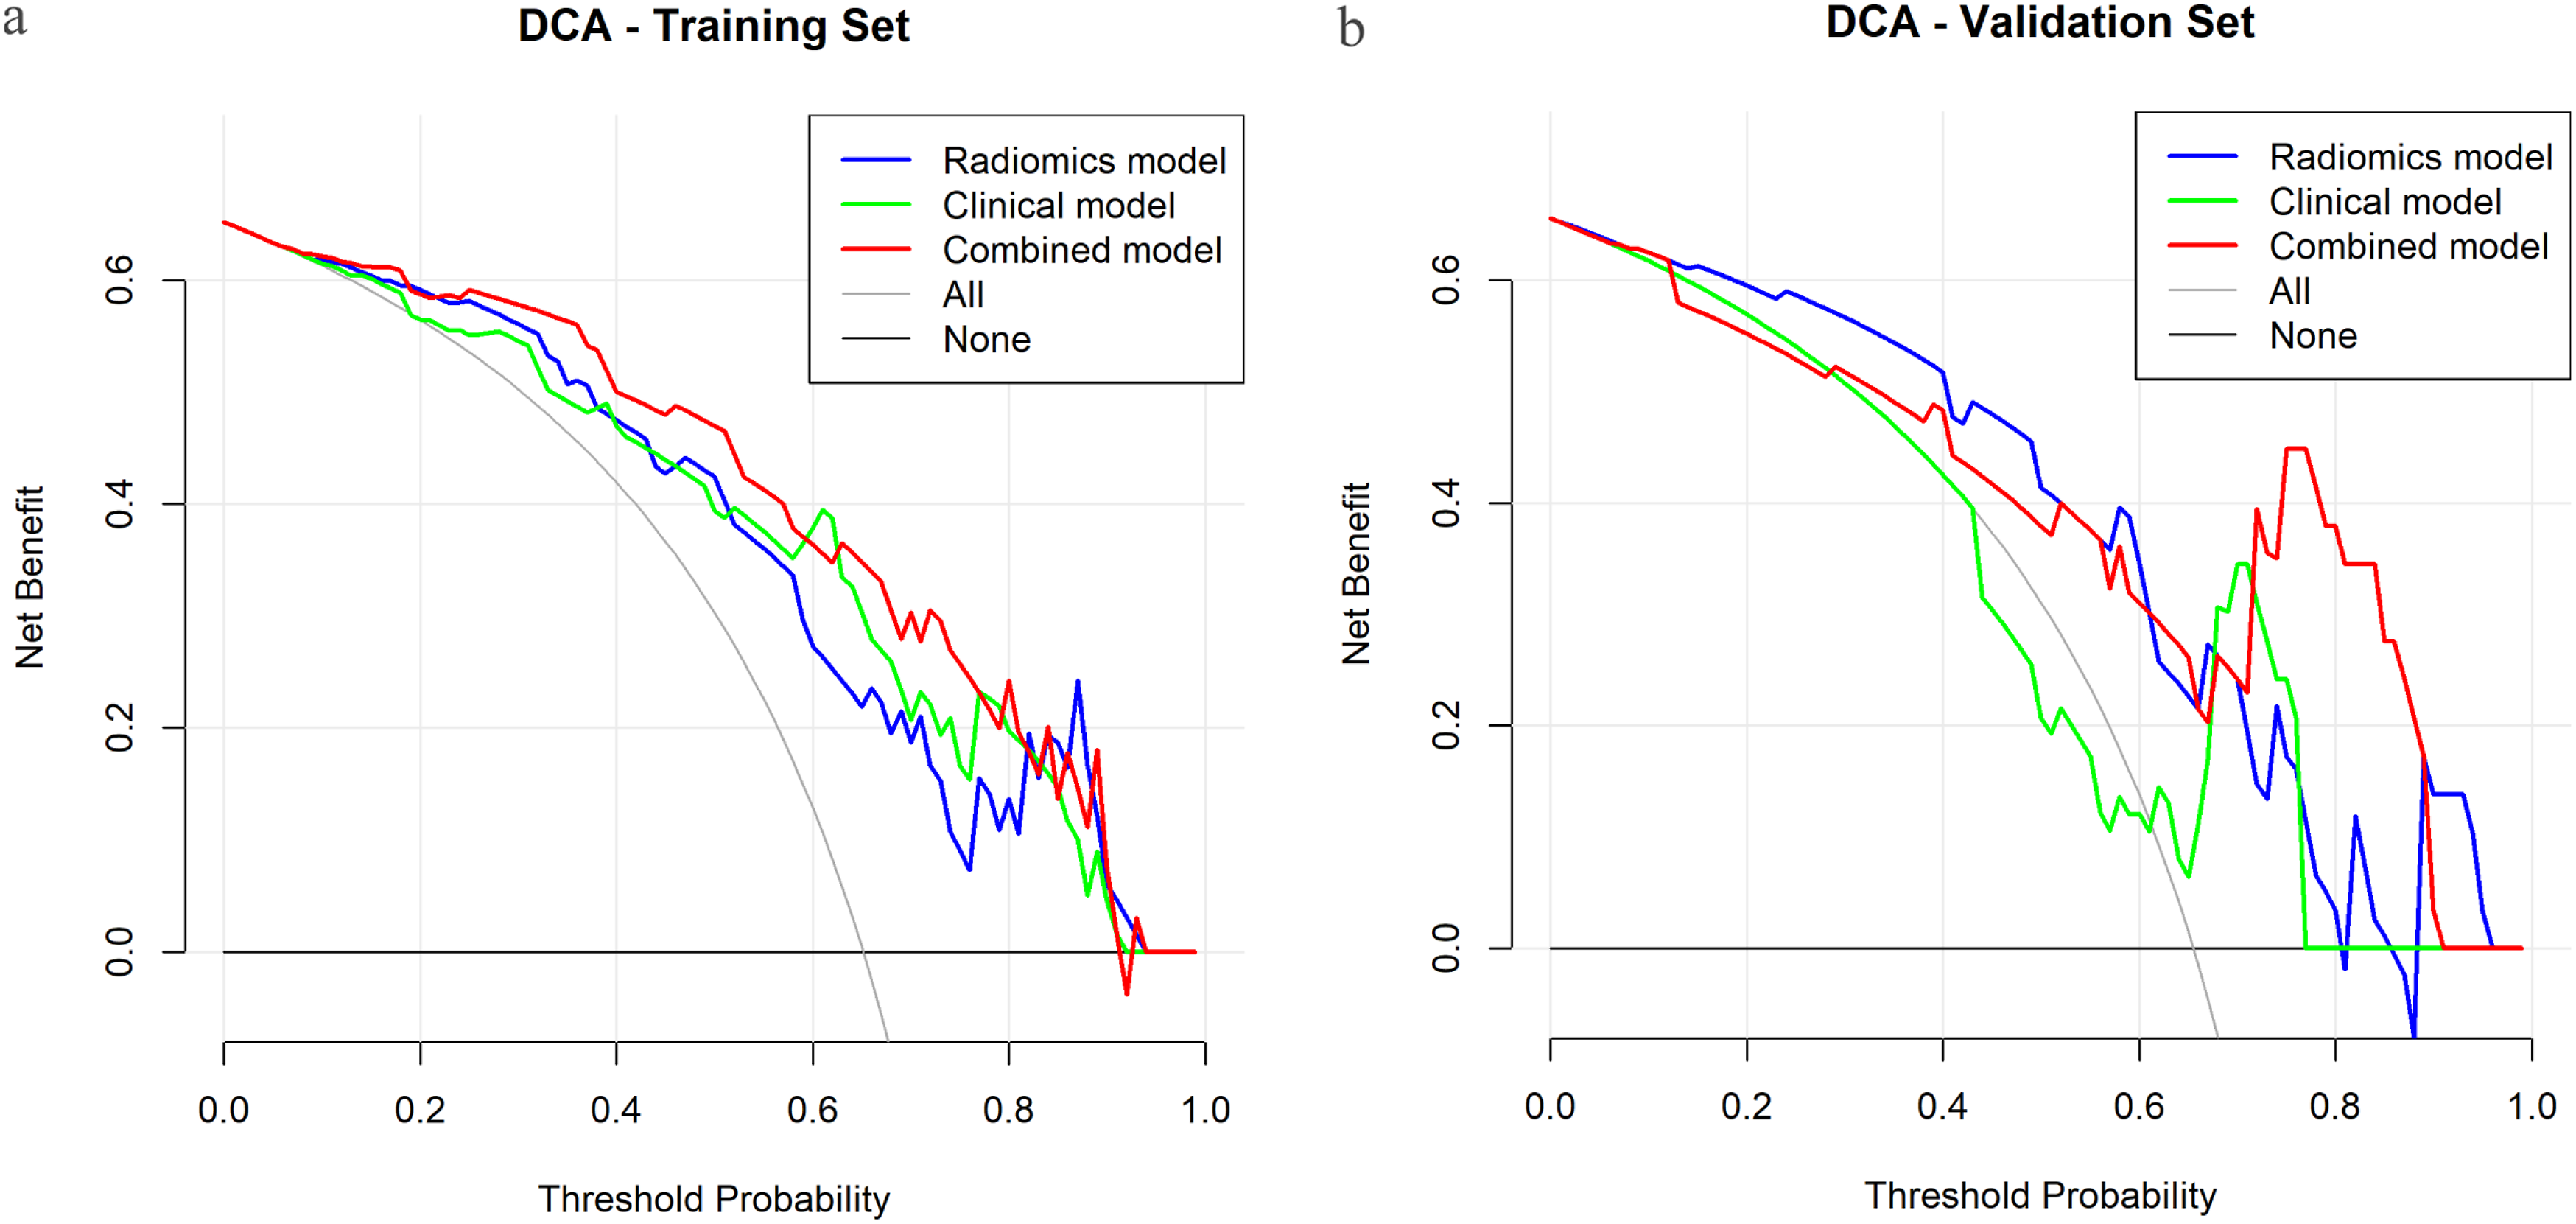
Compared to the clinical model alone, the combined model demonstrated a significant overall NRI of 30.5% (95% CI: 4.8%-60.6%). This improvement was driven by better classification of both patients with significant necrosis (events NRI: 10.5%) and those without significant necrosis (non-events NRI: 20.0%). These results suggest that the incorporation of radiomic features may lead to substantially more accurate risk stratification.
4. Discussion
This study developed and evaluated a practical nomogram that integrates radiomic features with clinical factors to predict tumor necrosis after TACE in patients with HCC. The proposed ‘standardized necrosis rate’ was designed to combine both the degree of treatment-induced necrosis and the baseline tumor volume, potentially addressing the limitation of mRECIST, which focuses solely on enhancing regions and may neglect overall tumor burden. Additionally, the inclusion of radiomic features may allow for a more comprehensive assessment of intratumoral heterogeneity and the three-dimensional architectural complexity of lesions.
The combined model yielded AUC values of 0.865 in the training set and 0.853 in the validation set, with both showing better performance than the clinical model alone, suggesting the potential value of incorporating radiomic features. The radiomics score was the most influential factor in the model, consistent with previous studies. Deng et al reported that radiomic models demonstrated high accuracy and clinical utility in predicting post-TACE prognosis. 20 Similarly, Bernatz et al emphasized that combining radiomics with clinical scores enhances individualized response prediction. 21 GLDM features (DependenceEntropy, DependenceVariance) and the GLSZM feature ZonePercentage were positively correlated with higher necrosis rates, which could be interpreted as reflecting increased textural heterogeneity and lesion fragmentation. This is consistent with a systematic review suggesting that texture heterogeneity predicts treatment response. 22 In contrast, higher values of GLSZM LargeAreaEmphasis, LargeAreaHighGrayLevelEmphasis, and first-order Kurtosis—indicating large homogeneous or hyperdense areas—were negatively associated with necrosis rate, as such regions may resist ischemic necrosis in the short term. 23
Among clinical factors, the hepatitis group was the most influential variable in the clinical model and ranked second in the combined model, highlighting the importance of etiology in patient stratification. In a small cohort, HBV infection independently predicted CR (OR ≈ 2.67), likely due to differences in microvascular architecture that may favor super-selective TACE. 24 Yoshitomi et al, in a study of 262 treatment-naïve TACE patients, found that non-viral HCC etiologies were associated with a higher risk of liver function deterioration post-TACE, suggesting that early consideration of systemic therapy may be warranted for such patients. 25 Han et al used multicenter data from 4,621 patients with HCC treated with TACE and found that etiology (HCV infection) was an independent predictor of improved overall survival (OS) in multivariate analysis. 26
The d1_D1_ratio_std, representing the pre-treatment viable tumor fraction, aligns with previous reports that the ‘enhancing tumor burden’ is a key determinant of TACE response.27,28 Furthermore, vascular invasion was negatively associated with TACE efficacy. Clinically, vascular invasion is often considered an unfavorable factor or even a contraindication for TACE, potentially due to arteriovenous shunts, restricted portal venous flow, and alternative perfusion pathways that may lead to ineffective or incomplete embolization.29,30
When compared to similar TACE response prediction models that combine CT/MRI and clinical variables, our model demonstrates comparable or superior discriminative ability, with AUCs typically ranging from 0.70 to 0.88.21,31,32 The model’s high sensitivity in the training cohort (0.977) indicates its potential to accurately identify patients with suboptimal necrosis at an early stage, enabling timely escalation of systemic therapy and potentially improving outcomes.33,34 Unlike OS or time to progression (TTP), which are influenced by repeated TACE and subsequent interventions, our endpoint more directly reflects TACE technical success, offering potentially more actionable insights.35,36 Although the calibration curve displayed some instability in the validation cohort, likely due to the small sample size (n = 29), overall calibration metrics (intercept, slope, Brier score) support clinically acceptable model calibration. The DCA further validated the enhanced clinical value of our multi-modal model, showing a consistently higher net benefit across a wide range of thresholds when compared to all uni-modal benchmark models.
In addition to improving TACE outcome prediction, a key aspect of this study is its potential application in liver transplantation selection and timing. Previous work has shown that combining mRECIST response with the largest tumor size may effectively differentiate the risk of recurrence post-transplantation. For example, patients with no response and a maximum diameter > 3 cm had a recurrence rate of 35.8%, while those with a response and a maximum diameter ≤ 3 cm had a recurrence rate of only 1.9% (P = 0.0007). 12
Furthermore, integrating mRECIST response into the Metroticket 2.0 framework significantly improved the prediction of HCC-related mortality after transplantation, highlighting the supplementary role of imaging response in evaluating candidates. 37
Building on this, the ‘standardized necrosis rate’ may serve as a more refined efficacy metric, which may reflect both the extent of embolization-induced necrosis and tumor burden correction. Compared to traditional mRECIST, this approach may more accurately capture the true extent of necrosis and could mitigate bias from baseline measurement variability, suggesting its potential as a promising tool for risk stratification in transplant candidates. Applying our predictive model in waiting list management could help identify patients unlikely to achieve sufficient necrosis, allowing for the consideration of intensified bridging or downstaging therapies. Conversely, patients predicted to respond well may safely have their waiting times extended, which could contribute to reducing donor-recipient mismatch. This proactive, individualized strategy might offer advantages over relying solely on traditional post-treatment imaging assessments.
This study has some limitations. First, the validation cohort in this study was relatively small, which resulted in wide confidence intervals for performance estimates. While this limits the precision of our findings, the consistent performance of the combined model across both training and validation sets—and its maintained predictive ability at higher thresholds (≥50% or ≥70%) in sensitivity analyses—supports the robustness and potential clinical utility of the proposed approach. The ≥30% necrosis rate was selected as the exploratory endpoint based on its alignment with the partial response criterion of mRECIST, a threshold with established interpretability in clinical practice. Further optimization of this threshold in larger, multi-center cohorts is warranted to obtain more precise performance estimates. Nevertheless, as a study to propose a “standardized necrosis rate” and develop a radiomics–clinical model for early TACE response prediction, our findings provide a novel framework and valuable reference for future investigations. Second, the single-center, retrospective design and the absence of both external and temporal validation may affect the generalizability and long-term stability of our findings. Third, the CT imaging protocols, although following a standard liver protocol, exhibited heterogeneity in parameters such as slice thickness and scanner models. Variations in image acquisition were a potential source of bias that could affect radiomics feature stability. Fourth, the radiomics features lack direct histopathologic correlation, and future studies could incorporate pathology to enhance biologic interpretability. Fifth, our analysis was restricted to a single index lesion. In patients with multifocal disease, this selection may introduce bias, as the response of the index lesion may not fully represent the overall tumor burden response, potentially limiting the model’s utility in such cases. Finally, the clinical utility of the ≥30% necrosis rate endpoint must be interpreted within its context: it serves as a valuable marker for early treatment response but does not directly predict overall survival in this cohort, as long-term outcomes are largely determined by the subsequent clinical course.
To translate this model towards clinical application, future work will focus on its prospective validation in a multi-center registry. This will be essential to confirm its generalizability and robustness across diverse patient populations and imaging protocols. We plan to employ harmonization techniques, such as variance batch adjustment (ComBat), to account for inter-scanner and inter-institutional variations in CT imaging, thereby improving the model’s portability and readiness for real-world deployment.
Looking beyond technical validation, we envision that integrating biological dimensions may further enhance predictive performance. Accumulating evidence indicates that gut microbiome dysbiosis and its altered metabolites modulate the hepatic immune microenvironment and systemic host responses via the gut–liver axis, contributing to chronic inflammation, immune dysregulation, metabolic perturbations and oncogenic signaling in the context of hepatocellular carcinoma. 38 Parallel findings from other chronic diseases illustrate the clinical relevance of integrated microbiome–metabolome profiling; for example, combined analysis of microbial compositions and metabolomic signatures was associated with clinical outcomes of patients. 39 Drawing inspiration from these multi-omics paradigms, we hypothesize that a unified framework integrating gut microbiome, metabolomics, and imaging radiomics may further refine the prediction of TACE response and uncover biologically meaningful mechanisms. If validated, such integrative approaches may inform personalized bridging or downstaging strategies, guide sequencing of locoregional and systemic therapies, and ultimately improve clinical decision-making in HCC treatment.
5. Conclusion
This study introduced a radiomics–clinical combined model based on a standardized necrosis rate, which is designed to distinguish responders from non-responders early after TACE. It may serve as a novel approach for risk stratification and the management of liver transplantation candidates. External validation and prospective assessment are warranted before clinical adoption.
Supplemental Material
Supplemental Material - A Clinical–Radiomics Nomogram Predicts Early Tumor Necrosis After Transarterial Chemoembolization for Hepatocellular Carcinoma
Supplemental Material for A Clinical–Radiomics Nomogram Predicts Early Tumor Necrosis After Transarterial Chemoembolization for Hepatocellular Carcinoma by Xiang-ling, Bing-Zhi Duan, Zhi-Hua Jiang, Shan-shan Zeng, Guo-cheng Lin, Zhong-liao Fang in Technology in Cancer Research & Treatment.
Footnotes
Ethical Considerations
This study involved analysis of the publicly available HCC-TACE-Seg dataset [ ![]() ]. The original data collection and creation of this resource were performed under the approval of the institutional review board of The University of Texas MD Anderson Cancer Center with a waiver of informed consent due to its retrospective design. As this study utilizes fully de-identified data, it did not constitute human subjects research as defined under 45 CFR 46.102(f), and thus did not require separate ethical approval.
]. The original data collection and creation of this resource were performed under the approval of the institutional review board of The University of Texas MD Anderson Cancer Center with a waiver of informed consent due to its retrospective design. As this study utilizes fully de-identified data, it did not constitute human subjects research as defined under 45 CFR 46.102(f), and thus did not require separate ethical approval.
Consent to Participate
Not applicable. Informed consent was waived for the original retrospective study from which the de-identified data were derived.
Consent for Publication
Not applicable. This study used pre-existing, fully de-identified data. Informed consent was obtained in the original study.
Author contributions
Xiang-ling Wu and Zhi-Bing Duan Led the conceptual design, managed and curated the data. Xiang-ling Wu and Zhi-Hua Jiang developed methodological framework, Xiang-ling Wu and Shan-shan Zeng analyzed the data, Xiang-ling Wu and Guo-cheng Lin assisted in data curation and methodological refinement. Xiang-ling Wu and Zhong-liao Fang prepared the manuscript. Zhi-Hua Jiang and Zhong-liao Fang secured project funding.
Funding
The authors disclosed receipt of the following financial support for the research, authorship, and/or publication of this article: This study was funded by the National Natural Science Foundation of China (Grant No. 81860595) and the Natural Science Foundation of Guangxi (Grant No. 2025GXNSFAA069044). The fundings were awarded to Zhi-Hua Jiang and Zhong-liao Fang.
Declaration of Conflicting Interests
The authors declared no potential conflicts of interest with the research, authorship, and publication of this article.
Data Availability Statement
Declaration of Generative AI in the Writing Process
No generative artificial intelligence (AI) was used in the preparation of this manuscript.
Supplemental Material
Supplemental material for this article is available online.
References
Supplementary Material
Please find the following supplemental material available below.
For Open Access articles published under a Creative Commons License, all supplemental material carries the same license as the article it is associated with.
For non-Open Access articles published, all supplemental material carries a non-exclusive license, and permission requests for re-use of supplemental material or any part of supplemental material shall be sent directly to the copyright owner as specified in the copyright notice associated with the article.