
Abstract
Clear cell renal cell carcinoma (ccRCC) is a highly lethal urinary malignancy with poor overall survival (OS) rates. Integrating computer vision and machine learning in pathomics analysis offers potential for enhancing classification, prognosis, and treatment strategies for ccRCC. This study aims to create a pathomics model to predict OS in ccRCC patients. In this study, data from ccRCC patients in the TCGA database were used as a training set, with clinical data serving as a validation set. Pathological features were extracted from H&E-stained slides using PyRadiomics, and a pathomics model was constructed using the non-negative matrix factorization (NMF) algorithm. The model's predictive performance was assessed through Kaplan-Meier (KM) survival curves and Cox regression analysis. Additionally, differential gene expression, gene ontology (GO) enrichment analysis, immune infiltration, and mutational analysis were conducted to investigate the underlying biological mechanisms. A total of 368 pathomics features were extracted from H&E-stained slides of ccRCC patients, and a pathomics model comprising two subtypes (Cluster 1 and Cluster 2) was successfully constructed using the NMF algorithm. KM survival curves and Cox regression analysis revealed that Cluster 2 was associated with worse OS. A total of 76 differential genes were identified between the two subtypes, primarily involving extracellular matrix organization and structure. Immune-related genes, including CTLA4, CD80, and TIGIT, were highly expressed in Cluster 2, while the VHL and PBRM1 genes, along with mutations in the PI3K-Akt, HIF-1, and MAPK signaling pathways, exhibited mutation rates exceeding 40% in both subtypes. The machine learning-based pathomics model effectively predicts the OS of ccRCC patients and differentiates between subtypes. The critical roles of the immune-related gene CTLA4 and the PI3K-Akt, HIF-1, and MAPK signaling pathways offer new insights for further research on the molecular mechanisms, diagnosis, and treatment strategies for ccRCC.
Background
Renal cell carcinoma (RCC) ranks among the common malignancies of the genitourinary system, comprising approximately 2–3% of all adult malignancies, with an estimated annual incidence of about 400,000 new cases, and its incidence and mortality rates are steadily increasing.1,2 In 2023, RCC was listed among the top ten newly diagnosed cancers in the United States, ranking as the sixth most common cancer in males and the ninth most common cancer in females. 3 RCC encompasses over 10 histological subtypes, among which clear cell renal cell carcinoma (ccRCC) represents the predominant pathological type, accounting for approximately 70% of all RCC cases. 4 ccRCC, originating from the proximal convoluted tubules, manifests as the most lethal malignancy within the genitourinary system, characterized by its tendency towards aggressive behavior, including distant organ metastasis. 5 Due to its insensitivity to conventional chemotherapy and radiotherapy, surgical resection, targeted therapy, and immunotherapy are the primary treatment modalities for ccRCC. 6 Notably, surgical resection constitutes the primary efficacious treatment modality for early-stage ccRCC. However, approximately 30% of patients may experience recurrence, metastasis, or even death following curative surgery. 7 Moreover, approximately one-third of ccRCC patients present with advanced disease at initial diagnosis, often indicating high mortality and metastatic rates. 8 Consequently, the prognosis for the majority of ccRCC patients remains unfavorable. Furthermore, ccRCC exhibits significant heterogeneity in its morphological, molecular, clinical outcomes, and treatment responses, 9 whereby patients with similar clinical features may yield disparate outcomes even under similar therapeutic regimens. 10
For patients with advanced ccRCC, first-line treatment includes immunotherapy, either alone or in combination with tyrosine kinase inhibitors (TKIs). However, TKI monotherapy remains an appropriate first-line treatment for a significant proportion of patients who are not suitable for immunotherapy, with the STAR study results directly applicable to this group. For other patients who do not receive a TKI as first-line therapy, it may be considered as monotherapy in the second-line setting. While treatment breaks can be reasonably considered for these patients, caution should be exercised, as their progression-free survival is typically shorter than that of patients receiving first-line TKI therapy. 11 Thus, improving overall survival (OS) for these patients remains a critical challenge. 12 Therefore, there is an urgent need to develop predictive models that more accurately assess OS in ccRCC patients based on existing clinical, pathological, and genomic features, to optimize personalized treatment strategies.
Carcinogenesis is a complex process that necessitates multi-omics analyses for a comprehensive understanding. However, conducting omics analyses requires a substantial amount of tissue specimens, and the majority of precancerous samples are insufficient to support comprehensive omics analysis. Additionally, omics analysis is costly, technically intricate, and time-consuming, factors that severely impede further understanding of the ccRCC carcinogenic process. 13 In contrast to the demanding, time-consuming, and complex omics techniques, pathological assessment with hematoxylin and eosin (H&E) staining is more robust, efficient, and cost-effective, serving as the gold standard routinely used for cancer diagnosis and survival prediction.13–15 H&E staining is a widely adopted technique in pathology laboratories, providing high-resolution images capturing fundamental morphological characteristics of tumor tissues and is indispensable for clinical diagnosis. 16 However, manual microscopic examination of H&E stained slides heavily relies on the expertise of pathologists, rendering it labor-intensive and experience-dependent. 16 Furthermore, studies have demonstrated inter-observer variability leading to different histopathological interpretations of the same tissue slide, resulting in inaccurate prognoses. 17 Hence, there is an urgent need for a better approach to interpreting histopathological features. 18
With advancements in medical technology, microscopy is gradually being replaced by digitization. Entire specimens of H&E-stained slides can be scanned and stored as digital pathology images. 19 Pathological images encompass histological and morphological features of tumor cells and their stroma, which play pivotal roles in influencing tumor growth patterns and aiding in patient prognosis. 20 However, clinical practitioners may encounter difficulties in identifying and extracting these pertinent pathological insights. 21
In recent years, the term “pathomics” has gradually emerged as a research hotspot. Pathomics is a branch of digital pathology that utilizes artificial intelligence to extract quantitative features such as texture, morphology, edge gradients, and biological characteristics from pathological images. These features are then integrated for comprehensive analysis in diagnostic, molecular, and prognostic applications. 22 Pathomics features describe the voxel characteristics of pathological images and the interactions between adjacent voxels, which can be categorized into first-order and second-order features. First-order features describe the distribution of grayscale values, while second-order features (texture features) are obtained by calculating the interactions between neighboring voxels. These include features such as the Gray Level Co-occurrence Matrix (GLCM), Gray Level Dependence Matrix (GLDM), Gray Level Run Length Matrix (GLRLM), Gray Level Size Zone Matrix (GLSZM), and Neighborhood Gray-Tone Difference Matrix (NGTDM). These features capture the texture information of the image, such as variation amplitude, direction, grayscale distribution, and regional homogeneity. Additionally, higher-order features are generated through wavelet transforms to capture texture information at multiple scales, thereby improving image classification accuracy. 23 Previous studies have demonstrated that pathomics combined with artificial intelligence algorithms can be utilized for prognostication of lung cancer, 24 renal cell carcinoma, 25 prostate cancer bone metastasis, 26 and colorectal cancer. 27 These findings underscore the significant potential of pathomics in providing personalized prognosis estimation and decision-making strategies. 27 However, regarding its application in the digital pathology domain of ccRCC, it is currently in a relatively nascent stage, necessitating further in-depth research and exploration.
In this study, we innovatively applied pathomics techniques to explore the association between clinical pathology and genomic data and patient OS. Concurrently, we employed bioinformatics methods such as functional enrichment analysis, immune infiltration analysis, and mutation analysis to delve deeper into the underlying molecular mechanisms behind pathomics subtyping. This research not only offers novel options for personalized precision therapy of ccRCC but also provides robust theoretical and practical support for future clinical practice and treatment strategy formulation.
Methods
Data Collection and Processing
The dataset of ccRCC patients was obtained from The Cancer Genome Atlas (TCGA) database (https://portal.gdc.cancer.gov/), specifically the TCGA-KIRC dataset, comprising RNA sequencing transcriptome data, complete H&E-stained histopathological images, mutation data, clinical, and follow-up information,28,29 serving as the training set for subsequent research. Additionally, we collected H&E-stained histopathological images and corresponding clinical information from patients diagnosed with ccRCC at Ruijin Hospital, affiliated with Shanghai Jiao Tong University School of Medicine, to serve as the validation set. Inclusion and exclusion criteria for both the training and validation sets were as follows: (a) Screening of samples from initial diagnosis and initial treatment. (b) Eliminate those with less than a month to live. (c) Elimination of samples with missing clinical data. (d) Selection of primary solid tumor specimens and RNA-seq data. (e) Removal of samples with inadequate image quality. An overview of the overall study design is outlined in Figure 1.

An overview of the study design.
Extraction of Pathomic Image Features
Under conditions of maximum magnification at 20× or 40×, H&E-stained pathological slides were retrieved and downloaded from the TCGA database (https://portal.gdc.cancer.gov/). 28 The OTSU algorithm (https://opencv.org/) was employed to obtain the tissue regions of the pathological slides. 30 The 40× images were segmented into multiple sub-images of 1024 × 1024 pixels. The 20× images were segmented into multiple sub-images of 512 × 512 pixels and upsampled to 1024 × 1024 pixels. Following previous studies, pathologists reviewed and excluded sub-images of poor quality (contaminated, blurred, with blank areas exceeding 50%), and randomly selected 10 remaining sub-images for subsequent analysis. 31
Utilizing the PyRadiomics open-source package (https://pyradiomics.readthedocs.io/en/latest/), image standardization and feature extraction were conducted on each sub-image. The extracted features comprised original characteristics, encompassing both first and second-order attributes, as well as high-order features derived from original features combined with wavelet transformations (LL, LH, HL, HH).32–36 Subsequently, for each patient's pathological image, features were individually extracted from 10 sub-images. The resultant features were then averaged to represent the pathomic characteristics of each sample, facilitating subsequent data analysis.
The Selection of Pathomic Features
The pathomic features, extracted using the PyRadiomics package, underwent range normalization to mitigate the effects of variable scales and ranges of variation. Range normalization, implemented through the method of range scaling, is aimed at standardizing variables by transforming them into a common scale. This normalization technique is expressed by the formula: X’ = (X-Xmin)/(Xmax-Xmin), where X’ represents the normalized feature value, X is the original feature value, Xmin denotes the minimum feature value, and Xmax represents the maximum feature value within the dataset. Subsequently, the Repeat Random Survival Forest (Repeat RSF) method was employed for feature selection. During the feature selection process, 1000 iterations of RSF analyses were conducted, with a final selection criterion based on features appearing in over 500 iterations. Additionally, to explore the relationship between the extracted pathological features and clinical-pathological features, Spearman correlation analysis was conducted on the selected pathological features and clinical-pathological characteristics.
Unsupervised Clustering Analysis of Pathomic Features
The Non-negative Matrix Factorization (NMF) algorithm is an unsupervised clustering method based on part-based decomposition. It aggregates the weights of different features, ultimately representing a substantial amount of information using a small amount of structured data. This algorithm has been applied to identify various molecular patterns and can also recover meaningful biological information from tumor-related microarray data.37–39 Therefore, this study employs the NMF algorithm to perform clustering analysis on the selected pathological features and to obtain samples of different pathological subtypes.Within the clustering process, the Brunet method was applied, with the rank parameter ranging from 2 to 5. The optimal rank value was determined by selecting the point preceding the most rapid decline in the cophenetic value. 40 Moreover, within both the training and validation datasets, patients were segregated into different pathomic subtypes (Cluster 1/Cluster 2) using the unsupervised clustering approach based on NMF. Subsequently, patients’ clinical information was aggregated according to their respective pathomic subtypes for further analysis.
Evaluation of Different Pathomic Features
Utilizing Kaplan-Meier survival curves, the variation in survival rates among different pathomic subtypes was assessed. The significance of differences in survival rates between groups was determined using the Log-rank test. The median survival time denotes the time point at which the survival rate reaches 50%. Single-factor and multi-factor Cox proportional hazards regression models were employed to analyze the impact of different factors on patient survival outcomes. Furthermore, exploratory subgroup analyses were conducted using single-factor Cox regression to investigate the influence of different pathomic subtypes (Cluster 2 vs Cluster 1) on patient prognosis within various covariate subgroups. 41
Screening of Differentially Expressed Genes Between Different Pathomic Subtypes
The RNA-seq data originated from the training set (TCGA-KIRC) and were formatted as Fragments Per Kilobase per Million (FPKM), subsequently log2-transformed. Differential expression genes (DEGs) between two pathomic subtypes in the training set were identified using the “limma” software package. 42 A statistically significant criterion was defined as |logFC|>1.2 and P.adj < .05. Specifically, genes with logFC > 1.2 and P.adj < .05 were considered upregulated DEGs, while genes with logFC < −1.2 and P.adj < .05 were regarded as downregulated DEGs. Visualization of the differential genes was achieved through volcano plots.
Differential Expression Genes Enrichment Analysis
Utilizing the “clusterProfiler” software package, 43 gene ontology (GO) pathway enrichment analysis 44 was conducted to identify over-represented GO terms within three categories: biological processes (BP), cellular components (CC), and molecular functions (MF). The top 15 significantly enriched pathways from the BP, CC, and MF enrichment analyses were visualized. A statistical significance threshold was set at P.value < .05 and false discovery rate (FDR) <0.05, with P-value correction performed using the Benjamini-Hochberg method.
Immune Cell Abundance Analysis
The gene expression matrix of all ccRCC patient samples from the training set was uploaded to the ImmuCellAI database (http://bioinfo.life.hust.edu.cn/ImmuCellAI/#!/), and the immune cell infiltration was calculated for each sample. The Wilcoxon rank-sum test was employed to analyze the differences in immune cell infiltration levels between different pathological subtypes, with significance set at P < .05.
Mutation Analysis
The mutation data of the samples were downloaded from the TCGA data portal (https://portal.gdc.cancer.gov/). The maftools package was used to analyze the mutation data, calculate the mutation frequency of genes in the samples, and perform statistical analysis of the mutation frequencies across different samples. Additionally, the maftools package was utilized to compute the tumor mutational burden (TMB) for each sample. Fisher's exact test and the Wilcoxon rank-sum test were employed to analyze whether there were significant differences in genes and TMB between different pathomic subtypes. A significance threshold of P < .05 was considered statistically significant. 45
Statistical Analysis
Categorical variables were represented using numbers (percentages). Fisher's exact test was employed to analyze whether there were significant differences in gene mutations between different pathological subtypes. The Wilcoxon rank-sum test was utilized to examine whether there were significant differences in TMB between different pathological subtypes. Kaplan-Meier methodology was employed to generate survival curves. Cox regression analysis was conducted for univariate and multivariate analyses to estimate the hazard ratio (HR) and corresponding 95% confidence interval (CI). All statistical analyses were performed using R software (Version 4.1.0) and relevant R packages, with two-sided hypothesis testing conducted, and P < .05 considered statistically significant.
Results
Clinical Characteristics
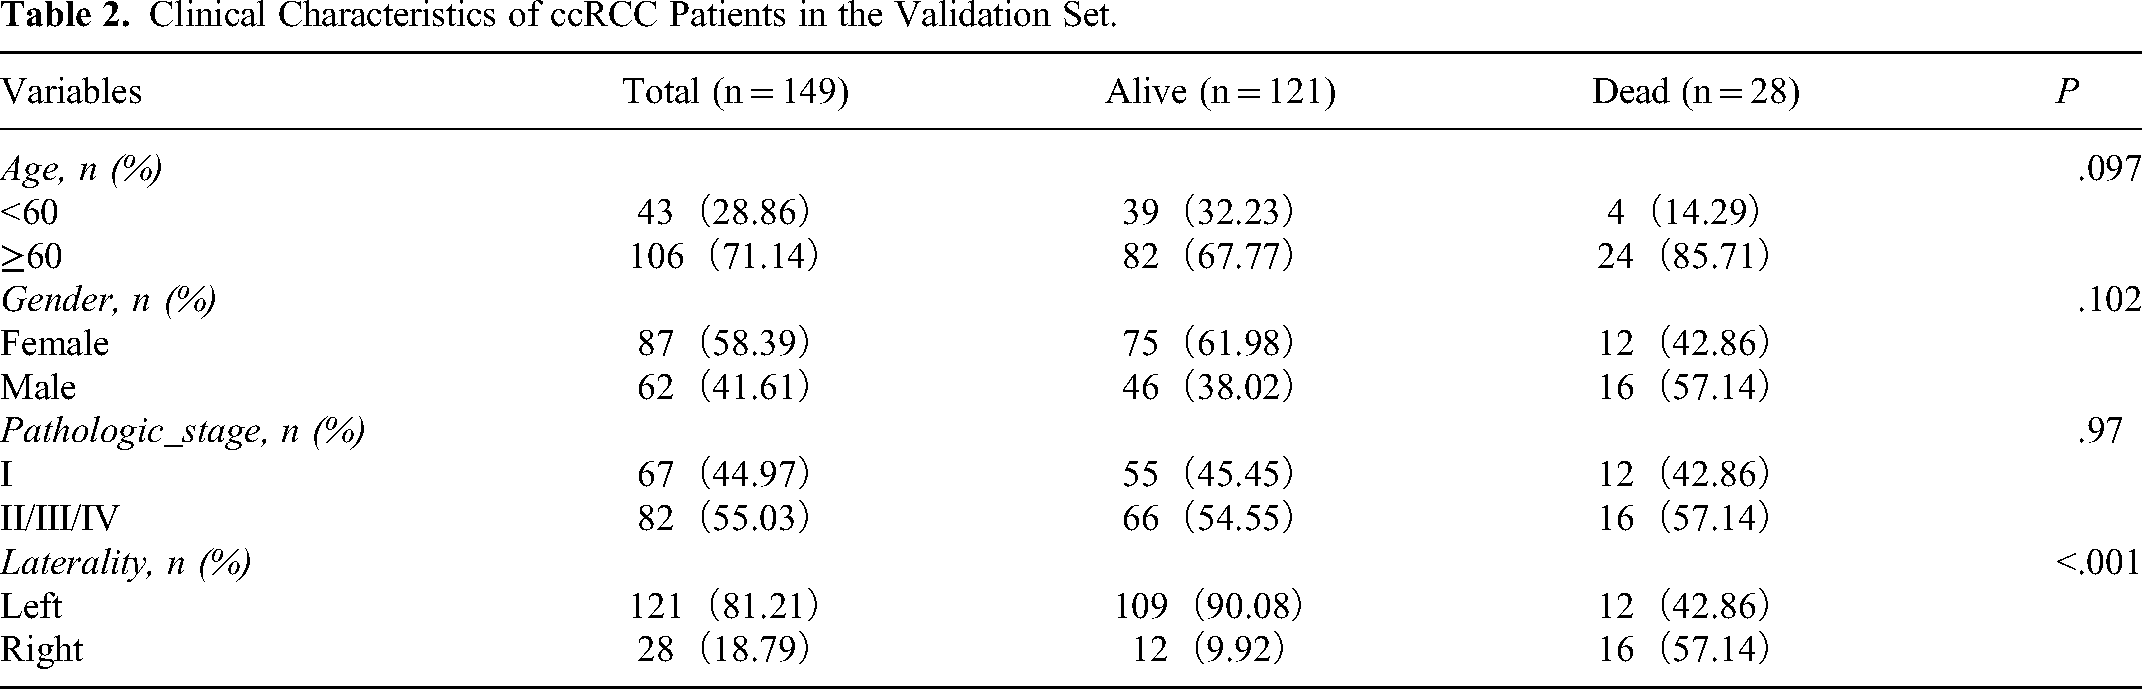
This study ultimately included a total of 503 patients diagnosed with ccRCC, sourced from the TCGA database and clinical cohort. Among them, 354 ccRCC patients from the TCGA database comprised the training set, while 149 patients clinically diagnosed with ccRCC constituted the validation set. Patients in both the training and validation sets were grouped based on OS as the grouping variable, categorized into Alive and Dead groups. Clinical features of patients in the training set (n = 354) and validation set (n = 149) are presented in Tables 1 to 2.
Clinical Characteristics of ccRCC Patients in the Training Set.

Clinical Characteristics of ccRCC Patients in the Validation Set.
Feature Selection of Pathomics and Construction of Pathomic Models
A total of 465 pathological features were extracted using PyRadiomics, and then 368 prognosis-related pathological features were further selected using the Repeat RSF method (Supplementary Table 1). The top 50 pathological features were visualized (Figure 2A). To explore the relationship between pathological features and clinical-pathological characteristics, Spearman correlation analysis was performed on the 386 prognosis-related pathological features and clinical-pathological features. The results (Supplementary Table 2 to 3) showed that in the training set, 155 (155/368, 42.12%), 229 (229/368, 62.23%), 292 (292/368, 79.35%), and 97 (97/368, 27.36%) pathological features were correlated with Histologic_grade, Neoplasm_status, Pathologic_stage, and Pharmaceutical_therapy, respectively. Additionally, in the validation set, we found that 198 (198/368, 53.80%) pathological features were associated with Pathologic_stage. Histologic_grade, Neoplasm_status, Pathologic_stage, and Pharmaceutical_therapy are all closely related to patient prognosis, and the Spearman correlation analysis results further support that the pathological features we selected are indeed associated with prognosis. Furthermore, these 368 prognosis-related pathological features were subjected to clustering analysis using the NMF method to obtain samples of different pathological subtypes. Based on the cophenetic value (the value at which the cophenetic value drops the most is 2), two pathological subtypes were identified: Cluster 1 and Cluster 2 (Figure 2B), with typical H&E staining images shown in Supplementary Figure 1. Consensus plot and clustering heatmap results demonstrated that these two pathological subtypes could be well distinguished (Supplementary Figure 2).

Construction of pathomic features for different subtypes. (A) Pathomic feature selection. (B) Line charts of cophenetic, dispersion, ever, residuals, rss, silhouette, and sparseness at rank = 2–5.
Evaluation of the Pathomic Model
Further, using the NMF algorithm, patients in both the training and validation sets were classified into Cluster 1 and Cluster 2. In the training set, there were 146 patients in Cluster 1 and 208 patients in Cluster 2. In the validation set, there were 40 patients in Cluster 1 and 109 patients in Cluster 2. Baseline characteristics of patients with different pathomic subtypes in both datasets are presented in Supplementary Tables 4 to 5. Subsequently, survival analysis was performed on all patients. In the training set, Kaplan-Meier curve results revealed a median survival time of 118.47 months for Cluster 1, while the median survival time for Cluster 2 could not be determined due to the low number of deaths. However, Kaplan-Meier curves indicated a significant association between Cluster 2 and worsened OS (P = .02, Figure 3A). In the validation set, neither Cluster 1 nor Cluster 2 reached the median survival time due to the limited number of deaths (Figure 4A).

Evaluation of pathomics subtypes in the training Set. (A) Kaplan-Meier survival analysis for the training set. (B) Univariate Cox regression analysis for the training set. (C) Multivariate Cox regression analysis for the training set.

Evaluation of pathomics subtypes in the validation Set. (A) Kaplan-Meier survival analysis for the validation set. (B) Univariate Cox regression analysis for the validation set. (C) Multivariate Cox regression analysis for the validation set.
To elucidate the impact of different pathomic subtypes on the prognosis of ccRCC, we conducted Cox regression analysis. In the training set, both univariate and multivariate analyses revealed that Cluster 2 was a risk factor for OS (P < .05, Figure 3B-C). In the validation set, the univariate analysis did not identify Pathologic_stage as a risk factor for OS. However, multivariate analysis results demonstrated that Cluster 2 was a risk factor for OS (P < .05, Figure 4B-C). Furthermore, subgroup analysis results indicated no significant differences in the association between different pathomic subtypes (Cluster 1/Cluster 2) and OS among patients aged below and above 60 years (interaction P > .05) in both the training and validation sets, suggesting no significant interaction between different pathomic subtypes and age subgroups. Similar results were observed in subgroup analyses based on demographic and clinical characteristics (Figure 5). These findings underscore the clinical significance of the pathomic model constructed in this study for the survival and prognosis of ccRCC patients.

Subgroup analysis of pathomics features. (A) Subgroup analysis of pathomics features in the training set, (B) Subgroup analysis of pathomics features in the validation set.
Functional and Pathway Enrichment Analyses
To explore the underlying biological mechanisms of different pathomic subtypes, differential gene analysis was performed using the “limma” package on ccRCC patients from Cluster 1 and Cluster 2 in the training set. In the training set, 76 differentially expressed genes (DEGs) were identified between the two distinct pathomic subtypes. Compared to the Cluster 1 group, the Cluster 2 group exhibited 29 significantly upregulated genes and 47 significantly downregulated genes (Figure 6A). Further GO pathway enrichment analysis revealed potential implications in various biological processes (BP), including extracellular matrix organization and extracellular structure organization. Additionally, cellular components (CC) such as collagen-containing extracellular matrix and molecular functions (MF) related to extracellular matrix structural constituents may be affected (Figure 6B).

Enrichment analysis of differentially expressed genes. (A) Volcano diagram of differentially expressed genes. (B) Enrichment analysis of GO database.
Immune Infiltration Analysis
As mentioned earlier, significant differences in outcomes exist among ccRCC patients with different pathomic subtypes. To investigate the underlying reasons and provide insights for immunotherapy, we explored differences in immune infiltration levels between different pathomic subtypes in the training set. The results revealed that dendritic cells exhibited higher levels of infiltration in Cluster 2, while B cells showed higher infiltration levels in Cluster 1 (P < .05, Figure 7A). Subsequently, we examined the expression of immune-related genes. The results indicated that the expression levels of most immune-related genes, such as CTLA4, CD80, and TIGIT, were higher in Cluster 2 (P < .05, Figure 7B). These findings suggest that Cluster 2 may be associated with higher levels of immune infiltration, but the high expression of immune-related genes may lead to a state of low responsiveness. Patients in the Cluster 2 group may benefit more from immune checkpoint inhibitors. 46

Analysis of immune infiltration. (A) Analysis of immune cell infiltration in Cluster 1 and Cluster 2. (B) Expression levels of immune-related genes in Cluster 1 and Cluster 2.
Mutation Analysis
The intersection of mutation data and pathomic data downloaded from the TCGA database for ccRCC patients amounted to 237 samples. Further mutation analysis was conducted using the maftools package to investigate reported kidney and renal cancer-related genes as well as classical oncogenic pathways.47–55 The mutation analysis results showed no significant difference in mutation frequencies between Cluster 1 and Cluster 2 (P > .05, Supplementary Table 4). In the training set, the mutation rates of VHL and PBRM1 genes were both higher than 40% in both Cluster 1 and Cluster 2. Additionally, the mutation rates of the PI3K-Akt, HIF-1, and MAPK signaling pathways were all greater than 40% in both clusters (Figure 8).

Mutation analysis of different pathomic subtypes.
Discussion
ccRCC is the most common histological subtype of RCC and one of the deadliest malignancies in the urinary system. 56 Despite significant advances in medical treatment and research, most patients are diagnosed at an advanced stage due to the paucity or absence of early symptoms, resulting in poor prognosis, limited treatment progress, and a lack of effective personalized treatment strategies. 57 Tumor, lymph node, and metastasis (TNM) staging is the main indicator for prognostic assessment in clinical practice for ccRCC. 58 However, existing studies have shown that the prognostic accuracy of TNM staging is not ideal, with significant differences in survival rates even among individuals in the same TNM stage. 59 Digital H&E imaging is a powerful tool in tumor diagnosis, containing rich pathological information. Some studies have demonstrated that quantitative pathological information can be used for disease diagnosis, risk stratification, and outcome prediction through appropriate feature extraction methods, namely pathomics. 19 Therefore, pathomics holds potential clinical value in predicting cancer prognosis and enhancing treatment strategies. 60 In this study, we employed machine learning methods to construct a pathomic model from H&E-stained images and predicted the prognosis of patients with pathomic features, followed by bioinformatics analysis to delve into the underlying mechanisms behind the pathomic model.
Traditional pathological diagnosis is conducted by experienced pathologists on H&E-stained slides magnified multiple times to evaluate the morphological characteristics of tumor cells. However, pathologists do not routinely describe more detailed information for each slide. Therefore, pathomics can serve as a useful tool to complement traditional pathological assessments. 61 Pathomics enables detailed spatial exploration of the entire tumor landscape and its most invasive elements from H&E-stained slide images. 62 Currently, machine learning models based on features extracted from H&E-stained images have been proven effective in the classification and prognosis of some tumors.17,63,64 For instance, Li et al 65 constructed a pathological feature based on H&E-stained specimens to predict the prognosis of esophageal squamous cell carcinoma patients treated with PD-1 inhibitors, and Chen et al 66 predicted prognostic factors for gastric cancer patients by constructing pathomic features. Similarly, in this study, pathomic features were screened using the Repeat RSF method, and a pathomic model was constructed using the NMF method. Further evaluation of the pathomic model showed that Cluster 2 was associated with poor prognosis and was a risk factor for OS in ccRCC, indicating the predictive value of the pathomic model for OS in ccRCC. Additionally, this machine learning approach based on pathomics can be extended to prognostic prediction in other tumors as well. 14
Next, we further explored the underlying mechanisms behind forming different pathomic subtypes. Initially, we analyzed DEGs between the two pathomic subtypes and further enriched the analysis of DEGs. The results suggest that the two pathomics subtypes may be associated with the tissue composition and structure of the extracellular matrix (ECM). ECM remodeling plays a crucial role in tumor progression and invasion, particularly in the later stages of tumor growth, when connective tissue cells are recruited and are expected to produce a significant amount of ECM, thereby influencing tumor growth and invasive behavior. 67 This finding highlights the important role of the tumor microenvironment in the progression of ccRCC. Additionally, we found that the expression of the immune-related gene CTLA4 was significantly elevated in Cluster 2. CTLA4 is an important immune checkpoint in tumors, located on the surface of T cells, contributing to the control of the body's immune response. When CTLA-4 binds to another protein, B7, on the surface of cancer cells, it prevents T cells from killing cancer cells. CTLA-4 inhibitors can bind to CTLA-4, enabling T cells to kill cancer cells. Among them, Ipilimumab is a CTLA-4 inhibitor. 68 It has been reported that the efficacy of combination therapy with Ipilimumab and nivolumab is superior to monotherapy with nivolumab in patients with intermediate/high-risk ccRCC. 69 In terms of immune infiltration, we found that CTLA4 was upregulated in Cluster 2, resulting in poor prognosis for patients. This is consistent with our previous findings obtained through radiomics. 70 This indicates that patients in Cluster 2 may have a better response to CTLA-4 inhibitors. This suggests that the pathomic model we constructed can provide guidance for the medication of ccRCC patients in the future.
In this study, we also found that the mutation rates of the HIF-1, PI3K-Akt, and MAPK signaling pathways were all above 40% in both Cluster 1 and Cluster 2. These pathways have significant clinical implications in ccRCC. First, HIF-1 is a crucial regulatory factor in ccRCC, arising from VHL inactivation, and it can promote lipid accumulation in ccRCC by inhibiting fatty acid metabolism, thereby facilitating cancer initiation and progression. 71 Furthermore, following VHL inactivation, both HIF-1α and HIF-2α are activated, which further enhances the activation of the MAPK and AKT/mTOR signaling pathways. 72 The activation of these pathways plays a vital role in tumor growth and invasion.73–75 Additionally, the HIF1a/VEGF-A axis is critical in tumor immunity. Studies have shown that the loss of HIF-1α in CD8+ T cells reduces the cytotoxicity against tumor cells, promotes tumor invasion, and alters tumor angiogenesis. 76 Therefore, we believe that this pathomics model can provide guidance for the clinical application of VEGF inhibitors, with the potential to optimize personalized treatment strategies for ccRCC patients.
Despite the construction of a pathomics feature model in this study to predict the prognosis of ccRCC patients and the use of bioinformatics analysis to unveil the underlying biological mechanisms of the pathomics features, it is important to acknowledge certain limitations of this research. First, the pathomics features were developed based on data from the TCGA database. While the quality of TCGA data is commendable, it is important to note that the clinical and pathological information of patients may have some incompleteness, which could introduce potential biases during the research and analysis process. Second, this study is inherently retrospective, which means its results may be influenced by inherent biases. Additionally, although there is an external validation set in this study, the patients were all from the same medical institution. Future prospective trials from different medical institutions are needed to further validate the effectiveness and reliability of the constructed pathomics features in clinical practice. Finally, while this study found that pathomics subtypes are associated with poor prognosis in ccRCC patients, the specific impact on survival outcomes remains unclear, requiring more foundational research and multicenter clinical studies for further validation. Therefore, future research should focus on addressing these gaps to advance the application of pathomics in the field of ccRCC.
Conclusion
This study develops a machine learning-based pathomic model to extract pathological features from H&E stained images and employs the NMF algorithm to classify ccRCC into two pathological subtypes. The establishment of these subtypes not only effectively predicts patient prognosis but also correlates with the expression of the immune checkpoint CTLA4 and the activity of the HIF-1, PI3K-Akt, and MAPK signaling pathways. The findings suggest that this subtype classification may offer crucial guidance and decision support for the personalized treatment of future ccRCC patients. This discovery opens up new avenues and directions for further exploration of the molecular mechanisms, diagnostic methods, and therapeutic strategies for ccRCC.
Supplemental Material
sj-docx-1-tct-10.1177_15330338241307686 - Supplemental material for Machine Learning-Based Pathomics Model to Predict the Prognosis in Clear Cell Renal Cell Carcinoma
Supplemental material, sj-docx-1-tct-10.1177_15330338241307686 for Machine Learning-Based Pathomics Model to Predict the Prognosis in Clear Cell Renal Cell Carcinoma by Xiangyun Li, Xiaoqun Yang, Xianwei Yang, Xin Xie, Wenbin Rui and Hongchao He in Technology in Cancer Research & Treatment
Supplemental Material
sj-xlsx-2-tct-10.1177_15330338241307686 - Supplemental material for Machine Learning-Based Pathomics Model to Predict the Prognosis in Clear Cell Renal Cell Carcinoma
Supplemental material, sj-xlsx-2-tct-10.1177_15330338241307686 for Machine Learning-Based Pathomics Model to Predict the Prognosis in Clear Cell Renal Cell Carcinoma by Xiangyun Li, Xiaoqun Yang, Xianwei Yang, Xin Xie, Wenbin Rui and Hongchao He in Technology in Cancer Research & Treatment
Footnotes
Abbreviations
Acknowledgements
We thank Ms. Ivy from Shanghai Hover International Education for her assistance with language editing.
Author Contribution Statements
Xiangyun Li: Methodology, Writing - Original Draft, Software. Xiaoqun Yang: Methodology, Writing-Original Draft, Software. Xianwei Yang: Methodology, Writing-Original Draft, Software. Xin Xie: Data Curation, Investigation, Formal analysis. Wenbin Rui: Visualization, Writing-Review & Editing, Supervision. Hongchao He: Conceptualization, Writing - Review & Editing, Supervision.
Data Availability
All analyzed data are included in this published article. The original data are available upon reasonable request to the corresponding author.
Declaration of Conflicting Interests
The authors declared no potential conflicts of interest with respect to the research, authorship, and/or publication of this article.
Ethical Statement
This study obtained ethical approval from the Ethics Committee of Ruijin Hospital, affiliated with Shanghai Jiao Tong University School of Medicine (No. KY2020-322).
Funding
The authors received no financial support for the research, authorship, and/or publication of this article.
Informed Consent
Written informed consents were obtained from the participants for the collection of all samples.
Supplemental Material
Supplemental material for this article is available online.
References
Supplementary Material
Please find the following supplemental material available below.
For Open Access articles published under a Creative Commons License, all supplemental material carries the same license as the article it is associated with.
For non-Open Access articles published, all supplemental material carries a non-exclusive license, and permission requests for re-use of supplemental material or any part of supplemental material shall be sent directly to the copyright owner as specified in the copyright notice associated with the article.