
Abstract
Background
Acute myeloid leukemia (AML) with Fms-like tyrosine kinase 3 gene internal tandem duplication (FLT3-ITD) mutations has a poor prognosis. The combination of arsenic trioxide (ATO) and all-trans retinoic acid (ATRA) has a synergistic killing effect on leukemia cells with FLT3-ITD mutation. However, the mechanism, especially the changes of gene expression and metabolic activity remain unclear. Here we explore the transcriptome and metabolomics changes of FLT3-ITD AML cells treated with ATO/ATRA.
Methods
RNA-seq was used to identify differential expressed genes (DEGs), and ultra-high performance liquid chromatography-quadrupole electrostatic field orbital trap mass spectrometry (UHPLC-QE-MS) nontargeted metabolomics method was used to screen out the differential metabolites in FLT3-ITD mutant cell lines treated with ATRA and ATO. KEGG pathway database was utilized for pathway exploration and Seahorse XF24 was used to detect extracellular acidification rate (ECAR). Metabolic polymerase chain reaction (PCR) array and real-time quantitative PCR (RT-qPCR) were used to detect mRNA levels of key metabolic genes of glycolysis and fatty acid after drug treatment.
Results
A total of 3873 DEGs were identified and enriched in 281 Gene Ontology (GO) terms, among which 210 were related to biological processes, 43 were related to cellular components, and 28 were related to molecular functions. Besides, 1794 and 927 differential metabolites were screened in positive and negative ion mode separately, and 59 different metabolic pathways were involved, including alanine-aspartate-glutamate metabolic pathway, arginine, and proline metabolic pathway, glycerophospholipid metabolic pathways, etc. According to KEGG Pathway analysis of transcriptome combined with metabolome, glycolysis/gluconeogenesis pathway and fatty acid metabolism pathway were significantly founded enriched. ATRA + ATO may inhibit the glycolysis of FLT3-ITD AML cells by inhibiting FLT3 and its downstream AKT/HK2-VDAC1 signaling pathway.
Conclusions
The gene transcription profile and metabolites of FLT3-ITD mutant cells changes significantly after treatment, which might be related to the anti-FLT3-ITD AML effect. The screened DEGs, differential metabolites pathway are helpful in studying the mechanism of anti-leukemia effects and drug targets.
Introduction
Acute leukemia is one of the most common malignant tumors in children, and acute myeloid leukemia (AML) accounts for about 15% to 20% of childhood leukemia. 1 The 5-year event-free survival (EFS) rate of AML patients is about 60%, while the 5-year EFS of AML patients with Fms-like tyrosine kinase 3 gene internal tandem duplication (FLT3-ITD) mutation is only 7%-25% (excluding acute promyelocytic leukemia (APL)).2,3 FLT3-ITD mutation occur in about 10% of pediatric AML and 30% of adult AML, which are independent prognostic factors. FLT3-ITD mutation causes autonomous phosphorylation and activation of FLT3 protein, which continuously activates downstream signaling pathways and leads to abnormal proliferation of leukemia cells, leading to the occurrence, refractory and recurrence of leukemia.4–7 At present, small-molecule tyrosine kinase inhibitors (TKIs) are the main treatment for FLT3-ITD mutant AML.4,8 In recent years, a lot of inhibitors have been developed mainly to reduce the phosphorylation of FLT3 rather than to reduce the level of FLT3 mutant protein. The results of several phase I/II clinical trials show that although small-molecule inhibitors can improve the response rate of early induction therapy in FLT3-ITD mutant AML, the effect is often short-lived, and most of them are not ideal for improving the overall prognosis. Therefore, the emergence of drug resistance is still a challenge for clinical application.4,6,9
Different leukemia cells also have different metabolic characteristics. Studies have shown that compared with FLT3 wild-type AML cells, FLT3-ITD mutant AML cells have stronger activity of aerobic glycolysis.10,11 Inhibition of cell glycolysis activity can specifically damage FLT3-ITD leukemia primary cells, but it is weak to FLT3 wild-type leukemia cells and has basically no effect on normal cells.10,12 The combination of glycolysis inhibitor (2-DG) and FLT3 inhibitor (sorafenib, a multi-target TKI, effective in AML patients with FLT3-ITD mutations) in FLT3-ITD mutant AML mice resulted in longer survival than sorafenib alone (41 days vs 32 days). 10 This study suggests that the metabolic abnormalities of FLT3-ITD leukemia cells can be used for targeted therapy.
Arsenic trioxide (ATO) and all-trans retinoic acid (ATRA) have been used in the treatment of several cancers, including leukemia, and have been extensively studied to demonstrate efficacy in APL. 13 Our multicenter clinical study showed that ATO and ATRA combined with low-intensity chemotherapy could increase the expected 5-year EFS of children's APL to 100%. 14 Studies have shown that ATRA can also regulate lipid and glucose metabolism.15–17 Therefore, there are international studies on the potential use of ATO and ATRA in the treatment of other tumors.
Our previous studies showed that the combination of ATO and ATRA could reduce the protein level of FLT3-ITD and attenuate the downstream molecular signal transmission, including FLT3/AKT, and selectively kill FLT3-ITD AML cells. 18 The combination of ATO and ATRA significantly reduced the leukemia burden of bone marrow in FLT3-ITD AML mice. 19 These results suggest that ATO + ATRA may have a good potential therapeutic effect on FLT3-ITD AML cells. However, the changes in gene expression and metabolic activity of ATO + ATRA in FLT3-ITD AML cells are rarely studied. This study reveals transcriptome and metabolomics of FLT3-ITD AML Treated with ATO and ATRA and explore the effects of ATRA and ATO on the metabolism of FLT3-ITD AML cells, which may lead to new treatment insights for FLT3-ITD AML.
Methods
Cell Line
Human AML cell lines MV411 (FLT3-ITD mutant), Molm13 (FLT3-ITD mutant) were purchased from TICC. Mouse cell lines BaF3 (FLT3 wild-type), BaF3/ITD (FLT3-ITD mutant) were provided by the Laboratory of Professor Huang Peng (Sun Yat-sen University Cancer Center). All cells were cultured with RPMI 1640 medium (Gibco) in an incubator (37 °C 5%CO2).
Experimental Drug
ATRA was Purchased from Beijing Soleibo Technology Co., LTD, 1 mM was prepared with DMSO as solvent, and stored at −20 °C. The shelf life was 1 month before replacement. ATO was purchased by the hospital procurement department after being examined by the Guangzhou Food and Drug Administration.
MRNA Isolation and Quantitative Real-Time polymerase chain reaction
RNA was isolated from cells using the RNA-Quick Purification Kit (ES Science); Reverse transcription and real-time polymerase chain reaction (PCR) were performed according to the PrimerScript RT Reagent Kit instructions. Glyceraldehyde-3-phosphate dehydrogenase(GAPDH) was used as an internal reference to quantify gene expression by the 2-ΔΔCT formula. The sequences of the primers used are as follows:
FLT3 5ʹ- CACGAACCCCCTGAAATTGTG-3ʹand 5ʹ-TACAACCCCTGTTGTTGCAGA-3ʹ
Hexokinase 2 (HK2) 5ʹ- TTGACCAGGAGATTGACATGGG-3ʹand 5ʹ-CAACCGCATCAGGACCTCA-3ʹ
Voltage dependent anion channel 1(VDAC1) 5ʹ- ACTAATGTGAATGACGGGAC-3ʹand 5ʹ-CAAGATTGACAGCGGTCTC-3ʹ
MYC 5ʹ- CGTCCTCGGATTCTCTGCTC-3ʹand 5ʹ-GCTGGTGCATTTTCGGTTGT-3ʹ
ACACB 5ʹ-AGAAGACAAGAAGCAGGCAAAC-3ʹand 5ʹ-GTAGACTCACGAGATGAGCCA-3ʹ
FASN 5ʹ-ACAGCGGGGAATGGGTACT-3ʹand 5ʹ-GACTGGTACAACGAGCGGAT-3ʹ
ME1 5ʹ-GGGAGACCTTGGCTGTAATGG-3ʹand 5ʹ-TTCGGTTCCCACATCCAGAAT-3ʹ
MGLL 5ʹ-TCGTCAGGGATGTGTTGCAG-3ʹand 5ʹ-AGGCGAAATGAGTACCATGCC-3ʹ
GAPDH 5ʹ-AACGGATTTGGTCGTATTGG-3ʹ and 5ʹ-GTAGAAGGTCCTCGCTCTAG-3ʹ
Transcriptome Analysis
MV411 and BaF3/ITD cells in logarithmic growth phase were collected, and each cell line was divided into control group and drug group (ATRA 2 μm, ATO 1.5 μm) with 5 × 10⁶ cells in each group. After 24 h of treatment, cells were collected by centrifugation (centrifugation speed was 3000 r/min for 5 min). RNA extraction was performed using RNeasy Mini Kit (250) Qiagen#74106 Kit. Quality inspection was performed using Agilent Bioanalyzer 2100 (Agilent Technologies), Total RNA was quantified using Qubit®3.0 Fluorometer and Nanodrop One spectrophotometer. RNA libraries were constructed and detected by Qubit® 3.0 Fluorometer for concentration and Agilent2100 for size. Sequencing was performed according to the Illumina NovaSeq 6000 User Guide. The original sequencing data were in FASTQ format, and were sorted into expression value results of transcript level after analysis and processing. Finally, the differential transcripts were calculated and displayed.
In the analysis of mRNA sequencing, the expression of each gene was calculated for each sample using FPKM (Fragments Per Kilobase Million) as the calculated amount. The differential analysis of gene expression between samples/groups was performed using the edgeR software package, and multiple hypothesis tests were performed to correct for the p-value after the calculation. The p-value was corrected by controlling the false discovery rate (FDR) to determine the threshold of P-value, and the corrected p-value is called Q value. Meanwhile, the differential expression fold change, abbreviated as FC, was calculated based on the FPKM value, which is often expressed as log2(FC).
Metabolomics Analysis (Ultra-High Performance Liquid Chromatography-Quadrupole Electrostatic Field Orbital Trap Mass Spectrometry Nontarget Metabolomics Detection)
The MV411 cells were amplified and divided into groups with 1 × 10⁷ cells (5 biological replicates) in each group. The concentration of ATRA was 1 μm and ATO 0.75 μm in the treatment group. After 12 h of treatment, the cells were collected, quenched in liquid nitrogen for 30 s, and a certain proportion of extract (methanol: acetonitrile: water = 2:2: 1 (V/V), containing isotopically labeled internal standard mixture), for grinding and ultrasonic treatment. The target compounds were separated by chromatography on an Agilent 1290 (Agilent Technologies) ultra-performance liquid chromatograph through a Waters ACQUITY UPLC BEH Amide (2.1*100 mM, 1.7 μm) liquid chromatographic column. Liquid chromatography phase A was aqueous, containing 25 mmol/L ammonium acetate and 25 mmol/L ammonia, and phase B was acetonitrile. The application software (Xcalibur, version 4.0.27, Thermo) was used for primary and secondary mass spectrometry data acquisition. After the original data were converted into mzXML format by ProteoWizard software, the R program package (XCMS kernel) written by Biotree was used for peak identification, peak extraction, peak alignment, and integration, then matched with BiotreeDB (V2.1) self-built secondary mass spectrometry database for material annotation. The Cutoff value of the algorithm score is set to 0.3.
Real-Time Bioenergy Metabolism Analysis
Seahorse XF24 was used to detect extracellular acidification rate (ECAR). Cells were cultured and processed with specific analytical media, and Wave software was used to record and process the data obtained.
Determination of Glucose Absorption and Lactate Production
The biosensor SBA-40CSBA-40C can be used to quickly detect the content of glucose, lactic acid, glutamate, and other important biological metabolites in the culture medium. MV411 or BaF3/ITD cells in the logarithmic growth phase were plated at a density of 5 × 10⁵ cells per well, 1 ml per well, and duplicate Wells were set up. At the same time, a fresh medium without cells was set as blank control. Cells were treated with drugs according to different treatment groups and cultured for 24 h or 48 h. The biosensor was automatically rinsed and calibrated, and then 25 μL samples were quickly added as prompted to read the glucose or lactate content values, then the data were recorded and processed.
Statistical Analysis
All experimental data were expressed as mean ± standard deviation. Student's t test was used for significance analysis between 2 groups of data, and one-way ANOVA test was used for significance analysis between more than 2 groups of data. P < .05 indicated statistically different. All data were analyzed and graphed using GraphPad Prism 7.0 software.
Results
Transcriptomic Analysis of FLT3-ITD Positive AML Cells Treated with ATO and ATRA
After 24 h treated with ATRA and ATO, a total of 3873 differential expressed genes (DEGs) were identified by RNA-seq (FC ≤ 0.5 or FC ≥ 2, and Q value < 0.05). Partial information of DEGs are shown in Table 1 and Table S1. Among them, 2825 genes were up-regulated, and 1048 genes were down-regulated, as shown in Figure 1A. The DEGs were processed by the method of normal distribution correction transformation, and the hierarchical clustering algorithm was applied to show the results of cluster analysis in the form of thermal map. As shown in Figure 1B, each small square represents a gene, red represents up-regulated gene, and green represents down-regulated gene. After treatment of ATO and ATRA, the overall expression pattern of genes was significantly different from that of the control group: in the ATO and ATRA treatment group, most genes showed up-regulated expression pattern (red bands). The expression patterns of the 3 samples in the experimental group were similar, indicating good repeatability of the samples (the same as the control group).

Transcriptomic analysis of FLT3-ITD positive AML cells treated with ATO and ATRA. (A) Scatter map of DEGs. group6: MV411 cells treated with ATRA 2 μM + ATO 1.5μM for 24 h. group5: MV411 cells without treatment. (B) heatmap of DEGs. EG represents the experimental group and CG represents the control group. Each group had 3 biological replicates. (C) GO functional distribution map DEGs based on GO database Level2. (D) Partial pathway enrichment of DEGs. (E) KEGG pathway diagram (Take fatty acid biosynthesis as an example). Abbreviations: ATO, arsenic trioxide; AML, acute myeloid leukemia; ATRA, all-trans retinoic acid; DEGs: differential expressed genes; FLT3-ITD, Fms-like tyrosine kinase 3 gene internal tandem duplication.
List of Partial Upregulated Differential Expressed Genes.

Gene ID: Ensembl Gene ID; group6: FPKM value of MV411 cells treated by experiment; group5: FPKM value of MV411 cells in the control group; log2 fold change (FC): Differential expression factor; Q value: The corrected P value.
To understand the biological functions of DEGs in vivo or in cells, each DEG was annotated based on Gene Ontology (GO) database. The differential genes were significantly enriched in 281 GO terms (q-value < 0.05), among which 210 were related to biological processes, 43 were related to cellular components, and 28 were related to molecular functions. Figure 1C shows the distribution of enriched items of DEGs at the 3 GO levels, only the results of the second level in the GO database are shown. In general, DEGs may be concentrated in some biological functions or active in some pathways, resulting in a phenotype that distinguishes an organism from others. Use KEGG database (https://www.kegg.jp/kegg/pathway.html) to identify the genetic differences mainly related to the biological function and pathway. Partial enrichment pathway results are shown in Figure 1D. Differentially expressed genes were marked on the KEGG pathway map, with up-regulated DEGs in red and down-regulated DEGs in green. Take Fatty acid biosynthesis as an example, as shown in Figure 1E.
Metabolomics Analysis of FLT3-ITD Positive AML Cells Treated with ATO Combined with ATRA
We used SIMCA software (V15.0.2, Sartorius Stedim Data Analytics AB) for log conversion and centralized formatting of the Data. QC samples are closely clustered, indicating that the ultra-high performance liquid chromatography-quadrupole electrostatic field orbital trap mass spectrometry (UHPLC-QE-MS) system has good stability and reliable data. The samples of each experimental group have good reproducibility. There are differences among the samples in each group, and the metabolite data are very different, which is of significance for analysis. PCA analysis showed that the metabolites of ATO + ATRA group were significantly different from those of NC group (Figure 2A, B).

Metabolomics analysis of FLT3-ITD positive AML cells treated with ATO combined with ATRA. (A) (B) PCA plots of ATO + ATRA group versus NC group in positive and negative ion modes were obtained. (C) (D) The OPLS-DA model of ATO + ATRA group versus NC group in positive and negative ion modes. (E) (F) Permutation test of OPLS-DA model in positive and negative ion modes. Abbreviations: ATO, arsenic trioxide; AML, acute myeloid leukemia; ATRA, all-trans retinoic acid; FLT3-ITD, Fms-like tyrosine kinase 3 gene internal tandem duplication.
The data were analyzed using orthogonal partial least squares-discriminant analysis (OPLS-DA). As shown in Figure 2C, D, the R2X and R2Y of OPLS-DA model in ATO + ATRA group were 0.427 and 0.999, respectively. In the permutation test, the order of categorical variables Y was randomly changed, and the corresponding OPLS-DA model was established for several times (n = 200) to obtain the R and Q values of the random model. As shown in Figure 2E, F, the Q2 values of the random model in the permutation test were all smaller than those of the original model. The intercept between the regression line of Q2 and the vertical axis is < 0; At the same time, with the gradual reduction of permutation retention, the proportion of the permutation Y variable increases, and the Q2 of the random model gradually decreases. It shows that the original model is reliable and there is no over-fitting phenomenon.
The screening condition of differential metabolites was set as the P-value of Student's t-test < .05. The variable importance in the projection of the first principal component of the OPLS-DA model is higher than 1. After analysis, a total of 1794 differential metabolites were screened in positive ion mode, among which 1262 differential metabolites were up-regulated, and 532 differential metabolites were down-regulated. A total of 927 differential metabolites were screened in negative ion mode, among which 504 were up-regulated and 423 were down-regulated. The main differential metabolites are shown in Tables S2-S4. The results of screening differential metabolites were visualized in the form of volcano plot, as shown in Figure 3A,3B.

(A) (B) Volcanic maps of differential metabolites between ATO + ATRA group and control group in positive and negative ion modes. (C) (D) Bubble diagrams of differential metabolic pathways between ATO + ATRA group and control group in positive and negative ion modes. Abbreviations: ATO, arsenic trioxide; ATRA, all-trans retinoic acid.
After screening the differential metabolites, we mapped the authoritative metabolite databases such as KEGG and PubChem through the differential metabolites. After obtaining the matching information of the differential metabolites, we searched the pathway database of the corresponding species Homo sapiens (human) and analyzed the metabolic pathway. In total, 59 different metabolic pathways with significant differences were listed. As shown in Table 2 and Table S5, in the positive ion mode, the metabolic pathways with significant differences were arginine and proline metabolic pathways, β-alanine metabolic pathways, glycerophospholipid metabolic pathways, glutathione metabolic pathways, etc In the negative ion mode, the metabolic pathways with significant differences were taurine metabolic pathways, alanine-aspartate-glutamate metabolic pathway, arginine and proline metabolic pathway, aminoacyl-tRNA biosynthesis pathway, purine metabolic pathway, citrate cycle (TCA cycle) pathway, etc. The results of the above metabolic pathway analysis are presented as bubble graph, as shown in Figure 3C, D.
Significantly Enriched Differential Metabolic Pathways in Positive Ion Mode.

Total: The number of metabolites in this pathway; Hits: The number of differentially expressed metabolites that hit the pathway; Raw p: P-values for enrichment analysis of metabolic pathways; -ln(P): The P value is the negative log base e (negative natural log base); FDR: P-values corrected by multiple hypothesis testing using false discovery rate (FDR) method; Impact: Impact value of topological analysis of metabolic pathways.
Combined Analysis of ATO + ATRA on FLT3-ITD Positive AML Cells Significantly Different Metabolic Pathways
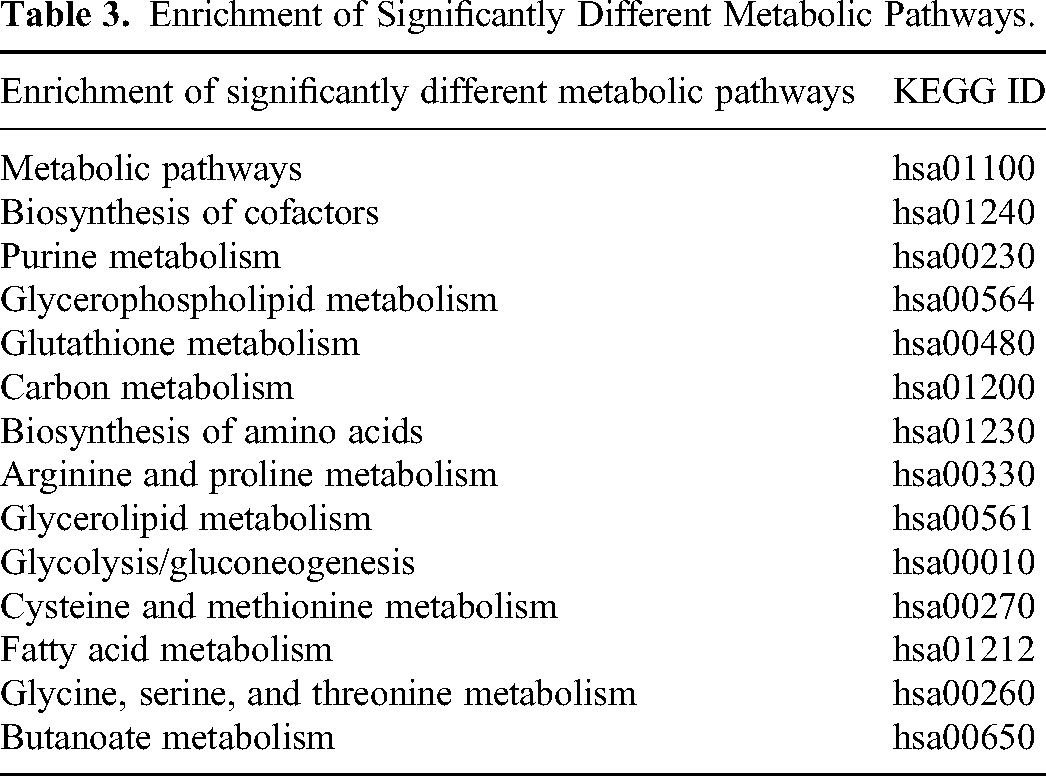
We imported the differentially expressed genes and metabolites into the KEGG pathway database, and a total of 32 significantly differentially expressed metabolic pathways were found, corresponding to pathways mapped by Homo sapiens(human) as shown in Table 3 below. The differential genes and metabolites found in this study were labeled in the Metabolic pathways chart of KEGG, with red representing up-regulated and green representing down-regulated. As shown in Figure 4, there are significant changes in multiple metabolic pathways in FLT3-ITD AML cells treated with ATRA and ATO.

KEGG pathway diagram.
Enrichment of Significantly Different Metabolic Pathways.
According to KEGG Pathway analysis of transcriptome combined with metabolome, we found that the glycolysis/gluconeogenesis pathway was also significantly enriched. As mentioned in the foreword, a previous study has shown that FLT3-ITD mutant leukemia cells have higher glycolytic metabolism level than FLT3 wild-type leukemia cells, and ATRA + ATO can inhibit FLT3, which may then inhibit the AKT/HK2-VDAC1 pathway related to glycolytic metabolism. Therefore, it is hypothesized that ATRA + ATO may kill FLT3-ITD AML cells by affecting the metabolic process of glycolysis. To test whether the combination influenced intracellular metabolism in leukemia cells, we used the Seahorse XF-24 real-time metabolic analyzer to monitor the rate of cell acidification (ECAR) as a proxy for glycolytic function. Figure 5A showed that after ATRA combined with ATO treatment, the glycolytic capacity and maximum glycolytic capacity of MV411 cells were significantly decreased, indicating that ATRA combined with ATO would damage glycolytic function of FLT3-ITD AML cells and affect cell energy supply. Next, we used a biosensor to measure the changes in glucose uptake and lactate production in FLT3-ITD-positive cells induced by ATRA + ATO. As shown in Figure 5B, at different time points of 24 h and 48 h, with the increase of drug treatment time, the glucose intake and lactate production in the ATRA + ATO combination treatment group were significantly decreased compared with the control group and the single drug group. This result was consistent with the ECAR value monitored by Seahorse, indicating that the glycolytic metabolism level of the cells was significantly reduced after ATO + ATRA treatment.

(A) Effects of ATRA (1 μmol) combined with ATO (0.75 μmol) on glycolysis of MV411 cells. After 24 h treatment with different drugs. Glucose, Oligomycin and 2-DG were added in Seahorse instrument to detect the ECAR value of cell acidification rate in real time. Bars means ± SD. *P < .05, n = 5. (B) The effects of ATRA (1 μmol) combined with ATO (0.75 μmol) on glucose intake and lactate production in MV411 cells and Molm13 cells. Under different drug treatment conditions, MV411 and Molm13 cells were cultured to 24 h or 48 h, and the relevant values were detected respectively. Bars means ± SD. *P < .05, **P < .01, ***P < .001 n = 3.(C) After MV411 cells were treated with drugs for 24 h, the Metabolic PCR Array was used to detect mRNA levels of key metabolic genes. (D) mRNA transcription levels were detected by RT-qPCR after drug treatment for 24 h. Bars means ± SD. *P < .05, **P < .01 ****P < .0001 n = 3. Abbreviations: ATO, arsenic trioxide; ATRA, all-trans retinoic acid; ECAR, extracellular acidification rate; PCR, polymerase chain reaction.
Furthermore, we detected the transcription and expression of genes related to glycolytic metabolism. Metabolic PCR Array (designed by Professor Liu Xiaoxia, patent No. ZL201710200640.0) was used to detect the changes of key Metabolic genes. After treating with ATRA and ATO of MV411 cells for 24 h, the mRNA levels of FLT3, MYC, HK2 and VDAC1 were significantly reduced (Figure 5C, D). FLT3-ITD and MYC are mutually positive feedback regulation genes. 15 These results suggest that ATRA + ATO may inhibit the glycolysis of FLT3-ITD AML cells by inhibiting FLT3 and its downstream AKT/HK2-VDAC1 signaling pathway.
According to our transcriptome and metabolome results, the combination of ATO and ATRA not only affected a certain metabolic pathway, but also up-regulated or down-regulated a variety of metabolic pathways. From the KEGG pathway analysis of transcriptome combined with metabolome, we noticed that the fatty acid metabolism pathway was one of the significantly different metabolic pathways. In recent years, abnormal lipid synthesis and catabolism have been found to be associated with carcinogenesis. When the Metabolic PCR Array introduced above was used to detect changes in key Metabolic genes, we also found significant changes in key genes related to fatty acid metabolism pathways, such as ACACB (acetyl-CoA carboxylase β) and FASN (fatty acid synthetase) (Figure 6). Similar results were obtained by real-time quantitative PCR (RT-qPCR) to detect the genes of fatty acid metabolism related enzymes in ATRA + ATO treated MV411 cells. However, the specific changes and significance of fatty acid metabolism process need to be further studied.

Transcriptional changes of fatty acid metabolism-related genes in MV411 cells treated with ATRA and ATO. (A) Metabolic PCR Array was used to detect mRNA levels of key metabolic genes after 24 h treatment. (B) mRNA transcription levels were detected by RT-qPCR after drug treatment for 24 h. Bars means ± SD. n = 3. Abbreviations: ATO, arsenic trioxide; ATRA, all-trans retinoic acid; PCR, polymerase chain reaction.
Discussion
At present, children with FLT3-ITD mutation in pediatric AML often have poor treatment effect, which makes it an urgent problem to find new effective drugs. Our previous study found that ATO, ATRA or a combination of them can selectively kill FLT3-ITD AML cells, mainly by inhibiting FLT3 and its downstream signaling pathways. 18 The mechanism may be multilevel, which is necessary for further study.
Firstly, high-throughput mRNA sequencing analysis was performed in this study, and 3873 differentially expressed genes were found in MV411 cells treated with ATRA + ATO, indicating that the intracellular transcriptional mRNA levels were significantly changed after drug treatment. The enrichment analysis of the differentially expressed genes based on the GO database can provide information about the significant changes in biological processes, cellular components, and molecular functions of FLT3-ITD mutant leukemia cells during drug treatment.
Metabolites are downstream products of the genome, which can be used to discover the molecular basis of biological phenomena. The analysis of metabolites can obtain important information about cell metabolism and regulation. In this study, a total of 1794 differential metabolites were screened out under the positive ion mode through nontarget metabolomics analysis, among which 1262 differential metabolites were up-regulated and 532 were down-regulated, and most genes showed an up-regulated trend. Based on the analysis of different metabolites pathways shows 34 different metabolic pathways in MV411 cells treated with ATRA + ATO, including arginine and proline metabolic pathways, beta alanine metabolism pathway, glycerol phospholipid metabolism pathway, GSH metabolism pathways, etc. A total of 927 differential metabolites were screened in negative ion mode. Pathway analysis based on differential metabolites showed that there were 25 different metabolic pathways in MV411 cells treated with ATRA + ATO, and the significant metabolic pathways were alanine, aspartate and glutamate metabolic pathways, arginine and proline metabolic pathways, purine metabolic pathways, citrate cycle (TCA cycle) pathways, etc.
Metabolic reprograming has been observed in tumor cells. Numerous studies have found that Warburg effect and dysregulation of fatty acid and amino acid synthesis/catabolism play an important role in tumor cell growth.20,21 Amino acids are not only substrates for protein synthesis, but also play an important role in supporting tumor cell growth. Glutamine, as the most abundant free amino acid, participates in a series of pathways in energy production, macromolecular synthesis, and signal transduction in tumor cells by providing nitrogen and carbon. 22 Studies have shown that the oncogenic transcription factor C-MYC can activate the expression of glutaminase and regulate glutamine metabolism.23,24 Increased glutamine metabolism is a common metabolic change in tumor cells. 25 Besides, arginine is an essential amino acid, and in environments lacking arginine, many tumor cells die rapidly. 26 In addition to amino acid metabolism, fatty acid metabolism is also considered another important metabolic abnormality in tumor cells.27,28 Fatty acid synthase (FASN) is involved in the whole process of de novo fatty acid synthesis and is highly expressed in many types of cancers.29,30 Glucose metabolism, as the main source of cellular energy, is very important. Glycolysis is the main way of glucose metabolism, and its metabolite pyruvate can be converted into lactic acid, which can be secreted as the final product to the cell or enter the mitochondria for TCA cycle and oxidative phosphorylation.31,32 The glycolytic pathway can also branch into the pentose phosphate pathway and serine synthesis pathway through its intermediate products. Through metabolomics analysis, we found that fatty acid metabolism and glucose metabolism pathways have significant changes in different degrees. This study shows that the combination of ATRA and ATO in various metabolic pathways may prevent the metabolic reprograming that tumor cells depend on for survival and achieve specific killing, which needs further study in the future.
This study is the first to integrate data differences between transcriptome and metabolomics, and a total of 32 significantly different metabolic pathways were identified, including glycolysis/gluconeogenesis and fatty acid metabolism. The results of the glycolytic stress test showed that the glycolytic activity of MV411 cells was significantly decreased after ATRA + ATO treatment, and the glucose intake and lactate production were decreased, accompanied by a decrease in the transcription levels of FLT3, MYC, and key glycolytic enzymes HK2 and VDAC1. Previous studies by our team and other researchers have shown that glycolysis of FLT3-ITD AML cells is at a high level, 10 and glycolysis is relied on to maintain their survival and proliferation, which is an important cause of refractory and relapse. In FLT3-ITD AML cells, FLT3-ITD mutant gene is spontaneously and continuously activated without dependence on ligand, and MYC and FLT3 are positive feedback to each other, which plays a role in enhancing FLT3 expression. 19 Glycolysis is mainly related to HK2 and VDAC1. HK2 is located in the outer membrane of mitochondria and is the first key enzyme in the glycolytic metabolic pathway, producing glucose-6-phosphate by phosphorylating glucose. VDAC1 is a type of pore protein ion channel located in the outer membrane of mitochondria. 33 Combination of HK2 with VDAC1 triggers the opening of the channel, releases mitochondrial ATP, and promotes the coupling of glycolysis and mitochondrial oxidative phosphorylation, greatly increasing ATP production to meet the energy needs of cells, and plays an important role in maintaining a constant source of energy for tumor cell proliferation. 34 Research has shown that HK2 is highly expressed in FLT3-ITD AML cells, which is consistent with the high level of glycolysis in this leukemia cell. In addition, the binding of HK2-VDAC1 also plays another important role in inhibiting apoptosis. 35 Meanwhile, HK2 is a downstream signaling molecule of FLT3/AKT signaling pathway. 10 Combined with the results of this study, ATO and ATRA may impair the glycolytic function of FLT3-ITD AML cells and affect the energy supply of AML cells by inhibiting the expression of FLT3-ITD and inhibiting the AKT/HK2-VDAC1 signaling pathway. It may be another important mechanism of ATRA + ATO against FLT3-ITD AML. In addition, several key enzymes related to fat metabolism showed an obvious uptrend or downtrend, indicating that ATRA combined with ATO may simultaneously affect multiple pathways of energy metabolism in FLT3-ITD cells, and its significance needs to be further studied.
This study also has some limitations. The experimental results in this study have not been further validated in animal models and patient specimens. In addition, although our study found significant differential metabolic pathway on FLT3-ITD mutant leukemia cells treated with ATRA and ATO, such as glycolysis and its downstream signaling pathways AKT/HK2-VDAC1, suggesting that it may be related to the anti-FLT3-ITD AML mechanism of ATO and ATRA, it remains further research for clinical application in the future.
Conclusions
In conclusion, after ATRA + ATO treatment, the gene transcriptional profile of FLT3-ITD AML cells was significantly changed, and most genes showed an up-regulated trend. The DEGs were involved in various aspects related to the biological process, cellular components, and molecular function of FLT3-ITD AML. After ATRA + ATO treatment, more metabolites were up-regulated or down-regulated in FLT3-ITD AML cells. It may be related to the effect of killing FLT3-ITD AML cells. ATRA + ATO may impair the glucose metabolism of FLT3-ITD AML cells, and kill leukemia cells by inhibiting FLT3 and its downstream signaling pathways related to glycolysis, such as AKT/HK2-VDAC1. ATO and ATRA have been used clinically for many years and their pharmacokinetics are known. Compared with the research and development of new drugs, this study is easier to apply to clinical practice, and the conversion cost is low. To study the mechanism of ATO combined with ATRA on FLT3-ITD mutant leukemia has practical significance for clinical application in the future.
Supplemental Material
sj-docx-1-tct-10.1177_15330338231223080 - Supplemental material for The Potential Transcriptomic and Metabolomic Mechanisms of ATO and ATRA in Treatment of FLT3-ITD Acute Myeloid Leukemia
Supplemental material, sj-docx-1-tct-10.1177_15330338231223080 for The Potential Transcriptomic and Metabolomic Mechanisms of ATO and ATRA in Treatment of FLT3-ITD Acute Myeloid Leukemia by Chun-Jin Peng, MD, Zhong Fan, MD, Jie-Si Luo, MD, Li-Na Wang, MD, Yu Li, MD, Cong Liang, MD, Xiao-Li Zhang, MD, Xue-Qun Luo, MD, Li-Bin Huang, MD, and Yan-Lai Tang, MD in Technology in Cancer Research & Treatment
Footnotes
Declaration of Conflicting Interests
The authors declared no potential conflicts of interest with respect to the research, authorship, and/or publication of this article.
Ethical Statement
Our study did not require an ethical board approval because it did not contain human or animal trials.
Funding
The authors disclosed receipt of the following financial support for the research, authorship, and/or publication of this article: This work was supported by the Science and Technology Planning Project of Guangdong Province, China, the Basic and Applied Basic Research Project of Guangdong Province, China, the Youth Talent Promotion Project of Guangzhou Association for Science and Technology, China, the Grant Award from the Terry Fox Foundation, Canada, the Shenzhen Fundamental Research Program, the Youth Talent Promotion Project of Guangzhou Association for Science and Technology, China, the Science and Technology Planning Project of Guangzhou, China, (grant number No.2021A0505060004, No. 2021A1515111169, No. 2023A1515030060, No. SKXRC202316, No. JCYJ20190809142619278, No.X20210201015, No. 202102020156).
Data Availability
The datasets generated during the study are available from the corresponding author.
Supplemental Material
Supplemental material for this article is available online.
References
Supplementary Material
Please find the following supplemental material available below.
For Open Access articles published under a Creative Commons License, all supplemental material carries the same license as the article it is associated with.
For non-Open Access articles published, all supplemental material carries a non-exclusive license, and permission requests for re-use of supplemental material or any part of supplemental material shall be sent directly to the copyright owner as specified in the copyright notice associated with the article.