
Abstract
Introduction
In recent times, liver cancer has emerged as a significant health threat, contributing to a substantial number of annual fatalities. 1 In clinical practice, 3 primary diagnostic modalities for liver cancer detection are routinely employed: computed tomography (CT) images, ultrasonography (ultrasound) images, and magnetic resonance imaging (MRI). The delineation of liver tumor regions typically falls under the purview of manual segmentation by radiologists. However, in contrast to liver segmentation, the task of liver tumor segmentation (LiTS) is widely recognized as more formidable. There are 2 primary reasons for this increased difficulty. Firstly, liver tumors often exhibit irregular shapes and indistinct boundaries, making precise delineation challenging. Secondly, liver tumors can manifest in random spatial locations within the liver, further complicating the segmentation task. Consequently, manual segmentation not only consumes significant time but also heavily relies on the expertise of the radiologist for achieving segmentation accuracy. As a result, the automation of LiTS assumes paramount importance in the realm of clinical practice.
The indistinct contours of certain tumors pose significant challenges in achieving accurate detection and segmentation. To address these difficulties, a plethora of deep learning-based methodologies have emerged in the field of medical image segmentation. Over the past years, U-Net, 2 for instance, is a well-regarded network architecture within medical image segmentation, characterized by its encoder–decoder structure. To enhance segmentation performance, U-Net incorporates skip connections, enabling the utilization of multiscale information features. U-Net++ 3 built upon the U-Net framework by enhancing skip connections to amalgamate information from various spatial scales. Besides, with the development of based of ultrasound transducer 4 , deep learning is also employed to handle ultrasound localization microscopy 5 . Deep learning has been widely used in the field of medical images, such as COVID-19 6 , etc7–9. These approaches leverage dilated convolutions with pooling operations10–13 to capture rich semantic features at different levels. However, they often fall short in describing the spatial and channel relationships between image pixels, a critical aspect of medical image segmentation. Moreover, CNNs are primarily proficient at extracting local information, often struggling with capturing global context. Enter MA-Net 14 and RA-UNet, 15 which introduce an attention mechanism 16 to capture spatial and channel-level attention feature maps. While the attention mechanism yields promising results, it does come at the cost of increased computational demands, necessitating substantial computing resources.
To address the above challenges, we introduce an innovative network architecture designed for LiTS, known as the attention connect network (AC-Net), as illustrated in Figure 1. AC-Net incorporates a self-attention mechanism, specifically employing 2 modules grounded in self-attention principles to capture feature maps dependent on spatial and channel relationships. These modules consist of the axial attention module (AAM) and the vision transformer module (VTM). The AAM merges features extracted from both the encoder and decoder by computing axial attention,
17
while the VTM leverages the vision transformer (ViT)
18
to amalgamate high-level semantic features derived from the encoder–decoder. Within this algorithm, spatial features are effectively integrated through skip connections operating at varying spatial scales. Thanks to the integration of these modules, our proposed network structure excels in handling local multimodal data. The primary contributions of this paper can be summarized as follows:
We introduce a novel network architecture, AC-Net, equipped with an attention mechanism tailored for LiTS. We employ a pretraining and fine-tuning approach to adapt the network to the multimodal liver data from Hubei Cancer Hospital, encompassing both CT and MRI modalities.

The overview of attention connect network (AC-Net).
Related Works
CNN and Attention Mechanism
In recent years, there has been an emergence of methods rooted in CNNs aimed at addressing a wide array of tasks. To make the best of the potential of feature maps, Attention U-Net 19 has introduced the use of soft attention gates for fusing spatial information derived from low-level features. Additionally, to enhance segmentation accuracy while minimizing memory usage 20 has replaced the conventional skip connections of U-Net with alternative blocks. Moreover, Wu et al 21 have employed a combination of separable convolutional blocks and U-Net architectures, enabling the capture of context feature channel correlations and higher-level feature information.
Recently, attention models have gained widespread adoption in addressing various deep learning tasks, spanning domains such as natural language processing and image detection. The inspiration behind the attention mechanism stems from human attention patterns. When humans read or listen, they tend to focus on keywords or elements. The attention mechanism can be viewed as a means of learning distinct weights assigned to all pixels in an image or all words in a sentence. A comprehensive conceptualization of the attention mechanism was formulated by Vaswani et al, 22 while Xu et al 23 introduced several variations of attention mechanisms, encompassing hard attention, soft attention, global attention, and local attention.
Numerous research endeavors have converged on integrating CNNs and the attention mechanism to tackle medical image processing. For instance, TransUNet 24 embraces a hybrid architecture that combines CNN and transformer components, effectively utilizing detailed, high-resolution spatial information from CNN characteristics alongside the global context encoded by the attention mechanism. In a similar stem, Henry et al 25 introduced an innovative approach by incorporating an attention gate module within skip connections, enhancing the U-shaped encoder–decoder architecture. Meanwhile, TransBTS 26 represents yet another CNN–transformer network tailored for three-dimensional biomedical image segmentation. Diverging from these methodologies, our approach leverages the attention mechanism to seamlessly fuse feature maps at the same resolution within both the encoder and decoder components.
Transformers
The transformer architecture, initially introduced by Vaswani et al, 22 achieved remarkable success in the realm of natural language processing (NLP). Subsequently, various researchers have endeavored to adapt transformers for application in the field of computer vision (CV). Notably, Carion et al 27 pioneered the use of transformers for object detection, leveraging their ability to extract global context information, resulting in improved accuracy. A significant departure from the traditional U-Net architecture, the ViT employs the encoder using a transformer-based approach, also yielding enhanced performance. Meanwhile, the segmentation transformer 28 integrates the transformer as an encoder within the conventional encoder-decoder framework. Furthermore, data-efficient image transformers 29 combine the transformer with knowledge distillation techniques to create a more efficient model capable of improved predictions while employing significantly fewer parameters. Liu et al 30 introduced the Swin transformer, a novel approach that applies the transformer to various scales and incorporates a shifted window mechanism to limit the scope of attention calculations, thus reducing computational demands. Lastly, Valanarasu et al 31 extended the application of the transformer to the domain of medical image segmentation, particularly focusing on the axial attention mechanism proposed by Wang et al. 17
Training Strategy
In the realm of deep learning, the abundance of data holds paramount importance. Utilizing datasets with a wealth of examples can significantly enhance the robustness of neural networks. Initially, neural networks relied on direct training, as outlined by Ronneberger et al, 2 aiming to accumulate sufficient data. However, it became evident that not all types of data were readily available in ample quantities. Subsequently, the training landscape evolved with the emergence of pretraining and fine-tuning methods, Yanai and Yoshiyuki 32 offering the promise of improved network performance. Few studies continue to employ direct training, primarily due to data scarcity, as direct training with insufficient data tends to exacerbate the risk of overfitting. More recently, Contrastive learning has gained rapid prominence as a training strategy that operates without supervision, eliminating the need for labels. Wu et al 33 pioneered the application of contrastive learning, sparking a surge of related research efforts, including works such as Ye et al, 34 Oord et al, 35 and Tian et al. 36
Materials and Method
Datasets and Preprocessing
We initially trained the AC-Net using the LiTS challenge dataset. 37 This dataset comprises 131 training and 70 test CT scan images, providing ground truth annotations for liver and tumor contours. Subsequently, we undertake fine-tuning using data sourced from Hubei Cancer Hospital, encompassing 2 modalities: CT and MRI. Specifically, the CT dataset comprises 473 CT images, while the MRI dataset comprises 256 images of the T1 modality. It's worth noting that the LiTS dataset is formatted in NII, while the local dataset is in DICOM format. To facilitate smoother training of the AC-Net, we uniformly convert all data formats to GZ and standardize the data size to 512 × 512 pixels.
Attention Connect Network
The schematic overview of our proposed AC-Net for LiTS is visually represented in Figure 1. Initially, CNN is employed for the customary task of feature extraction. Subsequently, feature maps are amalgamated through different modules operating at varying scales. AC-Net incorporates 2 crucial modules: the AAM and the VTM. AAM leverages an axial attention mechanism to merge features of matching dimensions, thereby maximizing the utilization of spatial features extracted by CNN. On the other hand, VTM processes feature maps with the lowest resolution, employing a methodology akin to ViT. Within this network architecture, predicated on the U-Net framework, feature fusion takes place at 2 distinct sizes, 128 × 128 and 32 × 32, facilitated by attention connections. This affords the capability to fuse features across a more extensive receptive field. Additionally, the feature maps undergo up-sampling when subjected to feature fusion. The incorporation of the axial attention mechanism serves to curtail computational demands, preventing the excessive utilization of computational resources. Further elaboration on the AAM and VTM modules will be provided subsequently.
Axial Attention Module
Self-attention
22
is the basis of axial attention. Given an input

Building upon the foundation of self-attention, the concept of axial attention was introduced by Wang et al
17
as a solution to address the previously outlined challenges. More specifically, an axial-attention layer was initially defined along the width axis of an input, resembling a straightforward one-dimensional position-sensitive self-attention mechanism. A similar definition was then applied to the height axis. In essence, axial attention can be succinctly described as follows:

After axial attention, Yanai and Yoshiyuki
32
proposed a modified block to control the position encoding. It can be written as


The structure of axial attention module (AAM). BlockE denotes encoder block and BlockD denotes decoder block.
Vision Transformer Module
Since the inception of the attention mechanism, its application has proliferated notably in the realm of NLP. In the context of image processing, Dosovitskiy et al
18
introduced a novel approach of segmenting an image into discrete patches, organizing them in a specific sequence, treating these sequenced patches as a sentence, and subsequently processing them using techniques akin to those employed in the NLP domain. This approach can be succinctly articulated as follows:


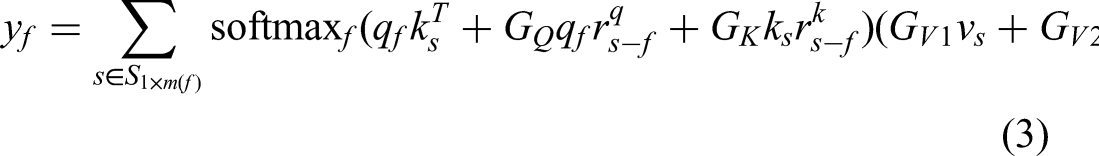
Differing from prior approaches, we employ ViT at the lowest resolution level within the network architecture to amalgamate the high-level semantic features of two-dimensional liver tumors, as extracted by the CNN. This can be formally expressed as follows:


Here, FCN stands for the fully connected network, and “R” signifies the operation of reshaping the output into a feature map. It's worth noting that, unlike, Dosovitskiy et al, 18 our patch embedding does not include an output class. To ensure compatibility for feature fusion with those extracted by the CNN, the shape of the VTM's output should match the feature map in the decoder. Therefore, we perform a reshaping operation on the output after the VTM computation. The structure of the VTM is shown in Figure 3.
Loss Function
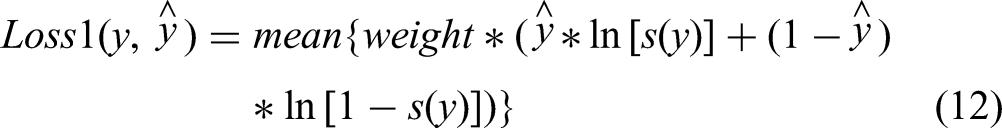
To optimize the AC-Net, we employ a specialized loss function comprised of several components. The first function is binary cross-entropy with logits. It applies sigmoid activation to the output of the neural network and computes the cross-entropy. This function is formally defined as follows:

The structure of the vision transformer module (VTM).
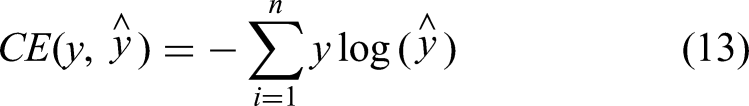
The second function is based on the cross-entropy loss function
38
which is defined as


Experiments and Results
Evaluation Metrics
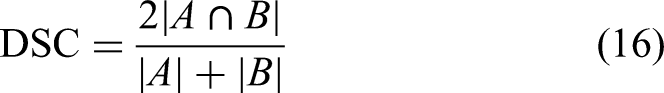
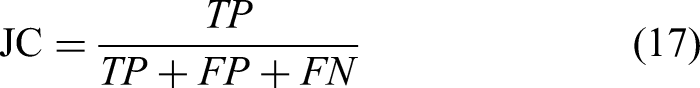
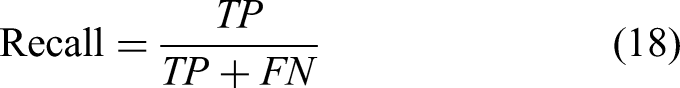
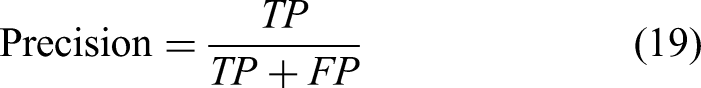
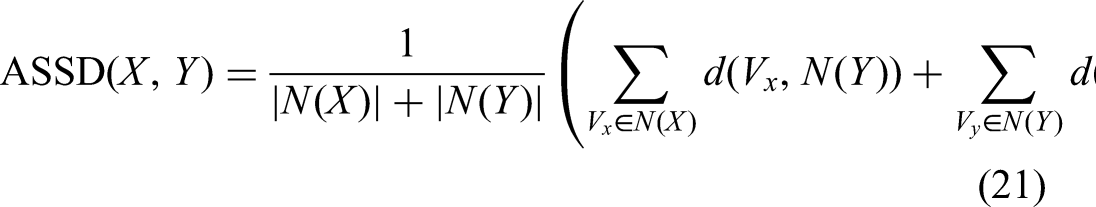
To evaluate the performance of our AC-Net, we use the following metrics, including the dice similarity coefficient (DSC), Jaccard coefficient (JC), recall, average symmetric surface distance (ASSD), Hausdorff distance (HD), and precision.
The DSC score function is defined as
The JC score function is defined as:
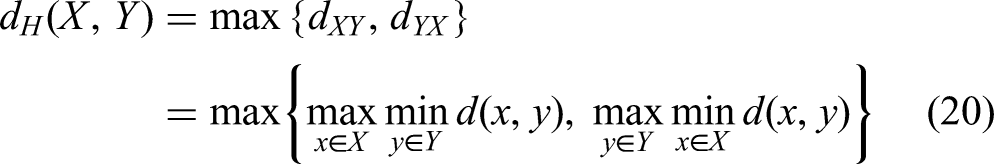
The HD represents the maximum distance between the predicted segmentation region boundary and the real tumor region boundary, and the smaller the value, the smaller the segmentation error and the better the quality of liver tumor boundary segmentation. This function is defined as
ASSD measures the distance between the surfaces of the prediction and the ground truth. It is defined as
Pretraining and Fine-Tuning
Our experimental setup was executed on a Huawei cloud server equipped with an 8-core CPU and 64 GB of memory, complemented by an NVIDIA P100 GPU. The computations were conducted using PyTorch 1.10 on an Ubuntu 18.04 operating system.
Research indicates that transformers necessitate a considerably larger volume of data compared to CNNs. Unfortunately, acquiring sufficient clinical data from hospitals poses a substantial challenge, impeding the training of transformers. To address the issue of data scarcity, we have devised a strategy involving pretraining and fine-tuning. In this approach, we initially train the network using open-source datasets and save the parameters. Subsequently, we employ local data to fine-tune the network with a limited number of epochs after loading these saved parameters.
Our experiments have demonstrated that this training strategy yields favorable outcomes while demanding fewer computational resources. This efficacy stems from the fact that neural networks can rapidly acquire crucial target features from open-source datasets, a more efficient approach compared to training an entirely new network from scratch.
To begin, we initiated the pretraining process utilizing the LiTS dataset. This dataset was partitioned into 3 subsets, namely, a training set, a validation set, and a test set, with a distribution ratio of 7:2:1. During this phase, the batch size, number of epochs, learning rate, and momentum for Adagrad were configured at 4, 60, 0.01, and 0.9, respectively. Subsequently, fine-tuning was conducted using the local dataset. Similar to the previous phase, the local dataset was segmented into training, validation, and test sets, following a distribution ratio of 6:2:2. In this stage, the batch size and number of epochs were set to 4 and 40, respectively, while retaining the same learning rate and momentum as before.
Results
Following the training strategy elucidated earlier, we proceeded to fine-tune the neural network using local CT and MRI data. Our liver tumor segmentation results achieve a DSC of 0.90, JC of 0.82, recall of 0.92, precision of 0.89, HD of 11.96, ASSD of 4.59 on local CT data and a DSC of 0.80, JC of 0.70, recall of 0.82, precision of 0.84, HD of 30.26, ASSD of 7.58 on local MRI data.
To assess the performance of the proposed method, we conducted a comparative analysis with other methods in the same dataset and environment. This comparison includes the following approaches: (1) U-Net, based on a classical encoder–decoder architecture, exhibits normal performance in segmentation. However, due to its limited utilization of spatial information, the segmentation of tumor edges may appear fuzzy. (2) U-Net++, which utilizes skip links to integrate spatial information from different scales, offers an improvement in spatial information utilization but still falls short of full optimization. (3) SegNet, 39 employing a convolutional encoder-decoder architecture that relies on feature mapping instead of upsampling, follows a similar decoder approach. (4) PSPNet, 13 which first uses CNN to extract feature maps and then employs a pyramid pooling module for result prediction. This method convolves feature maps at multiple resolutions and concatenates them, albeit without computing individual information within each feature map. (5) MedT 31 improves the axial attention mechanism, adds a gating unit, limits the training range of parameters, and extracts features from the feature map in blocks, achieving good results in medical images.
Figure 4 visually presents a comparison among various methods applied to local CT data. It's evident that, regardless of tumor size, the results achieved by AC-Net appear more intuitively accurate. Table 1 provides a detailed comparison of evaluation metrics for each method on local CT data, further underscoring the superior performance of AC-Net. Figure 5 illustrates the outcomes of each network on local MRI data, while Table 2 furnishes specific evaluation metrics for each network on local MRI data. These results also affirm the commendable performance of AC-Net on MRI data. In AC-Net, axial attention is applied to a feature map with a resolution of 128 × 128, marking the initial utilization of spatial information. Subsequently, an attention calculation is carried out on a feature map with a resolution of 32 × 32, constituting the second instance of leveraging spatial information. This distinctive approach empowers AC-Net to excel in the segmentation of cancer edges when compared to other models.

The comparison between AC-Net and other methods. (a) Image. (b) to (f) The segmentation results of U-Net, U-Net++, SegNet, PSPNet, and MedT, and (g) and (h) the results of AC-Net and ground truth.

The comparison between AC-Net and other methods. (a) Image. (b) to (f) The segmentation results of UNet, UNet++, SegNet, PSPNet, and MedT, and (g) and (h) the results of AC-Net and ground truth.
The Evaluation Metrics of Every Method on CT Data.

Abbreviations: DSC, dice similarity coefficient; JC, Jaccard coefficient; ASSD, average symmetric surface distance; HD, Hausdorff distance; PSPNet, pyramid scene parsing network; CT, computed tomography.
The Evaluation Metrics of Every Method on MRI Data.

Abbreviations: DSC, dice similarity coefficient; JC, Jaccard coefficient; ASSD, average symmetric surface distance; HD, Hausdorff distance; PSPNet, pyramid scene parsing network; MRI, magnetic resonance imaging.
Tables 1 and 2 show the comparison between AC-Net and other methods on the local CT data and MRI data. The disparities in lesion contrasts between CT and MRI data result in varying levels of accuracy between the 2 modalities. Within the encoder, AC-Net employs axial attention calculations and attention calculations separately for feature maps with resolutions of 128 × 128 and 32 × 32, effectively leveraging spatial information to achieve higher accuracy compared to other models. The segmentation result of AC-Net on local CT data is slightly better than other networks. However, the result of AC-Net on local MRI data is better than other networks.
Ablation
To further verify the importance of each module, 4 experiments with different settings were performed, as described in Table 3. The entire ablation experiment is divided into 5 groups: The first group involves the removal of AAM. The second group involves the removal of VTM. The third group utilizes a different loss function (BCELogits loss). The fourth group employs a different number of attention heads (utilizing 16 attention heads in VTM, noting that the standard number of attention heads is 8). The fifth group represents the standard AC-Net configuration. The results and evaluation metrics are shown as follows, Figure 6 and Table 4 show the results of local CT data and Figure 7 and Table 5 show the results of local MRI data.

The results of the ablation experiments. (a) Image. (b) to (e) The segmentation results of setting1, setting2, setting3, and setting4, and (g) ground truth.

The results of the ablation experiments. (a) Image. (b) to (e) The segmentation results of setting1, setting2, setting3, and setting4, and (g) ground truth.
The Ablation Experiments.

Abbreviations: VTM, vision transformer module; AAM, axial attention module.
The Evaluation Metrics of Ablation Experiments on CT Data.

Abbreviations: DSC, dice similarity coefficient; JC, Jaccard coefficient; ASSD, average symmetric surface distance; HD, Hausdorff distance; PSPNet, pyramid scene parsing network; CT, computed tomography; VTM, vision transformer module; AAM, axial attention module.
The Evaluation Metrics of Ablation Experiments on MRI Data.

Abbreviations: DSC, dice similarity coefficient; JC, Jaccard coefficient; ASSD, average symmetric surface distance; HD, Hausdorff distance; PSPNet, pyramid scene parsing network; MRI, magnetic resonance imaging; VTM, vision transformer module; AAM, axial attention module.
Through the above ablation experiments, it can be observed that AAM, VTM, and supervision could improve the accuracy of LiTS.
Discussion
In this research endeavor, we have introduced a pioneering attention model, AC-Net, designed for the prediction of tumors in both CT and MRI scans, with the aim of providing invaluable assistance to clinicians in their clinical practice. In contrast to the conventional CNN–transformer architecture, AC-Net adopts the transformer as a feature fusion module rather than an encoder, incorporating the axial attention mechanism and ViT. Our approach encompasses 2 crucial components: Firstly, feature maps are fused by computing axial attention across extended distances. This strategic integration leverages global information comprehensively, thereby enhancing the precision of LiTS. Simultaneously, the application of the axial attention mechanism contributes to a reduction in computational demands, allowing for efficient resource utilization. Secondly, the VTM is employed to process high-level semantic features extracted by the CNN. Attention calculations are performed in accordance with the principles of ViT, and the associated weights are preserved. These high-level semantic features contain global information, and the attention computation effectively harnesses this global information, mitigating issues arising from the limited receptive field of CNNs. With the integration of these modules, our network attains commendable results, achieving a DSC of 0.90, JC of 0.82, recall of 0.92, precision of 0.89, HD of 11.96, and ASSD of 4.59 on local CT data. Similarly, on local MRI data, our network delivers a DSC of 0.80, JC of 0.70, recall of 0.82, precision of 0.84, HD of 30.26, and ASSD of 7.58.
In comparison to other models for medical image segmentation, our network, AC-Net, exhibits commendable performance in the segmentation of liver tumors when applied to local datasets. Ablation experiments further underscore the effectiveness of our approach, highlighting the significant enhancement in LiTS achieved through the incorporation of the axial attention mechanism, vision transformer as feature fusion modules, and an optimized training strategy.
Our AC-Net has enhanced feature extraction and learning capabilities, it can achieve a high score in LiTS while using less computational resources compared to other networks with attention mechanisms. Our experiments exclusively utilized MRI and CT images, without exploring other modalities such as CBCT, ultrasound, or photoacoustic imaging. This implies that the universality of the AC-Net algorithm has not been sufficiently verified. The datasets we used were comprised of clinically standard data, without considering artifacts, noise, respiratory motion, and other sources of interference in imaging. Thus, we cannot effectively demonstrate the robustness of the AC-Net algorithm. Our discussion primarily revolved around segmentation accuracy and did not take into account factors like radiation dosage, postoperative cancer metastasis, patient adaptability, and other clinical considerations. Consequently, the algorithm's potential for clinical intervention in radiotherapy remains unexplored. On the other hand, the functionality of AC-Net is limited in scope. It is designed solely for the detection of malignant liver tumors and is not equipped to identify liver abscesses or liver hemangiomas. In our future work, we aspire to develop more advanced algorithms to further advance the field of AI-driven radiotherapy.
Conclusion
In this article, we introduced AC-Net as a novel approach for the automated segmentation of liver tumors within CT and MRI images. Diverging from established LiTS networks, our methodology involves the utilization of CNN for spatial feature extraction, followed by the incorporation of AAM and VTM to fuse these spatial features across varying scales. Empirical investigations conducted on local datasets substantiate that this fusion of spatial features yields substantial enhancements in tumor detection capabilities.
Footnotes
Acknowledgments
Thanks for the clinical data provided by Hubei Cancer Hospital.
Author Contributions
JS and SL examined the experiment and wrote this article. YD provided help with the data analysis. XX revised this article. WW and BZ provided the research platform.
Declaration of Conflicting Interests
The author(s) declared no potential conflicts of interest with respect to the research, authorship, and/or publication of this article. The authors declare that the research was conducted in the absence of any commercial or financial relationships that could be construed as a potential conflict of interest.
Ethics Approval
Our study was approved by the Institutional Reviewer Board of Hubei Cancer Hospital (No. LLHBCH2023YN-057).
Funding
The author(s) disclosed receipt of the following financial support for the research, authorship, and/or publication of this article: This work was supported by the Health Commission of Hubei Province scientific research project, National Natural Science Foundation of China, the Shenzhen Basic Science Research, the Natural Science Foundation of Hubei Province (grant number WJ2021M192, 12075095, U22A20259, JCYJ20200109110006136, 2022CFB938).