
Abstract
Radiotherapy plays an important role in the treatment of non-small cell lung cancer. Accurate segmentation of the gross target volume is very important for successful radiotherapy delivery. Deep learning techniques can obtain fast and accurate segmentation, which is independent of experts’ experience and saves time compared with manual delineation. In this paper, we introduce a modified version of ResNet and apply it to segment the gross target volume in computed tomography images of patients with non-small cell lung cancer. Normalization was applied to reduce the differences among images and data augmentation techniques were employed to further enrich the data of the training set. Two different residual convolutional blocks were used to efficiently extract the deep features of the computed tomography images, and the features from all levels of the ResNet were merged into a single output. This simple design achieved a fusion of deep semantic features and shallow appearance features to generate dense pixel outputs. The test loss tended to be stable after 50 training epochs, and the segmentation took 21 ms per computed tomography image. The average evaluation metrics were: Dice similarity coefficient, 0.73; Jaccard similarity coefficient, 0.68; true positive rate, 0.71; and false positive rate, 0.0012. Those results were better than those of U-Net, which was used as a benchmark. The modified ResNet directly extracted multi-scale context features from original input images. Thus, the proposed automatic segmentation method can quickly segment the gross target volume in non-small cell lung cancer cases and be applied to improve consistency in contouring.
Keywords
Introduction
Lung cancer is a major cause of cancer-related death among both men and women, accounting for 1.6 million deaths annually worldwide. 1,2 According to the 2017 China Urban Cancer Data Report, lung cancers are the most prevalent malignancies in terms of morbidity and mortality in urban areas, and non-small cell lung cancer (NSCLC) accounts for about 75% to 80% of all lung cancer cases. Patients with lung cancer require comprehensive treatment, and radiotherapy can be used in all stages. At least one session of radiotherapy is performed on over half of patients for either curative or palliative purposes. 3 Radiotherapy of NSCLC requires accurate location about the tumor. Precise, patient-specific radiotherapy plans are usually designed based on computed tomography (CT) images to deliver high irradiated doses to the target volume while sparing organs at risk (OARs) as much as possible. 4
Accurate segmentation of the target volume is very important for successful radiotherapy delivery. Traditionally, such segmentation has been performed by manual delineation on planning CT images, with the help of magnetic resonance imaging (MRI) or positron emission tomography (PET) images when necessary. However, manual delineation is labor-intensive, time-consuming, and subjective, and it has considerable inter- and intra-observer variability. 5,6 Thus, accurate automatic segmentation methods are highly desired and useful for pre-treatment radiotherapy planning.
In recent years, deep learning methods have gained popularity and shown outstanding capabilities in autosegmentation of tumors of regions such as the head and neck, breast, and rectum. 7 -18 Some studies have also reported deep learning-based automatic segmentation of lung tumors. 19 -24 Bi Nan et al. focused on autosegmentation of the clinical target volume (CTV) of lung cancer using a network based on ResNet-101. 19 Four recent studies addressed the application of deep learning-based autosegmentation in primary lung tumors on the basis of MR or PET/CT images. 20 -23 Jiang J et al. developed two multiple resolution residually connected networks (MRRN) for lung cancer but only evaluated the accuracy of the proposed models without clinical implications such as time gain. 24 Thus, few studies have explored the role of deep learning in autosegmentation of the gross target volume (GTV) of NSCLC on CT images as well as the efficiency of autosegmentation in end-to-end clinical application.
In this paper, we used a modified version of ResNet to segment the GTV in patients with medically/technically inoperable NSCLC. We adopted an encoder-decoder structure similar to U-Net, which is becoming more widely used in semantic segmentation tasks. 25 Compared with fully convolutional networks, which rely heavily on the use of atrous convolution to generate high-quality segmentation results, it has shown outstanding performance in terms of memory and computing power and no limitations on the type of backbone network that can be used. 26,27 As the encoder, ResNet34 was used to fully extract deeper image features and prevent the disappearance of the gradient during the training process. 28 The decoder employs feature fusion and upsampling that are inspired by feature pyramid, but more lightweight. 29,30 The features from all levels of the ResNet34 architecture were merged into a single output to achieve deep fusion of deep semantic features with shallow appearance ones, which increased the accuracy of the segmentation results. Then, the performance of the modified ResNet was compared with that of U-Net, which is commonly used in medical image processing. 12,14,20 Finally, the efficiency of the autosegmentation in clinical work was evaluated by comparison with manual delineation in terms of contouring time.
Materials and Methods
Dataset
Patients with different NSCLC staging, tumor size, and location were included. All patients were aged 40–89 years. For patients with lymph node involvement, only the primary tumor mass was assessed in this study. The full CT image dataset was divided into two parts: the training and test sets. The training set consisted of 300 patients, whose tumor sizes (but not tumor positions) had a roughly even distribution. To ensure that the test set would facilitate objective evaluation of the automatic segmentation model, the test set included 30 patients with an even spread of tumor sizes and tumor positions. The general characteristics of the patients in the training and test sets are shown in Table 1. All patients received regular 3D CT scans.
Characteristics of Patients in Training and Test Sets.
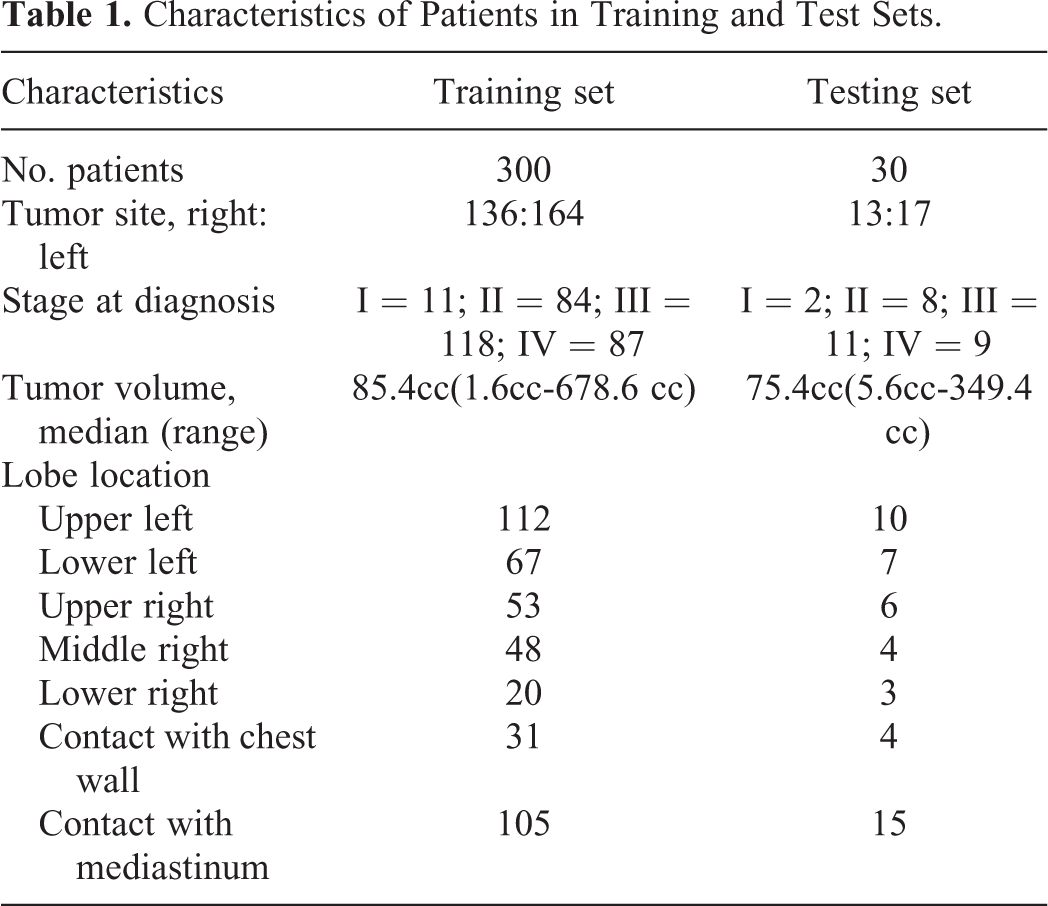
The CT images were acquired on a Philips Brilliance Big Bore simulator (Philips Medical Systems, Madison, WI) from the level of the larynx to the bottom of the lungs with 5-mm slice thickness on helical scan mode. There were 57–121 slices per patient. The study was approved by the ethics committee of the Seventh Medical Center of people’s liberation army(PLA) General Hospital. All patients provided written consent for storage of their medical information in the hospital database. The GTVs of all cases (including training and test cases) were delineated by an experienced senior radiation oncologist who specializes in the thoracic region (Xu WD) and were then peer-reviewed by two other experts (Wang YD and Gao JM). These manual delineations were used to generate the ground truth in this study. Then, the CTV was defined as the GTV plus additional margins of 6 mm and 8 mm for squamous cell carcinoma and adenocarcinoma, respectively. Further additional margins were added to form the final planning target volume.
Data Preprocessing and Augmentation
The CT image values of different tissues and organs were converted into gray values and stored in Digital Imaging and Communications in Medicine format. To highlight the information about the tumor and the surrounding tissues in the CT images, it was necessary to convert the 4096-level grayscale images into 255-level ones.
The performance of convolutional neural networks (CNNs) relies heavily on the size of the training dataset used. In our study, data augmentation techniques were employed to further enrich the data of the training set. The size, shape, and location of tumors vary from patient to patient in CT images of NSCLC, but the pixel intensity of tumors after CT scanning remains relatively fixed. Therefore, the data augmentation techniques applied in GTV autosegmentation did not change the pixel intensity values in the original CT images. Applying flip, translation, scaling, and cropping operations to a CT image only made minor adjustments to the position, shape, and size of the tumor without changing the pixel intensity, which was equivalent to creating a new CT image. Thus, augmentation helped the network to learn invariance and reduced overfitting during network training. In addition, the data augmentation was performed randomly: the image data and their augmentations were both randomly chosen. During each epoch, 2/3 of the training set was randomly selected for augmentation. To create each augmented image, 4 augmentation techniques were randomly combined. Therefore, each epoch’s training images consisted of two groups: one comprised 4032 augmented images, which accounted for 2/3 of the training set, and the other comprised 2016 original images, which accounted for 1/3 of the training set. These two groups comprised the entire training set. The same transformations were also applied to the test set. Figure 1 shows an example of a CT image and its ground truth labeling before and after data augmentations.

CT images and corresponding labels before and after data augmentation. A. Original CT image. B. Original ground truth. C. Augmented CT image. D. Augmented ground truth.
Proposed Deep Learning Model
Convolutional layers, pooling layers, and the activation function are the basic components of a CNN. 31 Convolutional layers convolve an image using convolutional kernels to obtain feature maps in which each element is connected to the previous layer by the corresponding weights of the convolutional kernels. 13 Pooling layers fuse the spatial features of adjacent pixels into feature maps, making the images’ feature representations more compact. 25 The activation function is responsible for increasing the network’s nonlinear expression.
The configuration of the modified ResNet is shown in Figure 2. An encoder-decoder was used to increase feature resolution. The encoding path used a ResNet34 backbone to fully extract the deep features of the CT images while avoiding any performance degradation caused by deepening the network. A lightweight dense-prediction branch was applied in the decoding path. A simple design that merges the features from all levels of the ResNet34 into a single output was proposed: deep semantic features at multiple spatial resolutions were concatenated in the channel dimension and then were merged with shallow appearance features to generate dense pixel outputs.

Proposed network structure.
The ResNet34-based encoder was divided into five stages, each of which generated feature map output at different scales. The ResNet34 architecture employed cross-layer connection via identity mapping, which could learn new features in addition to receive input features, effectively solving the network degradation problem because of the deep layered network structure. The structure of the residual learning block contained an identity residual block and a convolutional residual block, as shown in Figure 3.

Structure of the residual learning block. A. identity residual block. B. convolutional residual block.
In the identity residual block, the input X was passed directly to the output as the initial result. The network’s learning goal was changed from the desired output H(X) to the difference between the desired output and the input, which was called the residual
The decoding network’s feature fusion and upsampling were inspired by the feature pyramid network, but the present network’s advantage is the fusion of deep semantic features with shallow appearance ones. We proposed a simple architecture that merges the features from all levels of the ResNet34 into a single output. The feature maps of stages 3, 4, and 5 were upsampled by bilinear upsampling and convolution until they reached 1/4 of the input image’s scale. These deep semantic features (which included different levels of global information) were concatenated in the channel dimension to form “thicker” features. 32 The feature maps were passed through a stack of convolutional layers to fuse different features and reduce the channel dimension until the number of channels was the same as the number of feature maps in stage 2. Then, the feature values were summed to increase the expression in a single channel. Finally, the feature maps were upsampled by bilinear upsampling and convolution again until they reached the scale of the input image, and then pixel-level classification was performed.
Model Training
The proposed models were implemented in the Python development environment on Windows operating system using a custom version of the Keras framework based on Tensorflow. All training and test experiments were run on an NVIDIA GeForce GTX 1080 Ti GPU with 11 GB memory. The dimensions of the training data and the minibatch size played a significant role in the computational burden of the proposed autosegmentation method. A minibatch of size 8 was used because of the GPU’s limited memory.
All input images were single-channel grayscale ones of size
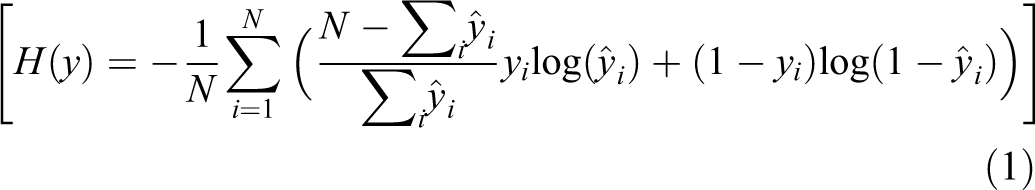
where yi
belongs to the probability distribution of real samples, and
The network training duration was set as 50 epochs. Adaptive Adam optimization was applied because of the sparseness of single images’ data. Adam performs better than other types of optimization, such as stochastic gradient descent, with a sparse gradient. 34,35 The loss drops quickly when the Adam optimizer is used, so the learning rate is relatively small (set as 0.0001). Each parameter’s learning rate was dynamically adjusted by the first and second moment estimations of the gradient. The exponential decay rates of the first and second moment estimations in the Adam optimization algorithm were set as 0.9 and 0.999, respectively. To prevent overfitting, a dropout layer and L2 regularization were employed in our study. Additionally, it was important to use batch normalization, which helps the inputs of each layer of the neural network maintain the same distribution, making training easier.
Evaluation Metric
The proposed model’s performance was verified by comparison with the expert segmentation results, which were regarded as the ground truth. We evaluated the similarity between the autosegmentation results and ground truth by the Dice similarity coefficient (DSC), Jaccard similarity coefficient (JSC), true positive rate (TPR), and false positive rate (FPR).
Statistical Analysis
Student’s t-test was performed to compare the autosegmentation results of the two models by using SPSS 20 software (version 20.0, SPSS Inc, Chicago, USA). Quantitative data were expressed in the form of mean±standard deviation (
Results
Delineation Results by the Modified ResNet
Training of the modified ResNet took approximately 12 hours. In the encoder, the size of the feature maps shrank, but the contained semantic information increased, at deeper network layers. In the decoder, the size of the feature maps expanded with increased numbers of upsampling operations. After 50 epochs of training, the cross-entropy loss of the training and test datasets were stable at 0.0009 and 0.0080, respectively.
During dense-pixel prediction, if a pixel value from the sigmoid function was greater than 0.5, the pixel was considered as part of the target. Otherwise, the pixel was considered as part of the background. The autosegmentation method based on the modified ResNet was applied to the test dataset, and the DSC, JSC, TPR, and FPR values were calculated. The proposed method achieved comparable results to the manual segmentation, especially for larger tumors. Figure 4 shows typical autosegmentation results of test set images along with their corresponding reference results.
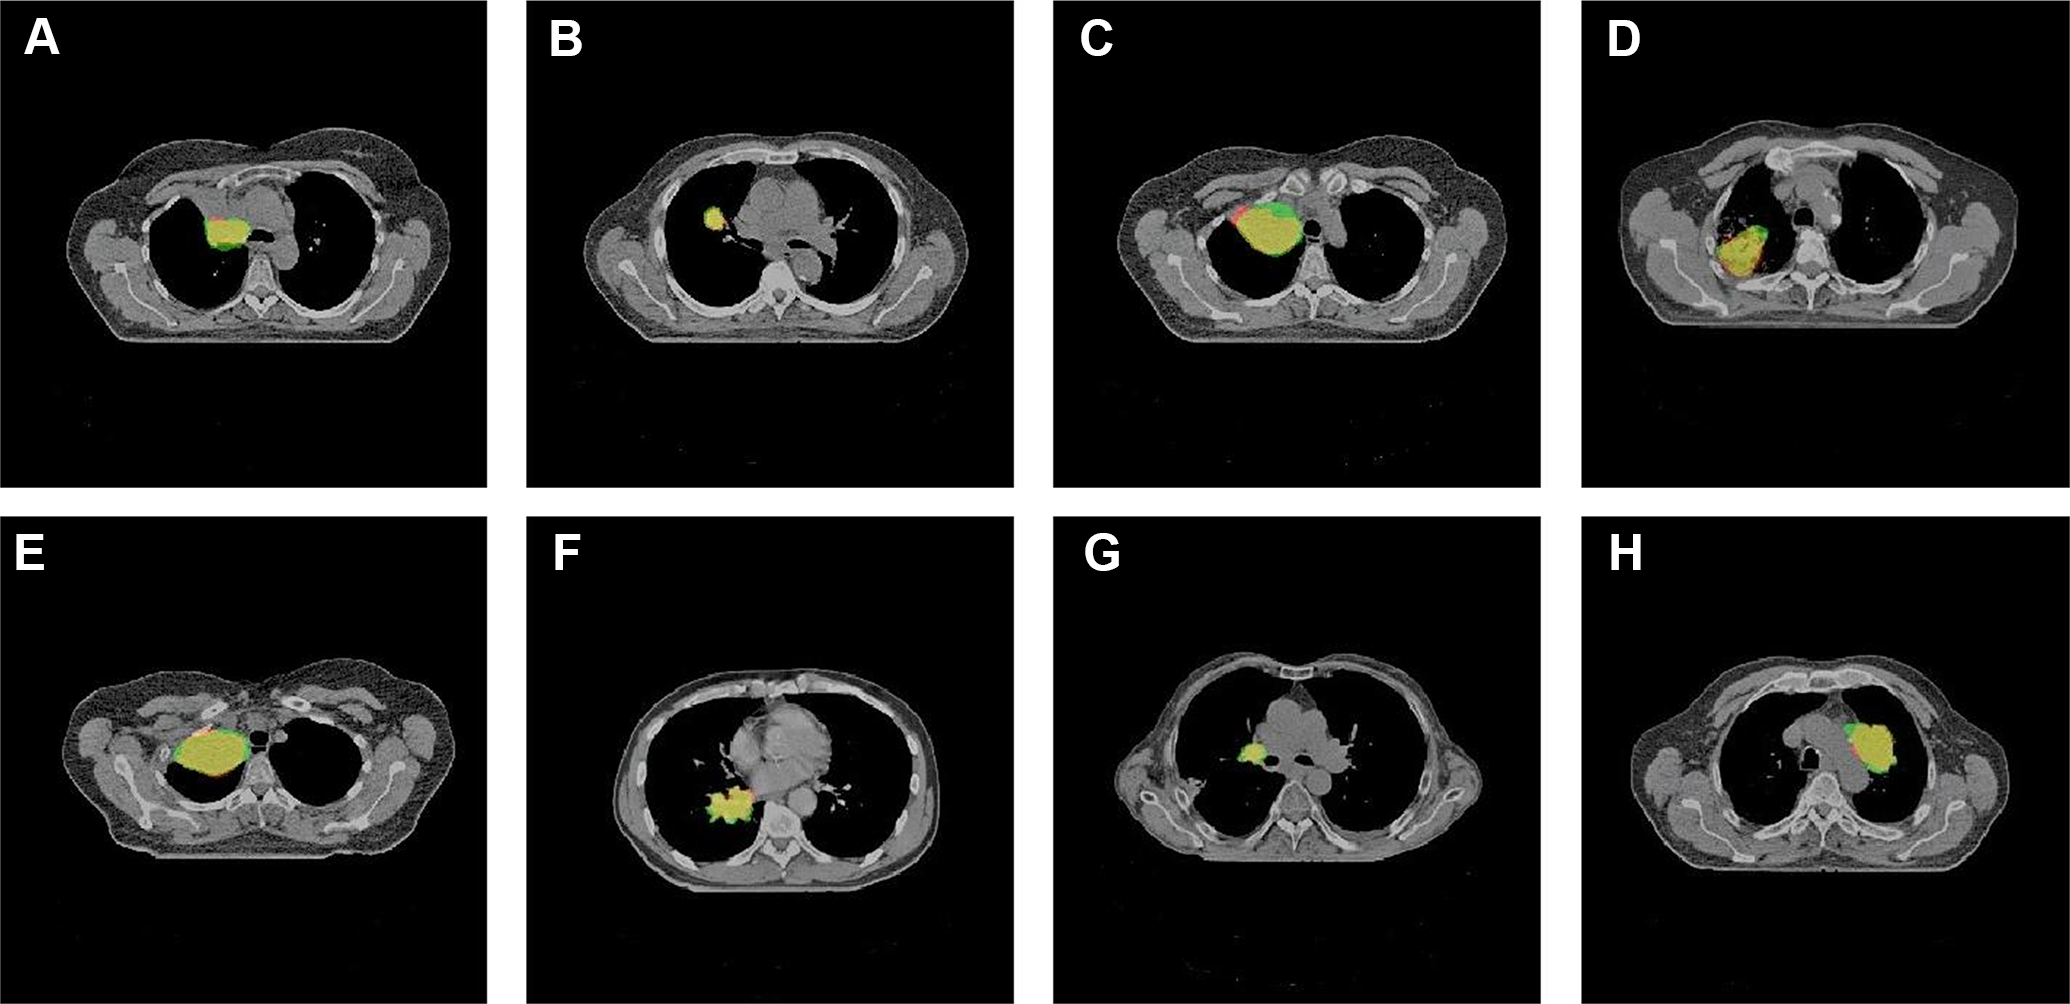
Segmentation results of GTV. The green part indicates the ground truth. The red part indicates the autosegmentation results. The yellow part indicates the intersection between the two.
Figure 4 shows that there was a large overlap between the autosegmentation results and the ground truth. The average DSC value of the entire test set was 0.73, and the DSC of the best single test image reached 0.96.
Comparison of the Modified ResNet and U-Net
For further comparison, we also segmented the GTV of NSCLC using U-Net, which is commonly applied as a benchmark in medical image segmentation. The U-Net was trained from scratch on this dataset, and the hyperparameters were consistent with those used by the modified ResNet. The settings were as follows: single-channel grayscale images of size
Quantitative Evaluation Metrics of the Modified ResNet and U-Net (


Segmentation results of the GTV by the proposed network (bottom figures) and U-Net (top figures). The green part indicates the ground truth. The red part indicates the autosegmentation results. The yellow part indicates the intersection between the two.
Time Gain
The average time for autosegmentation of the GTV by the proposed model was about 21 ms per slice, but the results still required additional manual slice-by-slice modification before the final clinical implementation. The deep learning-assisted delineation took an average of about 10 min per patient, in contrast to manual delineation taking an average of about 15 min per patient. Thus, the proposed technique significantly improved the efficiency of segmentation in our routine clinical work.
Discussion
The contouring of target volumes is an important aspect of treatment planning in radiotherapy but is usually time-consuming, and the quality of the contours relies on the operator’s skill level. In recent years, deep learning-based automatic segmentation has become very popular.
Some studies have reported automatic segmentation of lung tumors using deep learning methods. Bi Nan et al. applied a 2D ResNet101 to achieve effective autosegmentation of the CTV in postoperative lung cancer. Deep learning-assisted contouring by 11 junior physicians achieved an average DSC of 0.75. 19 Wang C et al. developed a patient-specific adaptive CNN called A-net to simulate the workflow of adaptive radiotherapy and used past weekly MRI data and target volumes to segment lung tumors on the current weekly MRI. The patient-specific A-net can segment tumors with an average DSC of 0.82. Thus, it outperformed the population-based A-net, which had an average DSC of 0.64, as well as the population-based U-net, which had an average DSC of 0.59. 20 Zhong ZS used two coupled 3D U-Nets to realize autosegmentation of NSCLC tumors in PET-CT images, and the average DSCs on CT and PET were 0.86 and 0.83, respectively. Subsequent cosegmentation by the deep learning method using both PET and CT data outperformed the results using either PET or CT alone. 21 Zhao XM et al proposed a novel multi-modality segmentation method based on a 3D FCN for lung tumor autosegmentation on PET-CT images. The results demonstrated that the proposed network was effective, fast, and robust and achieved significant performance gain over CNN-based methods and traditional methods using PET or CT data only (average DSC: 0.85). 22 Jiang J, Hu YC, et al. proposed an adversarial domain adaptation-based deep learning method for automatic NSCLC tumor segmentation on T2-weighted MRI images. The proposed method used a U-Net trained with a limited number of original MRIs and some synthesized ones. The method produced a DSC of 0.74 when trained with only synthesized MRIs, and the best DSC (0.80) was achieved on the test set when the model was trained in a semi-supervised setting. 23 Jiang J, Hu YC, et al. developed two multiple resolution residually connected network (MRRN) formulations that simultaneously combine features across multiple image resolution and feature levels through residual connection to detect and segment lung tumors. The method achieved average DSCs of 0.74, 0.75, and 0.68 for 3 different datasets. 24
In this study, we proposed a modified ResNet model for autosegmentation of the GTV of NSCLC, which achieved rapid and fairly complete end-to-end tumor autosegmentation. We compared the proposed modified ResNet with U-Net. The proposed modified ResNet performed better than U-Net and improved the consistency of contouring, which could help to streamline radiotherapy workflows. Two possible reasons could be proffered for this: 1) The ResNet34 backbone network of the encoder introduced more nonlinear expressions and extracted deeper, more semantically advanced features. 2) The decoder’s simple design that merged the features from all levels of the ResNet34 into a single output to generate dense-pixel prediction was effective. Deep semantic features at multiple spatial resolutions were concatenated in the channel dimension and then summed with shallow appearance features to increase the expression in a single channel. Compared with U-Net, these two improvements ensure that the modified ResNet can directly extract multi-scale context features from the original input images. Thus, the modified ResNet performed better at this task than U-Net.
The developed approach appears promising, but some aspects of the study have limitations. Firstly, the training set did not contain many different cases because of the limited number of available image sets, whereas the GTV autosegmentation results were affected by variations in tumor position (e.g., some tumors were peripherally located, centrally located, or had broad chest wall contact), shape, size, and respiratory and cardiac motion, so correlations between size/shape/location and the evaluation metrics were not discussed. Secondly, distance metrics like Hausdorff distance or distance to agreement were not applied to measure the auto-contour’s degree of spatial conformity. Thirdly, inter-observer and intra-observer variability was not examined in this study. The lack of such performance assessment between the two methods used in this study results in a limited ability to evaluate geometric discrepancy.
In addition, if the tumors were small or attached to the mediastinum closely, accurate segmentation would have been difficult, as the 2D network implementation ignored the relationship between different CT slices of the same patient. Thus, employing a 2.5D or 3D network should be considered to improve segmentation of the GTV of NSCLC. A 3D network could obtain more accurate segmentation results on CT sequences by using information about the previous slice to guide the segmentation of the next slice. A 2.5D network may also provide 3D-like context. However, because of the problem of matching the amount of data and model parameters, a 3D model would need a larger training dataset to avoid overfitting. Additionally, attention mechanisms, which can control the importance of features at different spatial locations through a gating signal, are a potential solution. As the size of the training dataset increases, the difference between the weights of the attention map in the target and background areas should increase, which would improve the accuracy of autosegmentation.
To achieve better label balancing of the loss function, the network performs weighted learning of difficult samples adaptively. For example, the focal loss function proposed for the target detection task focuses on samples with incorrect classifications during the training process. 36 Combining sensitivity and specificity as the network’s loss function is also a popular trend in medical segmentation tasks, and it has achieved accurate segmentation for small tumors.
Conclusion
A modified version of ResNet was able to perform automatic segmentation quickly and accurately. The automatically generated contours offered a good starting point for segmentation of primary tumors, but the results still require some manual modification before final clinical implementation. Moreover, the modified ResNet was efficient and conducive to reducing oncologists’ labor intensity. Compared with U-Net, the modified ResNet was notably more accurate based on overlap and receiver operating characteristic curves. In addition, because the shape, size, and spatial orientation of the lung tumors in the dataset varied greatly, data augmentation was adopted. The performance of the proposed method, including accuracy and efficiency, can be further improved in our future work.
Footnotes
Abbreviations
Acknowledgments
The authors thank the radiation oncologists in Radiation Oncology Department, for the target delineation.
Declaration of Conflicting Interests
The author(s) declared no potential conflicts of interest with respect to the research, authorship, and/or publication of this article.
Ethics Statement
The study was approved by the ethics committee of the seventh Medical Center of PLA General Hospital (No. 2018-24).
Funding
The study was supported by Beijing Municipal Science and Technology Commission (No.Z181100001718011). The author(s) received no financial support for the research, authorship, and/or publication of this article.