
Abstract
Introduction
Intensity-modulated radiation therapy (IMRT) provides highly conformal dose distributions around target volume with sharp dose falloffs to organs at risk (OARs), these results in planning and linac delivery complexity. Patient-specific quality assurance (QA) is an important clinical process routinely performed during pretreatment to verify dose calculation and delivery accuracy.1
The ways of patient-specific QA include the measurement-based method (such as a diode or ion chamber array, electronic portal imaging device [EPID], and film), and the calculation-based method (eg, Monte Carlo simulation), in which the most commonly used method was measurement-based dose verification method. 2 The dose difference, distance-to-agreement (DTA), and gamma evaluation were used for results analysis. The most commonly used metric is gamma evaluation, which combines both percentage dose-difference and DTA. 1 The measurement-based dose verification is time-consuming and depends on the equipment heavily. Detector resolution and phantom setup may affect the results. 3 Routine patient-specific QA, which imposes a heavy clinical workload is unfavorable for busy radiation therapy centers on the other hand.
Recently in patient-specific QA, there has been considerable interest in machine learning and deep learning.4–13 The input features of these models include complexity metrics derived from the plans and machine-related parameters,4–9 radiomics analysis and convolutional neural network (CNN)-features derived from images (eg, dose/fluence maps),10–12 or the combination of these features. 13 Valdes et al 4 have trained a Poisson regression with a Lasso regularization model based on complexity metrics that is able to predict the 3%/3 mm gamma passing rate (GPR) of 498 plans, then the prediction model using different measurement approaches was validated at different institutions. 5 Tomori et al 10 used planar dose distributions, the volume of the PTV, rectum, overlapping region, and the monitor unit (MU) values for each field to train the CNN model with 60 prostate IMRT plans. Hirashima et al 13 improved the prediction and classification performance for GPR by using plan complexity and dosiomics features. These developed models could predict GPR for different gamma criteria. Existing studies have demonstrated that machine learning methods could be used to predict the GPR based on treatment plans.4–13 Such prediction models for the patient-specific QA process are potentially useful in alerting physicists to treatment plans with a high likelihood of failing to meet clinical passing criteria. However, deviations may occur during the delivery resulting in dose differences between planning and delivery.14 For instance, an error in leaf positioning of 1 mm could lead to a 6% dose difference at PTV in step-and-shoot and a 5% dose difference in dynamic IMRT delivery.15,16 Thus, the actual parameters play an important role in the dose difference between the treatment planning system (TPS) and delivery. The dynamic log files record delivered parameters (eg, gantry, MU, and multileaf collimator [MLC] positions) of the linac throughout the treatment delivery sampled at 20 ms time intervals. Based on the delivery parameters recorded in log files, using the advanced deep learning algorithm to establish a GPR prediction model has become a new research direction for patient-specific QA.
In this study, we proposed a deep learning method that can accurately predict GPR based on delivery fluence informed by log files. The EPID was used in this study, which is rigidly attached to the gantry, thus eliminating potential setup errors. Predicting GPR accurately of a specific IMRT plan without actual measurement is desirable pretreatment. Additionally, such a prediction model could be used to support the reduction, or even elimination, of patient-specific QA measurements if used in combination with other reliable methods to verify data transfer and delivery accuracy.
Materials and Methods
Data Collection
This retrospective, single-center study was approved by the Shanghai Chest Hospital Ethics Committees (Grant No. KS1863) in October 2018. Each step of the clinical acquisition was rigorously performed according to the recommendations of the Declaration of Helsinki. All patients provided signed written informed consents, and we de-identified all patient details. The current study conformed with the STROBE guidelines. 17 A set of 112 IMRT chest plans (including 584 fields) were randomly enrolled in the retrospective cohort from December 2019 to May 2020 for this study. The numbers of plans for each treatment site were 62 for the radical lung cancers, 14 for the postoperative lung cancers, one for the neoadjuvant esophageal cancers, 27 for the postoperative esophageal cancers, and 8 for the simultaneous integrated boost (SIB) esophageal cancers. The dose prescriptions were 60 Gy in 30 fractions and 50 Gy in 25 fractions for the lung, 4140 Gy in 23 fractions, 5140 Gy in 28 fractions, and 50.4 & 60.2 Gy in 28 fractions for the esophageal. The details of the dataset acquired in this study are summarized in Table 1. All plans were generated in the Eclipse system (Varian Medical Systems). Dose distributions were calculated using the Acuros External Beam (AXB, ver.11.0.31, Varian Medical Systems) with a dose calculation grid of 2 mm. All plans were delivered in 1 day to ensure the stability of the MLC performance and dose output. The linac in our clinic is equipped with a Varian high definition 120 MLC which consists of 2 banks of 60 MLC leaves, with the outer 28 and inner 32 on each side having widths of 0.5 and 0.25 cm, respectively. Patient-specific QA was executed using the actual angle for every patient before starting the treatment. Before portal dosimetry, the ion chamber agreements at the isocenter meeting the clinical requirements were ensured. The generated log files during the delivery were acquired for this study. The Varian MLC dynamic log files hold mechanical information (eg, gantry, collimator, jaws, and leaves) and beam parameters (eg, cumulative MU weights, dose rate fraction, and beam on/off states) of the linac throughout the treatment delivery sampled at 20 ms time intervals. The complete log files contain both the planned and delivered parameters from the TPS to Linac. After exposure, the two-dimensional (2D) gamma analysis was performed to compare the calculated and measured planar dose distributions. The analysis was performed using gamma criteria of 3%/3 mm, 3%/2 mm, 2%/3 mm, and 2%/2 mm with a 10% dose threshold. Absolute dose mode with global normalization was used for gamma evaluations.
The Treatment Sites, Number of Patients, Prescription Dose, and Total MUs/Prescription Dose of the IMRT Plans Used.

Abbreviations: MU, monitor unit; IMRT, intensity-modulated radiation therapy; SIB, simultaneous integrated boost.
EPID Calibration and Portal Dosimetry
The EPID used in this study is a Varian aS1000 model with an active area of 30×40 cm2 that consisted of 768×1024 pixels. The EPID was calibrated by acquisitions of a dark field (DF) and a flood field (FF). The DF image was acquired with no radiation and recorded pixel background offsets. The FF image was acquired by irradiating the EPID with an open field “uniform” irradiation covering the entire region of the imager to determine the difference in individual pixel sensitivity. We used a 2D profiles correction image provided by Varian’s Portal Dosimetry Preconfiguration preconfigured portal dosimetry package, which took into account the backscatter of the supporting arm. The dosimetric calibration of the EPID was performed in terms of calibrated units (CUs) in which the portal dose images were displayed with 100 CUs corresponding to the central axis value of a 10×10 cm2 field at a 100 cm source to surface distance when 100 MUs were delivered. Varian’s preconfigured portal dosimetry package was imported into an Eclipse Workstation for portal dosimetry calculation. The Dynamic Chair and AIDA test plans were delivered to commission and verify portal dosimetry algorithms.
Data Processing for the CNN
We used the pylinac library to extract the absolute MU and the delivery fluence with a resolution of 640 × 480 from the log files, and then cut out the redundant information such as image frame and coordinate axis. The bilinear interpolation algorithm was utilized to get a 260 × 260 Red-Green-Blue image. In the training process, we used horizontal random flipping (flip probability P = .5) and random cropping to enhance data. The 260 × 260 image was randomly cropped to the size of 256 × 256, while the validation set and test set were cropped from 260 × 260 in the center to 256 × 256. As delivery fluence informed by log files is the weighed MU, the absolute MU is reported to have an influence on the model performance of GPR prediction.10 Two prediction models with and without MU were established to investigate whether the absolute MU has an impact on model performance.
Architecture
The architecture of CNN that we adopted is shown in Figure 1, which mainly contains 13 convolutional layers and 4 fully connected layers similar to the VGG16, 18 as well as the corresponding activation layer and pooling layer. After the delivery fluence passed the convolutional layer, activation layer, and pooling layer to the second fully connected layer, the 99-dimensional vector was outputted through the subsequent fully connected layer and activation layer. For the prediction model using the delivery fluence with absolute MU, the 1-dimensional absolute MU was connected in series with the 99-dimensional vector to obtain a 100-dimensional vector, and then the final GPR output was obtained through the subsequent fully connected layer and the activation layer.
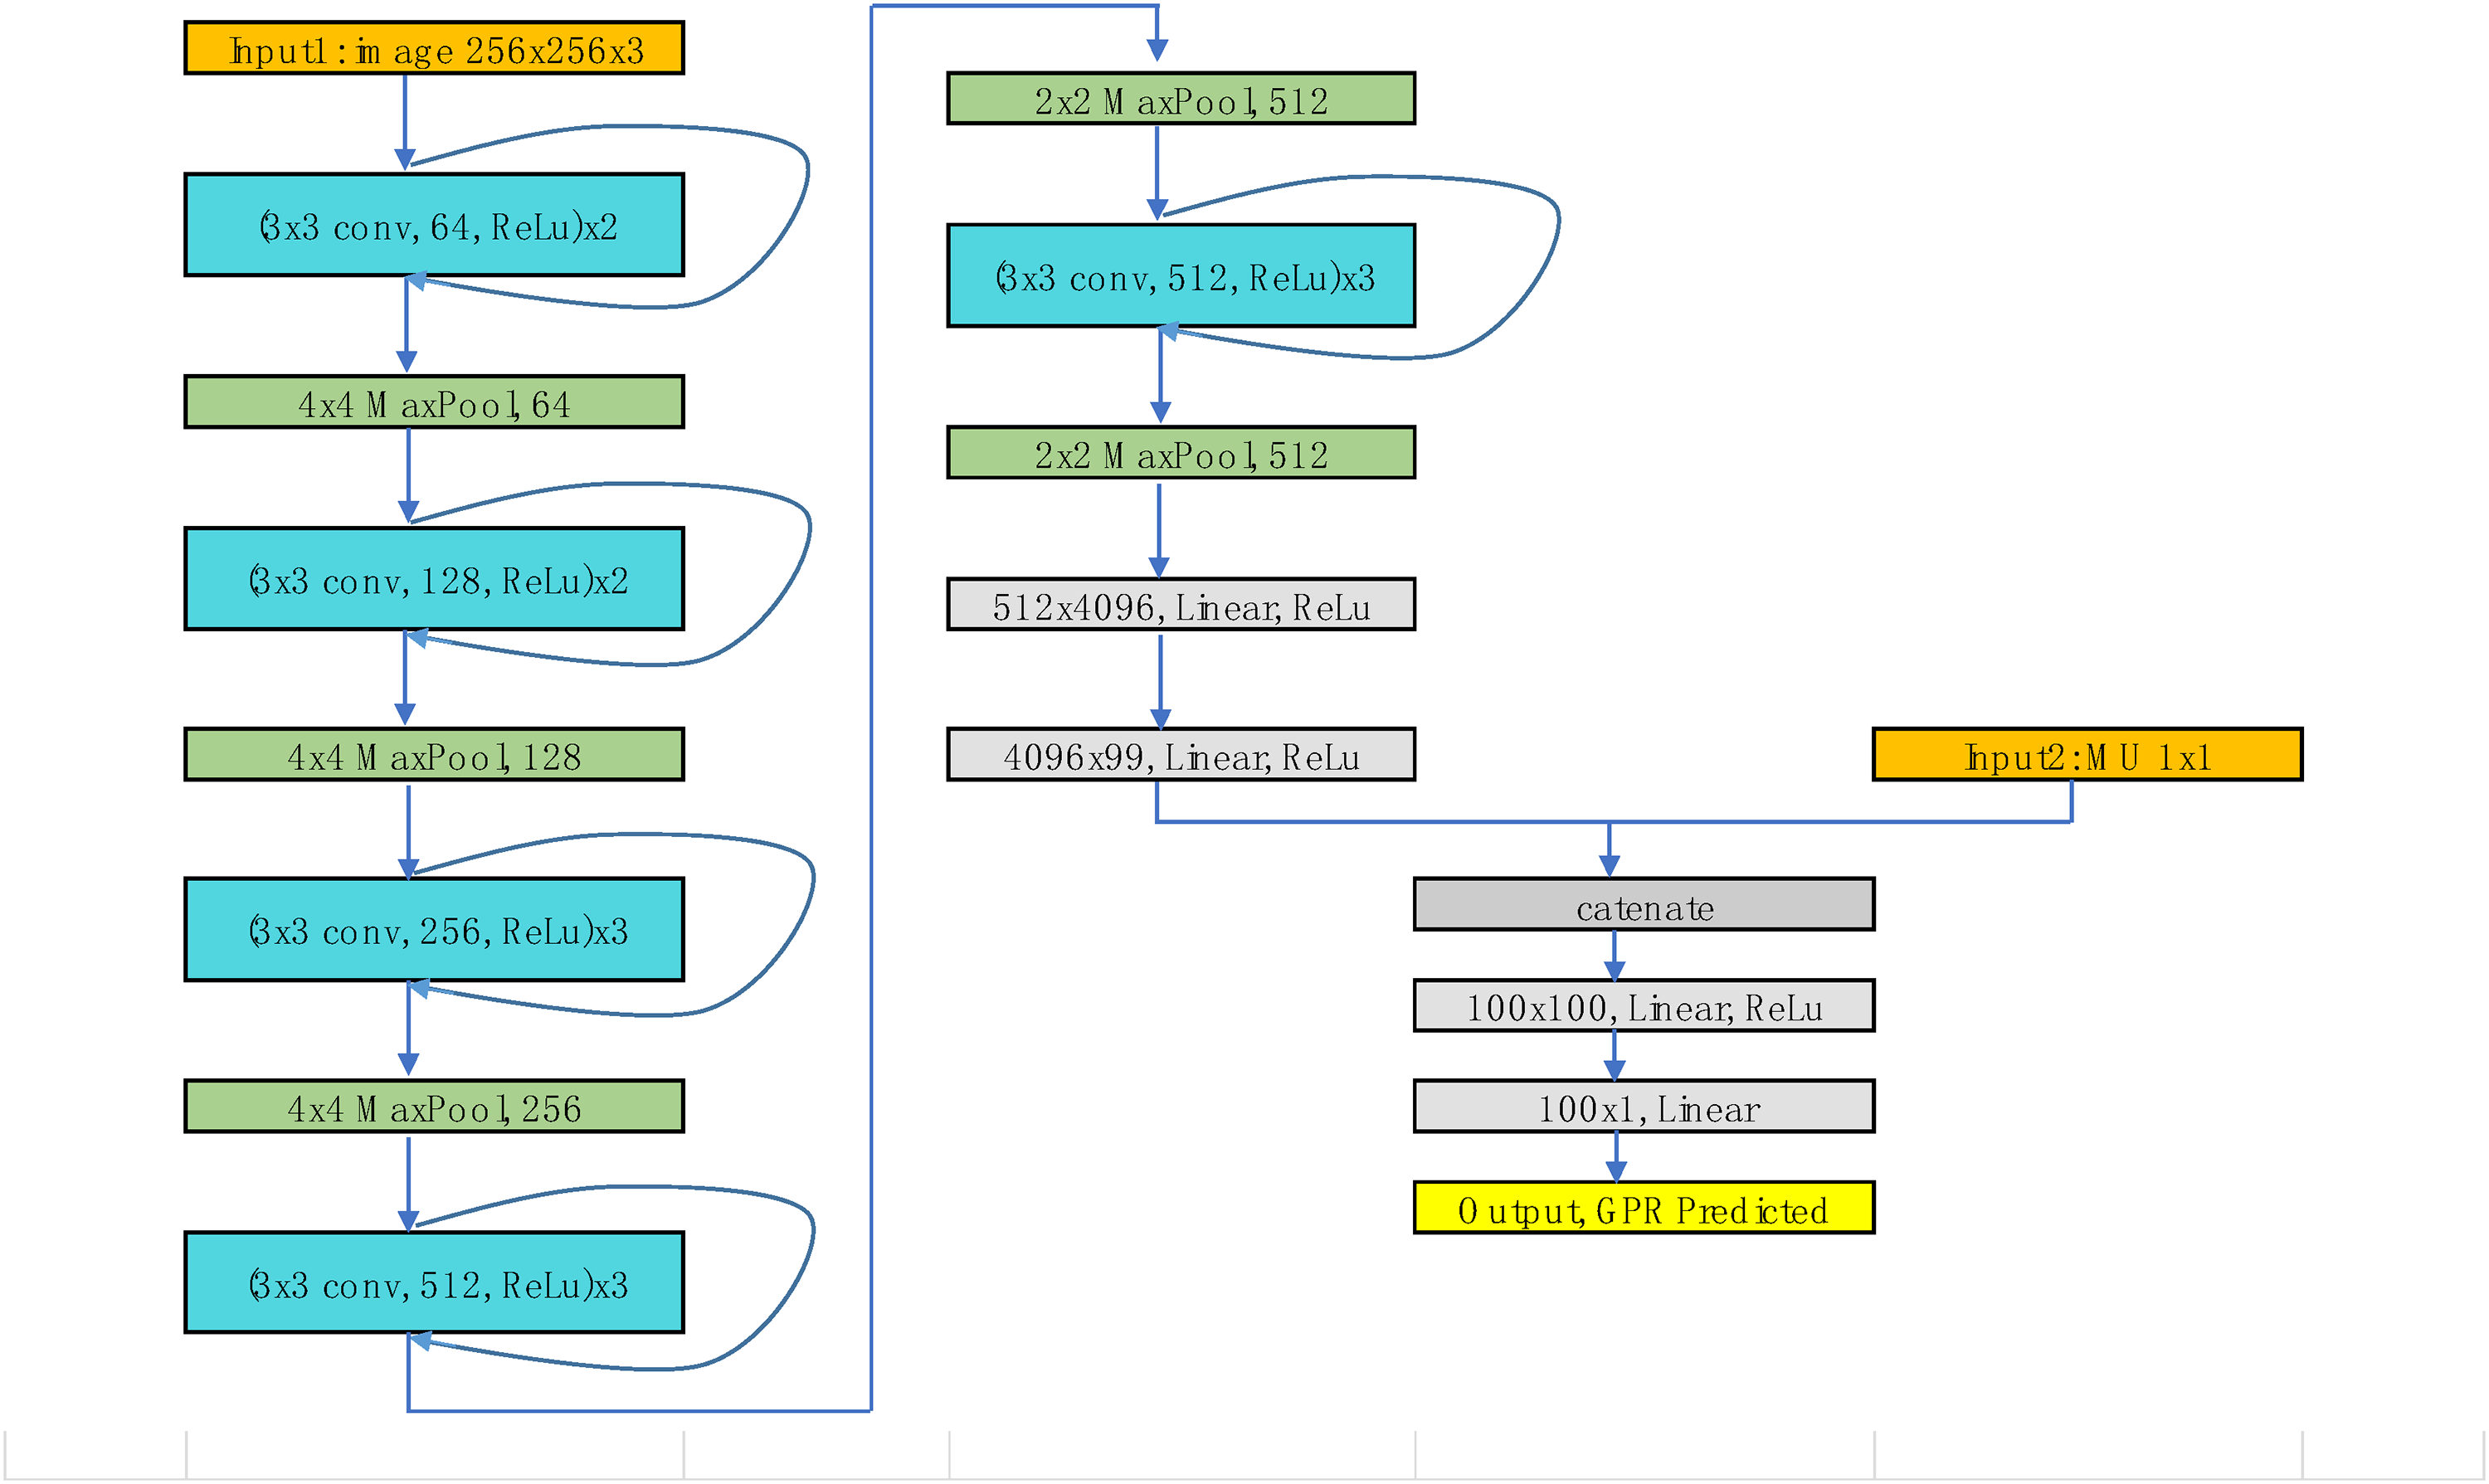
Architecture of the convolutional neural network (CNN).
Model Training and Evaluation
We randomly selected 98 fields (about one-sixth) from the collected 584 samples as the test set. The remaining 486 samples were randomly divided into 5 groups using the 5-fold cross-validation strategy, and 4 of them (389 samples) were used as the training set while 1 (97 samples) as the validation set. Training the model 5 times separately and then choosing parameters of the best performance used for the test set.
Since the GPR value >90% accounts for a high proportion of the input data, while the proportion of GPR value <90% is much smaller, the unbalanced GPR data used as input may result in large prediction errors. The cumulative function of distribution probability was used for GPR equalization; that is, the GPR value of each sample was mapped to the cumulative value of distribution probability of its GPR value. The GPR value was linearly stretched to the range of −50 to 50 so that the data distribution could be relatively balanced, which was beneficial for error reduction.
The model adopted the commonly used Adam optimizer to learn the backpropagation error.19 The initial learning rate was set to 0.001 and decreases exponentially with the training and the rate of decrease was set to 0.9. We used a random mini-batch method to train the data. The batch size was set to 20, and the maximum number of epochs was set to 80. The CNN model was built by the open-source Pytorch library, and the whole 5-fold cross-validation training was completed on NVIDIA Tesla P4 GPU, which took about 150 min. The mean squared error (MSE) was used as a loss function to evaluate the regression error of the GPR prediction.
Statistical Analysis
SPSS software version 22.0 was used for statistical analysis. Measurement GPR is expressed as the mean ± standard deviation (mean ± SD), and a t-test was used to compare the difference between two models with and without MU. P < .05 was considered statistically significant.
Results
Performance of the Prediction Models With and Without the Absolute MU
The MSE value tended to be stable with the increased number of iterations with and without the absolute MU (2%/2 mm 9.50 vs. 9.93, 2%/3 mm 6.65 vs0 7.25, 3%/2 mm 0.99 vs. 0.89, 3%/3 mm 0.64 vs. 0.55) as shown in Figure 2, and there was no significant difference between the predicted GPR for the 2 models under different gamma criteria (2%/2 mm, P = .0630, 2%/3 mm, P = .2590, 3%/2 mm, P = .2182, 3%/3 mm, P = .06911).

Loss curves of 4 gamma criteria (2 mm/2%, 2 mm/3%, 3 mm/2%, and 3 mm/3%) with and without motor unit (MU).
As for the training time of the 2 models (delivery fluence with or without the absolute MU) under 4 different gamma criteria, the training time for a model with MU was 18.78% higher than the model without the absolute MU. Therefore, combined with model performance and training time, the training model without the absolute MU was used for further analysis.
The Measured and Predicted GPR in the Validation set and Test set Under 4 Different Gamma Criteria
The predicted and measured GPR of 4 different gamma criteria are plotted in Figure 2. If the accuracy of the prediction model was perfect, the points should fall on a solid diagonal line. Two dotted lines above and below the solid line represent the measured GPR offset by +3% and −3%, respectively. In actuality, there was a certain deviation between the predicted GPR and the measured GPR under 4 different gamma criteria. Overall, there were 85.82% and 86.48% of the predicted deviations are within ±3% for the validation set and test set, respectively.
MAE, MSE, RMSE, Sr, and R2 for Different Gamma Criteria
Table 1 lists the results of mean absolute error (MAE), mean squared error (MSE), root MSE (RMSE), Spearman rank correlation coefficients (Sr), and determination coefficient (R2) of each group under 4 gamma criteria in the validation set and test set. The prediction accuracy of the prediction model was greatly affected by gamma criteria. The MAE, MSE, and RMSE increased with stricter gamma criteria (from 3%/3 mm to 2%/2 mm), which indicate that the accuracy of GPR prediction decreased. The Sr and R2 of CNN increased as the gamma criteria became stringent. This confirmed a strong or moderate correlation between the measured and predicted values.
Difference Between Measured and Predicted GPR
Figure 3 shows the results of histograms of absolute prediction errors of 4 criteria in the validation set and test set. In the validation test, 91.75% of fields had absolute prediction error <3% at 3%/3 mm; 90.72% of fields had absolute prediction error <3% at 3%/2 mm; 76.29% of fields had absolute prediction error <3% at 2%/3 mm; and only 74.22% of fields had absolute prediction error <3% at 2%/2 mm. In the test set, 96.94% of fields had absolute prediction error <3% at 3%/3 mm; 94.90% of fields had absolute prediction error <3% at 3%/2 mm; 76.53% of fields had absolute prediction error <3% at 2%/3 mm, and 71.43% of fields had absolute prediction error <3% at 2%/2 mm.

Scatter plot of measured and predicted passing rates. (The solid line presents a perfect prediction and 2 dotted lines above and below the solid line represent +3% and −3% deviations from measurements, respectively).
The accuracy of the prediction model was also affected by the measured GPR. In both validation set and test set, fields with measured GPR higher than 95% had significantly lower prediction errors than those with measured GPR <95% at 3%/3 mm and 3%/2 mm gamma criteria (3%/3 mm validation set: 0.39% vs. 3.77%; 3%/3 mm test set: 0.36% vs. 2.44%; 3%/2 mm validation set: 0.62% vs. 1.84%; 3%/2 mm test set: 0.46% vs 3.45%); in 2%/3 mm and 2%/2 mm GPR prediction, fields with measured GPR >85% had significantly lower prediction errors than fields with measured GPR <85% (2%/3 mm validation set: 1.62% vs. 4.18%; 2%/3 mm test set:1.73% vs. 4.40%; 2%/2 mm validation set: 5.87% vs. 1.77%; 2%/2 mm test set: 2.65% vs. 2.98%).
Discussion
In this study, we have built a GPR prediction model using deep learning based on log files. Delivery parameters such as gantry, MU, and leaf positions were recorded in log files at 20 ms time intervals. The GPR prediction model for 4 different gamma criteria was built based on delivery fluence informed by log files. The prediction model could predict GPR accurately, and a strong or moderate correlation between the measured and predicted values in the validation set and test set was founded. Given a large number of IMRT plans in the clinic, the prediction model that can predict patient-specific QA results for IMRT plans pretreatment will be helpful for improving the efficiency of IMRT QA. Thus physicists can devote more resources and time to plans that are more likely to fail IMRT QA (Figure 4).

Histograms of the differences between predicted and measured gamma passing rates.
Patient-specific QA using the machine learning or deep learning algorithm was frequently reported.4–13 These prediction models based on the TPS plan achieved relatively accuracy. However, the prediction model based on the plan parameters could give the potential possibility of whether the plan passed the QA. They cannot accurately predict the QA results of the plans with errors in delivery. Actual parameters such as MLC leaf position, MU, and gantry in delivery may deviate from planned parameters, which will cause dose differences.14–16 Delivery fluence based on log files was used as the input for the prediction model, which is considered to be more accurate than the plan-based prediction model when taking into account the actual delivery parameters. Besides, the prediction model based on the log files can monitor the delivery accuracy continuously among different treatment fractions, while the plan-based prediction model is a one-time prediction.
The MU characterizes the complexity of the plan and is considered to be one of the important parameters in the TPS-based QA prediction model. 7 For another patient-specific QA prediction model based on plan fluence, the addition of the absolute MU improves the accuracy of the model. 10 In this study, the delivery fluence with absolute MU and without absolute MU were used as input to investigate whether the absolute MU has an impact on model performance. The accuracy of the 2 prediction models reached the same level of accuracy, and the addition of the absolute MU did not improve the accuracy of the model. This can be explained that the delivery fluence having a weighted MU, and the absolute MU has no effect on the GPR value. Another reason is that the plan included in this study was designed for chest tumors, and there is no obvious difference in the complexity of the plans. As for the training time of the model, the training time of the model was prolonged by 20% for the delivery fluence combined with the absolute MU. Therefore, this study shows that the CNN model can learn well from the delivery fluence informed by log files and predict GPR. We used the delivery fluence formed by log files to predict GPR as a QA tool in this study. There are classical plan verification methods based on log files (eg, Mobius). 20 Mobius is a three-dimensional (3D) dose verification method that uses log files to efficiently calculate and verify the 3D dose delivered to patients while the prediction model uses a deep learning method to predict GPR based on log files. For Mobius, it was commissioned with measured percent depth doses and profiles, and adjusted the parameters of the linac beam models carefully to scale the model correctly for each institution which may bring additional errors. 21 For this prediction model, it was retrained by the deep learning methods using the previous measurement-based QA results, which are more popularized in different institutions. In addition, gamma evaluation is known as the most widely used method for comparisons between the measured dose distribution and the calculated dose distribution in patient-specific QA while not every clinical center has the supporting equipment of Mobius.
Models about QA results prediction were trained on different datasets including single institution dataset, multiinstitution dataset, single treatment site, multiple sites, different measurement devices, different linacs, etc. Hence, the models give different prediction results. These variations in the type of dataset make the direct comparison of the performance of these models difficult. Some comparisons could only be made to provide some quantitative and qualitative information. Compared to the results of Table 2 with other studies, the MAE and RMSE of the prediction model are close to other studies.8–10 For example, in the study of the CNN-based prediction model, 9 an MAE of 0.7 (3 mm/3%) was found. Here, an MAE of 0.4 (3 mm/3%) was found in the test set. The results indicate that the performance of the prediction model is comparable to other prediction models in predicting QA results. The possible reasons are as follows: (1) as for data input, the log files that record delivery parameters are closer to the actual situation than the TPS plan. (2) This model used in this manuscript improved the performance of CNN. (3) In this study, 4.97% (29 of 584) of fields are <95% for 3%/3 mm gamma criteria and 6.68% (39 of 584) of fields are <95% for 3%/2 mm. As for 2%/3 mm and 2%/2 mm, there is 7.53% (44 of 584) and 9.93% (58 of 584) of fields below 85%, respectively.
MAE, RMSE, Sr, and R2 for different gamma.

Abbreviations: MAE, mean absolute error; MSE, mean squared error; RMSE, root mean squared error; Sr, Spearman rank correlation coefficients; R2, determination coefficient.
With the stricter gamma criteria, the MAE, MSE, and RMSE of the validation set and test set become larger. The reason is that the gamma passing rates decrease with stricter gamma criteria (from 3%/3 mm to 2%/2 mm), and the range of passing rate distribution is relatively wide. The uncertainty and the range of error of the prediction model increase, resulting in the increase of MAE, MSE, and RMSE. Despite these drawbacks, the CNN-based model proposed in this study learned features from the delivery fluence successfully and predicted GPR values with high accuracy. From the results in Table 2, the Sr of 2%/2 mm and 3%/3 mm were the highest and lowest compared to those under the other 2 gamma criteria. This can be inferred that the 3%/3 mm gamma criterion inadequately detected measurement error, resulting in a mismatch between the measured and predicted GPR values. This inference is supported by previous studies that reported the insensitivity of the 3%/3 mm criterion.22–24 Although the MAE, MSE, and RMSE were minimal using the 3%/3 mm, the stricter criteria, such as 2%/2 mm, may be more suitable for the prediction of detecting the plan to which we should pay attention.
The CNN-based model predicted GPR values at 4 criteria, 3%/3 mm, which is a widely and conventionally used criterion with the highest GPR (mean: 99.04% ± 2.14%) in four criteria 3 ; 3%/2 mm, which is the criterion recommended in the TG218 report 25 (mean: 98.76% ± 2.49%); and the other 2 strict criteria of 2%/3 mm (mean: 95.53% ± 6.02%) and 2%/2 mm (mean: 94.66% ± 6.66%) with lower GPR. The prediction model established in this study could predict plans with high GPR and low GPR. Physicists use this prediction model to find plans that are on the threshold of passing or failing and then carry out measurement-based QA for these plans to decide whether to treat or not. In the process of using the prediction model in the future, we can explore whether there is a systematic deviation in the prediction results, and further improve the usefulness of the prediction model.
The accuracy of the prediction model was influenced by the measured GPR value, which was related to the complexity or simplicity of the plans. As for chest cancer, it is a treatment site for which fewer complex plans may be desirable to maximize the robustness of the treatment with respect to variations in breathing motion, to minimize the effect of the interplay between motion and leaf motion for the delivery of the IMRT segments. In terms of the plan design process, the plan complexity of neoadjuvant and postoperative esophageal cancers, lung cancer, and SIB increases in turn for chest plans involved in this study. The relationship between plan complexity and GPR has been investigated.26,27 As the measured GPR decreased, the accuracy of the prediction model would be lower. The unbalance between fields with high GPR values and those with low GPR values also played an important role in model accuracy. The fields with high GPR values are overrepresented in the prediction model, thus, the accuracy of the prediction model will be lower. This limited the usefulness of the training data. It is challenging for a single institution to collect adequate amounts of low GPR plans for model training. To improve the prediction accuracy of plans with low GPR, multiinstitutional collaborative research is warranted.
At present, some limitations still remained in the current study. In this preliminary work, all the input and output data were derived from a single type of Varian Linac and a 2D array. Plans and corresponding QA results with different types of Linac and QA devices will be incorporated in a future study to investigate the generalization of the prediction model. In addition, cross verification investigated the dosimetric agreement among independent TPS dose recalculation, log file-based, and phantom measurement-based QA imposed that care must be taken when choosing the ways of patient-specific QA. 28 Here, it is important to highlight that the deep learning-based prediction model is not intended to replace measurement-based QA but rather to complement the measurement-based QA and provide a more comprehensive view. The prediction model could improve the efficiency of IMRT QA and the safety of treatment delivery.
Conclusions
In this work, the IMRT QA prediction model was established using a deep learning algorithm based on delivery fluence informed by log files. The prediction model could predict GPR accurately under different gamma criteria and shows a strong or moderate correlation between the measured and predicted values. Deep learning is proven to be a useful tool to assist patient-specific QA pre-treatment. It can improve the efficiency of dose verification and lay the foundation for the further development of virtual patient-specific QA.
Footnotes
Abbreviations
Ethics Statements
This study was carried out in accordance with the guidelines of the Ethics Committee of Shanghai Chest Hospital (the committee’s reference Number: KS1863) and was conducted according to the World Medical Association Declaration of Helsinki. Each patient signed the informed consent before treatments at the first hospitalization and kept them in the medical record.
Acknowledgements
The author would like to thank Nurture projects for basic research of Shanghai Chest Hospital (No. 2019YNJCM05) for its financial support.
Declaration of Conflicting Interests
The authors declared no potential conflicts of interest with respect to the research, authorship, and/or publication of this article.
Funding
The authors disclosed receipt of the following financial support for the research, authorship, and/or publication of this article: This work was supported by Nurture projects for basic research of Shanghai Chest Hospital (No. 2019YNJCM05)