
Abstract
, 0.694 −0.714) for OS. The calibration plots of the validation cohorts showed optimal agreement with the training cohort, with a C-index of 0.681 (95% CI 0.646 −0.716) for CSS and 0.645 (95% CI 0.614 −0.676) for OS.
Keywords
Introduction
Lung cancer is one of the most common malignant tumors in the world and the leading cause of cancer-related death in the United States. 1 The incidence and mortality of lung cancer in China have increased significantly in the past 30 years, and non-small cell lung cancer (NSCLC) is the most common pathological type of lung cancer. 2 Despite numerous advances in early diagnosis and adjuvant therapies, surgical resection is currently the only potentially curative therapeutic means for NSCLC and the 5-year overall survival rate remains only approximately 17%, even after surgical management.3,4 In the conventional sense, many factors such as positive lymph node (PLN) count and removed lymph node (LN) count are commonly used to predict survival in cancer outcomes.5–7 However, these predictors fail to clearly distinguish between patients with different negative lymph node (NLN) counts and thus do not predict which patients are more likely to benefit from lymphadenectomy. Therefore, researchers recently recognized the significance of a novel prognostic indicator, NLN count, which showed significant and promising prognostic value for cancer patients. Several studies have highlighted the clinical significance of NLN count in lung cancer and other types of cancer, such as gastric carcinoma, colon cancer, rectal, esophageal, breast, and cholangiocarcinoma.8–13 However, the limitations of these studies included the use of single-center cohorts, small study populations, and lack of validation.
In our study, a multivariate predictive model based on the Surveillance, Epidemiology, and End Results (SEER) database was established, which aimed to provide visualization information and offer extra precision in predicting survival outcomes. In addition, data from The First Affiliated Hospital of Shandong First Medical University& Shandong Provincial Qianfoshan Hospital was also obtained to identify and validate. We hope that this predictive model could benefit lung patients after surgery and provide more insights into the molecular mechanisms of this disease.
Material and Methods
Patient Selection and Eligibility Criteria
In the current cohort study, 67,001 eligible patients with single primary NSCLC diagnosed between 2004 and 2015 were obtained from the SEER database released on August 17, 2021 (SEER*Stat Database: Incidence-SEER 18 Registries Research Plus Data, Nov. 2019 Sub [2000-2017]). The case listing module function of the SEER*Stat software (Surveillance Research Program, National Cancer Institute, www.seer.cancer.gov/seerstat; Version 8.3.9.2) was used to access the data. Clinicopathological characteristics, including age at diagnosis, sex, the sixth American Joint Committee on Cancer (AJCC)/ cancer tumor node metastasis (TNM) stage, grade, histology (ICD-O-3, 8046/3), type of surgery, radiation, chemotherapy, cause of death, survival time (months), regional lymph node positivity, and regional lymph node examination, were recorded. Patients without pathological confirmation were excluded from the study. The other specific exclusion processes are shown in Figure 1. Ultimately, 33,756 patients were enrolled, while patients who underwent lymphadenectomy were selected in our training cohort. The regional nodes examined were defined as the total number of regional lymph nodes that were removed and examined by a pathologist. Positive regional nodes refer to the exact number of regional lymph nodes examined by the pathologist that were found to contain metastases. The number of negative regional nodes, also called the NLN count, was defined as the total number of regional nodes minus the number of positive regional nodes. For cancer-specific survival (CSS), death due to NSCLC was the primary endpoint, and for overall survival (OS), death due to any cause was an event.

Flow diagrams. (A) Flow diagram of the training cohort. (B) Flow diagram of the validation cohort.
Establishment of Nomogram
All variables in the training cohort were analyzed using univariate analysis with a Cox regression model to explore the association between the baseline variables and survival outcomes. Variables with a P-value <.10 in the univariate analysis were included in the multivariate analysis. A stepwise forward Cox regression analysis was then used to identify independent predictive factors in the multivariate analysis. Nomograms that predicted 3-year and 5-year survival were constructed based on independent risk factors in the final multivariate Cox proportional hazards model results. A nomogram is an intuitive and effective method to display the results of risk models that has significant clinical applications in predicting prognosis. The first line of the nomogram panel represents the point values for each variable. The total points were calculated by adding the points identified for each variable. A vertical line can be drawn on the bottom scale at the total point value to indicate the 3- and 5-year probabilities of CSS or OS.
Model Validation
To validate the findings from the SEER database and clarify relevant issues, a dataset containing 545 patients with NSCLC from The First Affiliated Hospital of Shandong First Medical University& Shandong Provincial Qianfoshan Hospital between 2012 and 2016 was assigned to the validation cohort. The inclusion and exclusion criteria were consistent with those in the SEER database (Figure 1B). The Concordance index (C-index) was used to evaluate the discrimination performance of the nomogram. Calibration plots (1000 bootstrap resamples) were used to visualize the performances of the nomograms. The 45° line represents the best prediction.14,15
Statistical Methods
The optimal cutoff value of the NLN count was determined using X-tile software (Version 3.6.1, Yale University School of Medicine, USA). Continuous and categorical variables were compared using the χ2 test and Mann–Whitney U-test, respectively. The Kaplan–Meier method was used to assess the effect of NLN count on CSS and OS. Univariate and multivariate Cox proportional hazard models with a stepwise forward method were used to analyze the risk factors related to CSS and OS in patients with NSCLC; hazard ratios (HRs) and 95% confidence intervals (CIs) were calculated, with an HR of <1.0 indicating survival. Receiver operating characteristic (ROC) and decision curve analysis (DCA) curves were used to analyze sensitivity and specificity between the nomogram and TNM stage. All statistical analyses were performed using R ver. 3.5.0 (the R Foundation for Statistical Computing, Vienna, Austria), and SPSS ver. 20.0 (SPSS Inc., Chicago, IL, USA) software. All statistical tests were two-sided, with a P-value <.05 considered statistically significant.
Ethics Statement
The authors are accountable for all aspects of the work in ensuring that questions related to the accuracy or integrity of any part of the work are appropriately investigated and resolved. The request for the SEER Research Plus Data was approved to obtain therapy information for research purposes only (reference number: 18323-Nov2020). Institutional review board approval was not required because SEER is an anonymized database that is open to the public. Informed patient consent from the validation cohort was approved by The First Affiliated Hospital of Shandong First Medical University& Shandong Provincial Qianfoshan Hospital review board (No. S033). The study was conducted in accordance with the principles of the Declaration of Helsinki (as revised in 2013).
Results
Patient Characteristics
From 2004 to 2015, a total of 33,756 NSCLC patients were collected from the SEER database, of whom 4987 (14.8%) were assigned to the training set (Figure 1A). Of all patients in the training cohort, 2186 (43.8%) were female and 2801 (56.2%) were male. The median age at diagnosis of the included patients was 67 years (range, 20-95) years. The cutoff value for the NLN count was 15 (range, 0-60). We determined the best cutoff value using X-tile software and thus divided the entire cohort into two subgroups (low NLN count [0-14] and high NLN count [≥15]). There were 4481 patients (89.9%) with a low NLN count and 506 patients (10.1%) with a high NLN count. The characteristics of the training cohort are shown in Table 1.
Demographic and Clinicopathological Characteristics of Patients with NSCLC

Notes: In the training set: Low NLN count subgroup: 0 to 14 NLN count. High NLN count subgroup: ≥15 NLN count; In the validation set: Low NLN count subgroup: 0 to 6 NLN count. High NLN count subgroup: ≥7 NLN count.
Abbreviations: NLN, negative lymph node; TNM, tumor, node, metastases; Tumor grade: I: highly differentiated; II: moderately differentiated; III: poorly differentiated; IV: undifferentiated; Unknown: unknown tumor differentiation.
In the validation cohort study, a total of 545 eligible patients with lymphadenectomy information from The First Affiliated Hospital of Shandong First Medical University& Shandong Provincial Qianfoshan Hospital between 2012 and 2016 were also identified, including 152 (27.9%) women and 393 (72.1%) men. The median age at diagnosis was 60 years (range, 32-84 years). NLN count was divided into two subgroups using X-tile software: low NLN count, 0 to 6; high NLN count, ≥7 (range, 0-41). Patient demographics and pathological characteristics are shown in Table 1.
Effects of NLN Count on Survival
First, we determined the impact of lymphadenectomy on survival, and found that patients who underwent lymphadenectomy had improved survival in both CSS and OS (Figure 2A and B, all P < .001). Next, we analyzed the prognostic effect of NLN count in the training and validation cohorts. Kaplan–Meier analyses showed that NLN count was positively associated with CSS and OS, and a high NLN count group was associated with better survival in both the training and validation cohorts. (Figure 2C–F, all P < .001). In addition, a stronger survival advantage of the NLN count was found in patients with worse M and lymph node (N) status. In other words, the survival benefit trend was constant regardless of M (Supplementary Figure 1, all P < .05) and N status (Supplementary Figure 2, all P < .05).
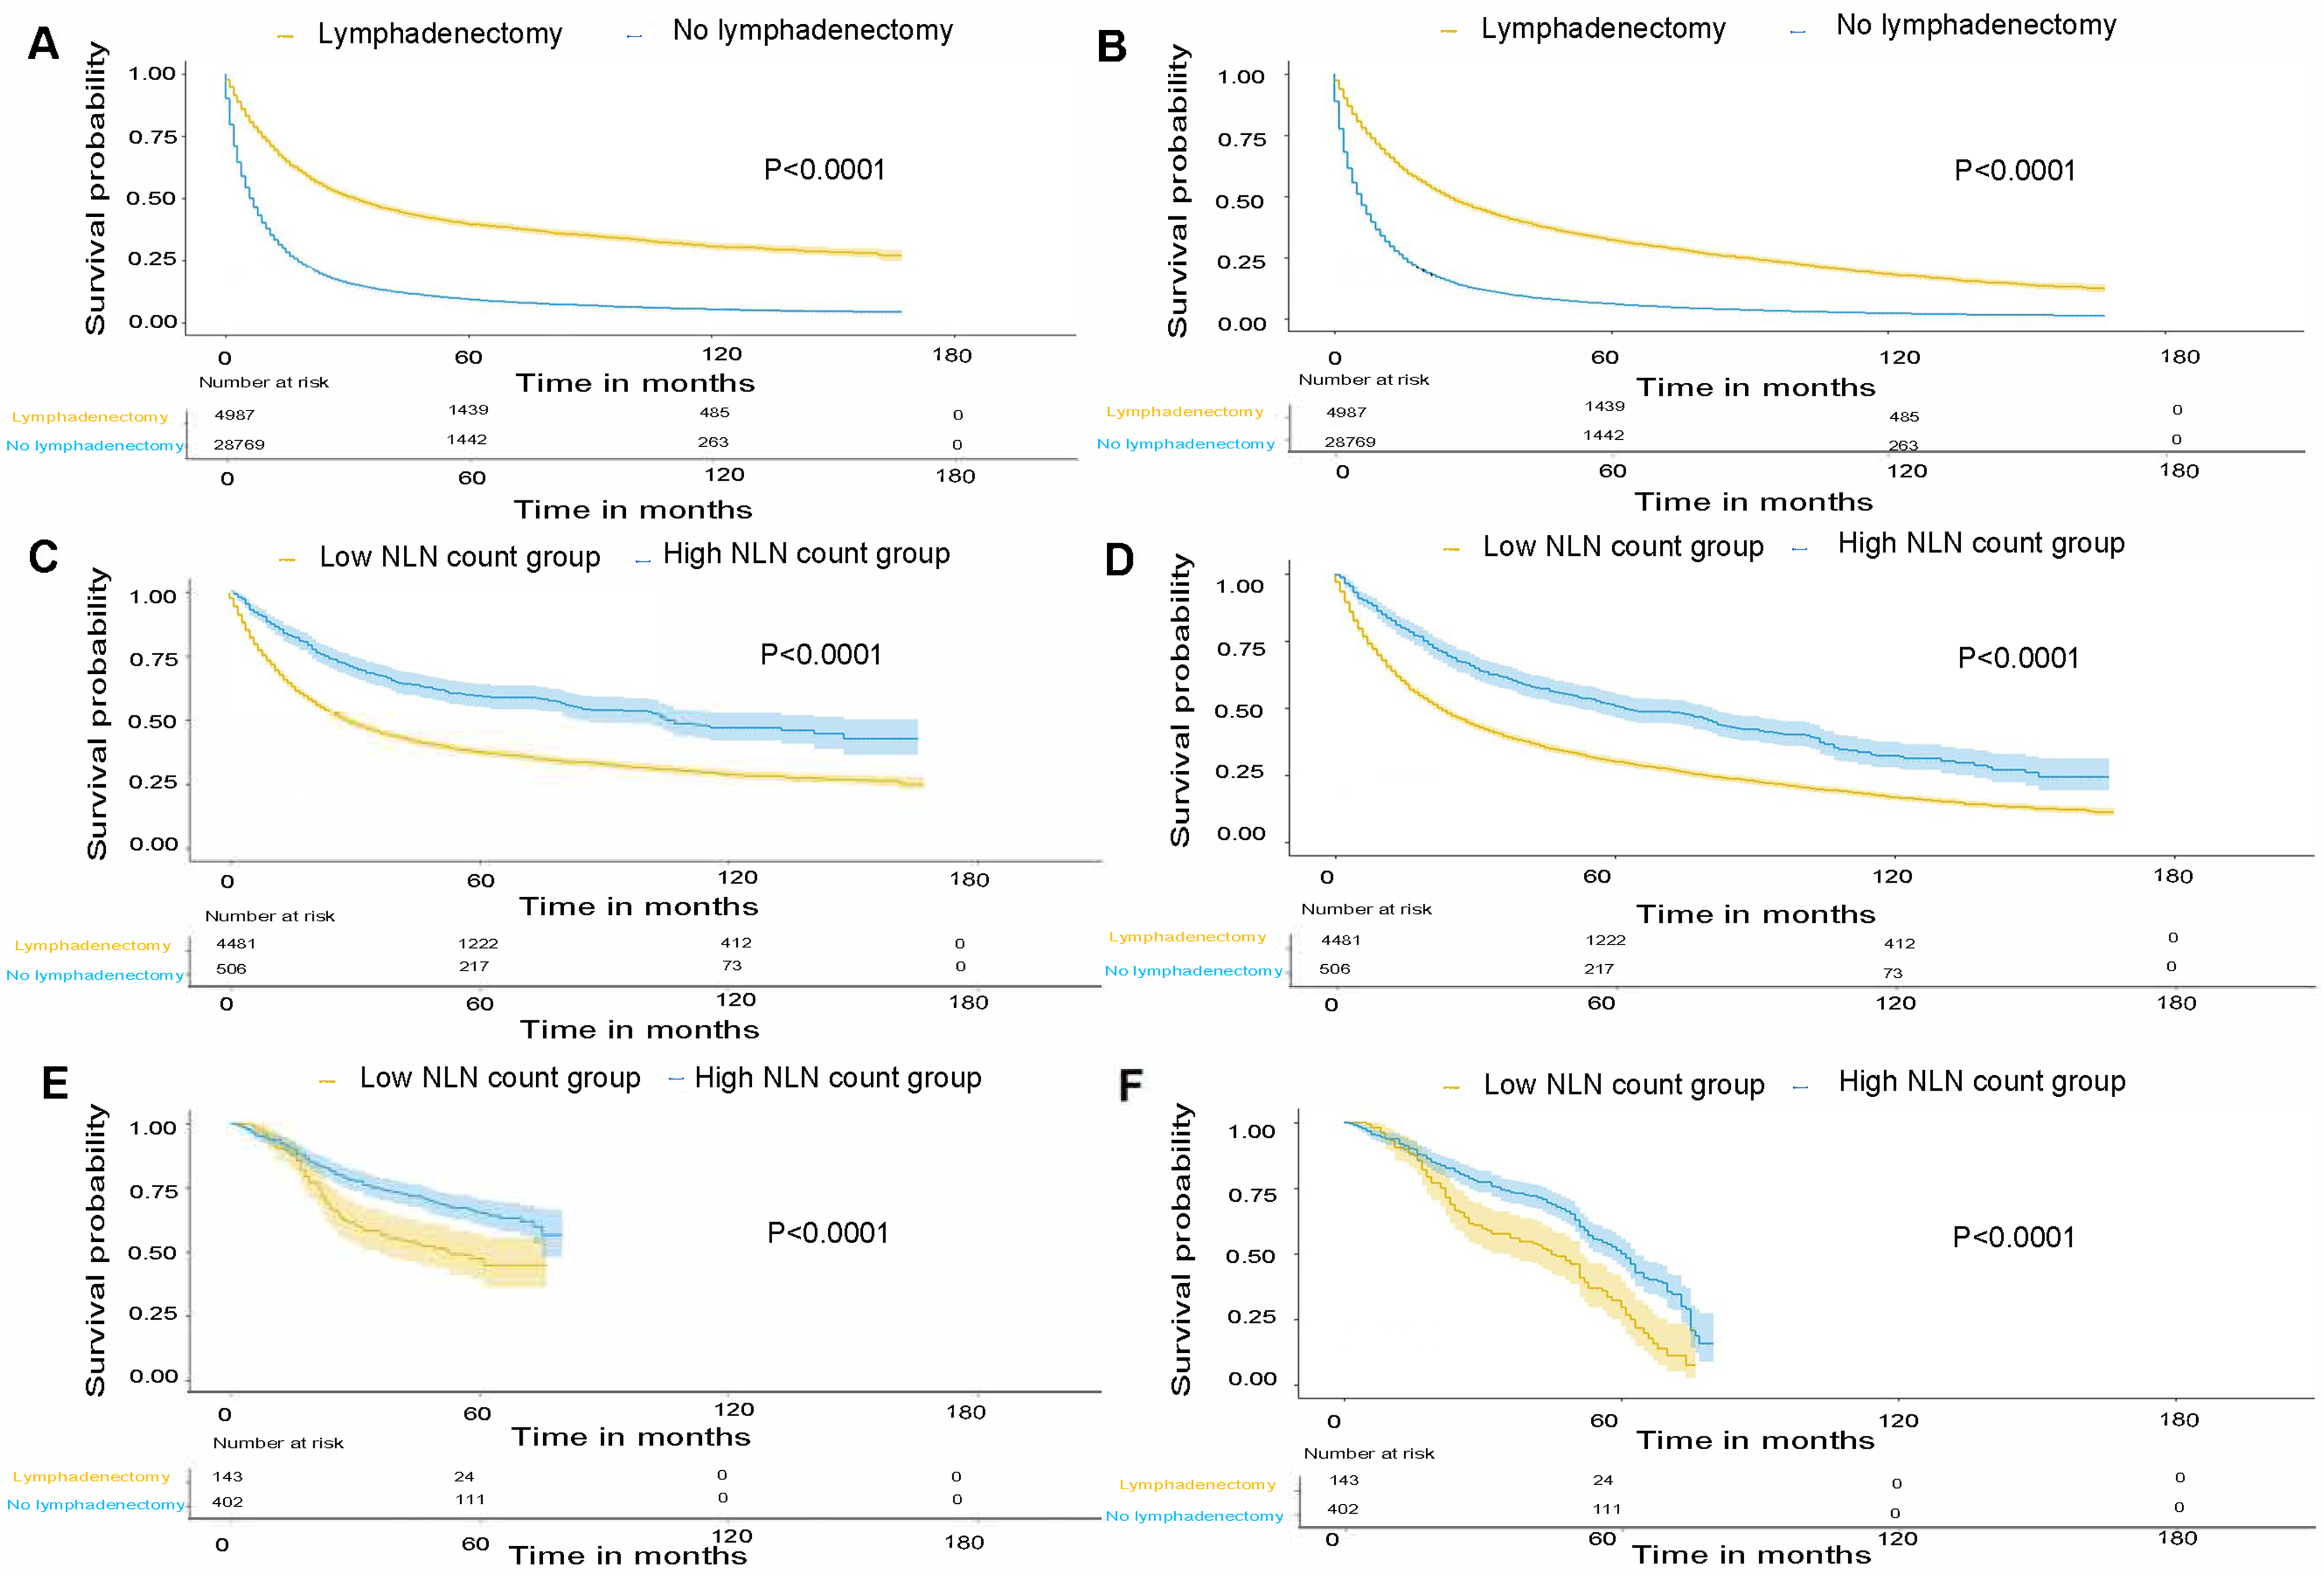
Survival analysis. (A) Prognostic value of lymphadenectomy in CSS in the training set. (B) Prognostic value of lymphadenectomy in OS in the training set. (C) CSS for high (≥15) and low (0-14) NLN count subgroups in the training set. (D) OS for high (≥15) and low (0-14) NLN count subgroup in the training set. (E) CSS for high (≥7) and low (0-6) NLN count subgroup in the validation set. (F) OS for high (≥7) and low (0-6) NLN count subgroup in the validation set.
The results of univariate and multivariate Cox proportional hazard model analyses are shown in Table 2. Univariate analyses revealed that NLN count and other clinicopathological characteristics including age, sex, TNM stage, radiotherapy and chemotherapy were associated with CSS and OS (all P < .001). Multivariate analyses were further performed using the above factors and confirmed that NLN count, age, sex, TNM stage, radiotherapy and chemotherapy were independent prognostic factors for CSS and OS, and patients with high NLN count had better CSS than those with low NLN count (HR = 0.632, 95% CI: 0.551-0.724, P < .001). A consistent trend was also found for OS (HR = 0.641, 95% CI: 0.571-0.720, P < .001[high vs low]). In other words, a higher NLN count was found to have a better effect on survival in NSCLC, independent of sex, age, TNM stage, radiotherapy, and chemotherapy (Table 2).
Cox proportional hazard model analysis for CSS and OS in the training cohort

Notes: *Low NLN count for CSS: 0 to 14 NLNs. †High NLNs for CSS: ≥15 NLNs.
Abbreviations: CSS, cancer specific survival; HR, hazard ratio; CI, confidence interval; TNM, tumor, node, metastases; NLN, negative lymph node.
Construction and Validation of Nomogram
First, we established a nomogram using the results of the final multivariate Cox analysis. (Figure 3A for CSS and Figure 3B for OS) at 3 and 5 years, respectively. Variables included in the nomogram were the same as those in the multivariate Cox risk model. Next, internal validation was performed, with a C-index estimated by analyzing the SEER database. The c-statistic of the predictive models was 0.789 (95% CI: 0.778 −0.798) for CSS and 0.704 (95% CI: 0.694 −0.714) for OS, which indicated a good ability to predict outcome. We then constructed a calibration plot to determine whether the predicted and observed probabilities of survival were in accordance. As expected, the calibration plots for the probability of 3 years and 5 years showed good consistency between the prediction by nomogram and actual observation in survival (Figure 4A and C for CSS, Figure 4B and D for OS). In addition, the length of the line for each variable in the nomogram indicates the influence and values of the final outcomes. The longer the line, the greater the influence of the variable on the result. In our nomogram, we can see that the length of the line for NLN count was longest for both CSS and OS. Therefore, our nomogram predicts the prognosis of patients with NSCLC intuitively, which is different from traditional clinical predictors, such as TNM stage and other variables.

Establishment of the nomogram. (A) Nomogram predicting the 3- and 5-year CSS. (B) Nomogram predicting the 3- and 5-year OS. In the panels, the first row is the points assigned for each variable. The points for each variable are summed to obtain a total. A vertical line is drawn from this point to obtain the 3- and 5-year probabilities of survival.

Calibration curves for 3- and 5-year survival. (A) Calibration curve for 3-year CSS based on the training cohort. (B) Calibration curve for 3-year OS based on the training cohort. (C) Calibration curve for 5-year CSS based on the training cohort. (D) Calibration curve for 5-year OS based on the training cohort. (E) Calibration curve for 3-year CSS based on the validation cohort. (F) Calibration curve for 3-year OS based on the validation cohort. (G) Calibration curve for 5-year CSS based on the validation cohort. (H) Calibration curve for 5-year OS based on the validation cohort.
Finally, external validation was performed using an independent validation cohort of 545 patients from The First Affiliated Hospital of Shandong First Medical University& Shandong Provincial Qianfoshan Hospital. The C-index measuring predictive accuracy in the test cohort was 0.681 (95% CI: 0.646 −0.716) for CSS and 0.645 (95% CI: 0.614 −0.676) for OS, which demonstrated a good level of discriminative ability. As expected, the calibration curve suggests that the nomogram was well calibrated and the 3- and 5-year calibration curve showed an agreement between the actual observation and nomogram prediction (Figure 3E and G for CSS, Figure 3F and H for OS). In addition, we performed ROC curve analysis and DCA curve analysis on nomogram and TNM stage, and found that the performance of the nomogram for CSS and OS was better than that of the TNM stage (Figure 5, P < .05). Therefore, the results proved that the nomogram for predicting patient prognosis had excellent advantages both in the short and long term.

ROC and DCA curves for nomogram and TNM stage. (A) The CSS ROC curve for the nomogram and TNM stage in the training cohort. (B) The OS ROC curve for the nomogram and TNM stage in the training cohort. (C) The CSS ROC curve for the nomogram and TNM stage in the validation cohort. (D) The OS ROC curve for the nomogram and TNM stage in the validation cohort. (E) The CSS ROC curve for the nomogram and TNM stage in the training cohort. (F) The OS ROC curve for the nomogram and TNM stage in the training cohort. (G) The CSS ROC curve for the nomogram and TNM stage in the validation cohort. (H) The OS ROC curve for the nomogram and TNM stage in the validation cohort.
Discussion
Although the LN and PLN counts have been considered to be of great value in determining the prognosis of patients with NSCLC,16,17 the NLN count is now widely believed to be a better prognostic factor that predicts survival status and provides guidelines for postoperative therapy.8,12,18 In our study, we found that NLN count is a significant predictor of survival outcome in a large cohort of NSCLC patients. In addition, we established a nomogram including NLN count based on the SEER database for the first time. A nomogram is a predictive model that incorporates multiple factors to predict patient survival outcomes. Many studies have shown that the nomogram is more accurate than conventional TNM stage in predicting patient prognosis,19,20 which is consistent with our results obtained using ROC and DCA curves. The nomogram was further validated by our own hospital data, which showed good agreement with the prediction and determined the prognostic value and significance of NLN count. These findings contribute to the clinical translation of our results.
As noted above, NLN count positively correlated with survival, and the high NLN count group was found to be associated with better survival with respect to both CSS and OS. Findings from several studies may explain this prognostic phenomenon. First, increasing the number of NLNs examined has been shown to be associated with a significant improvement in survival benefit, thus ensuring accurate staging and adequate treatment, and delivering the optimum adjuvant therapy strategy.21,22 Second, extensive lymphadenectomy provides a protective effect for patients, and reduces the risk of understaging.
23
Therefore, better surgery with more extensive lymphadenectomy may potentially mitigate the detrimental effects of NSCLC on survival.
The N status has long been regarded as a vital criterion in cancer staging and the strongest prognostic indicator for survival after surgery. The definition standard of N status in the AJCC TNM classification system depends on localized spread to the regional lymph nodes and lymph node status.24,25 In our study, our survival curve showed that NLN count was associated with a stronger survival benefit in patients with worse staging and N status. For a long time, it has been widely accepted that stage IV lung cancer patients are those with distant metastasis regardless of N status. Therefore, the N status of stage IV patients was ignored for the M status (M0 and M1). Palliative surgery is constantly performed in patients with metastatic (M1) disease to improve quality of life, alleviate symptoms, and prevent complications with limited resection or lymph node retrieval. In our study, NLN count was associated with survival benefits in the N3 and M1 stages in our subgroup analysis, which was consistent with some findings in stage IV cancer patients.26,27 Therefore, N stage is a significant factor affecting survival outcome, especially in stage IV patients, which indicates that the prognostic role of N status in M1 disease should not be underestimated. Moreover, disease management for NSCLC has recently evolved into multidisciplinary therapy and now requires more accurate selection of patients with advanced disease to maximize the effect of lymphadenectomy and minimize morbidity.
In the current study, we established an NLN-based nomogram to predict survival outcomes at 36 and 60 months. Several clinical parameters have been reported as prognostic markers.28–31 In accordance with these findings, our study revealed a strong correlation between survival and these independent prognostic factors in the multivariate Cox proportional hazards model. Based on these variables, the nomogram precisely predicted the survival probability in the internal and external cohorts. Survival prediction is a crucial issue for NSCLC patients undergoing resection; this predictive model could assist physicians by providing individualized risk estimates of survival outcomes and potentially helping to avoid unnecessary treatments in patients.
The present study had several limitations. First, the SEER database only contained general treatment information, and there was no more detailed clinical treatment information, such as specific chemotherapy and radiotherapy regiments, targeted therapy, and immunotherapy, which may have caused bias in our study. Second, since this is a retrospective analysis, more prospective large randomized clinical trials and multicenter clinical samples are needed to further validate the reliability of our study findings. Finally, the lack of molecular analysis may overlook important prognostic clues for researchers.
Conclusion
In summary, the NLN count was determined to be a promising prognostic factor in patients with NSCLC. This is the first study to establish a novel prognosis prediction model based on NLN count in NSCLC based on a large cohort and validated the prognostic role of NLN count using our own hospital data, which could assist in personalizing the risk classification of patients. Further studies about NLN count are needed to determine optimal lymph node resection and the underlying molecular mechanisms of NSCLC.
Footnotes
Acknowledgements
We gratefully acknowledge the Surveillance, Epidemiology, and End Results (SEER) program tumor registries in the creation of the SEER-Medicare database.
Author's Note
Conception and design: All authors. Administrative and fund support: Jiandong Zhang. Provision of study materials or patients: All authors. Collection and assembly of data: All authors. Data analysis and interpretation: Xinyi Huang and Pingping Hu. Manuscript writing: Xinyi Huang and Pingping Hu. All authors contributed to the article and approved the submitted version.
Declaration of Conflicting Interests
The author(s) declared no potential conflicts of interest with respect to the research, authorship, and/or publication of this article.
Ethics Statement
The authors are accountable for all aspects of the work in ensuring that questions related to the accuracy or integrity of any part of the work are appropriately investigated and resolved. The request for the SEER Research Plus Data was approved to obtain therapy information for research purposes only (reference number: 18323-Nov2020). Institutional review board approval was not required because SEER is an anonymized database that is open to the public. Informed patient consent from the validation cohort was approved by The First Affiliated Hospital of Shandong First Medical University review board (No. S033). The study was conducted in accordance with the principles of the Declaration of Helsinki (as revised in 2013).
Data Accessibility Statement
Funding
The author(s) declared the following potential conflicts of interest with respect to the research, authorship, and/or publication of this article: This study was funded by the National Natural Science Foundation of China [grant no. 81672974].
Supplemental material
Supplemental material for this article is available online.