
Abstract
Introduction
Remarkable development has been made in drug therapies for viral hepatitis, the primary cause of hepatocellular carcinoma (HCC). Direct-acting antiviral agents (DAAs) administered to patients with chronic hepatitis C cirrhosis showed a carcinogenic inhibition (hazard ratio [HR]: 0.48, 95% confidence interval [CI]: 0.33-0.70), 1 with a cancer incidence rate of 6.23% in patients achieving sustained virological response (SVR). 2 Nucleic acid analogs (NAs) administered to patients with chronic hepatitis B cirrhosis have shown a carcinogenic inhibition (risk ratio: 0.55, 95% CI: 0.31-0.99), 3 and conversely an increased carcinogenesis rate compared to untreated patients in the immune tolerance phase (HR: 3.44, 95% CI: 1.82-6.52). 4 However, the carcinogenesis after liver cirrhosis (LC) following the quiescence of hepatitis B or SVR of hepatitis C attributed to drug therapy, and after LC due to nonviral liver diseases remains an unresolved issue. 5 Therefore, surveillance is important because, despite the benefit of treatment, cases of progression to HCC still persist. 6 Adequate prediction and classification of high-risk groups for HCC in LC, with the underlying liver lesion as pre-HCC, is urgently required.
Tumor markers are used to complement the definitive diagnosis of HCC using imaging, surveillance, and treatment response indicators. In particular, these markers are considered an important surveillance tool for the early detection of HCC in LCs of sizes that are difficult to detect by abdominal ultrasonography.6,7 However, existing methods are limited in terms of testing efficiency and cost-effectiveness due to the characteristics of tumor markers.6,8 As major tumor markers, the high false-negative rate of alpha-fetoprotein (AFP) and false-positive rate of des-gamma carboxyprothrombin (DCP) are problematic at current cut-off points. 6 Therefore, both are measured simultaneously for complementation9,10; although sensitivity is increased, specificity is compromised and false positives increase. Furthermore, recent treatments for hepatitis B and C revealed decreased basal AFP levels in post-treatment patients with LC.11,12 Furthermore, revising the AFP cutoff point downward to match this decline, focusing solely on sensitivity, would lead to more unnecessary testing. Therefore, an appropriate cutoff point for LCs, to include post-antiviral treatment patients with decreased tumor marker levels, is required, however, remains unknown. To avoid reducing the testing efficiency and cost-effectiveness of better surveillance, a positive likelihood ratio (pLR) must be ensured. 6 In addition, tumor markers alone lack the discriminatory power to provide pLR assurance and details of qualitative changes in LC prior to the onset of HCC for high-risk classification.
MicroRNAs (miRNAs) epigenetically regulate functional proteins involved in carcinogenesis through the regulation of target mRNAs. 13 Circulating exosomal miRNAs, contribute to the immunomodulation, chemoresistance, and metastasis of multiple tumor types. 14 Therefore, liquid biopsy using miRNAs as cancer biomarkers may be a possible approach for future research.15,16 Multicenter studies have assessed HCC using comprehensive exhaustive microarray panels, 17 however, the details are unclear owing to the lack of physiological relevance of miRNAs and the inter-institutional validation of reverse transcription-quantitative polymerase chain reaction (RT-qPCR). Large-scale measurements, such as microarrays containing miRNAs with widely varying GC content have validation issues, such as the lack of accuracy with traditional quantitative polymerase chain reaction (qPCR). 18
Therefore, our aim was to improve the surveillance of high-risk HCC patients by propensity scoring of tumor markers and additional predictors such as plasma levels of miRNAs and related factors selected in terms of availability and their physiological relevance to HCC. Furthermore, we attempted to identify differences in patients with LC, including the presence or absence of HCC complications and complete recovery after treatment; that is, the presence or absence of preexisting conditions. miRNAs involved in immune responses that initiate or terminate carcinogenesis and cytokines that suggest such responses may be beneficial as complementary indicators of tumor markers. This is the first pilot study to combine these indices, which reveal qualitative changes in LC, because of their potential to improve the identification of early-HCC using tumor markers alone, including postantiviral therapy patients with reduced tumor marker values.
Materials and Methods
Clinical Samples
This single-center, prospective pilot study included patients with LC treated at the Department of Gastroenterology, Teine Keijinkai Hospital. In total, 87 patients with LC were once enrolled, 43 with current HCC (cHCC); included 8 patients with early-HCC (stage I, single lesion ≤ 2 cm, Japanese Liver Cancer Treatment Code); 24 with previous HCC cured completely (pHCC), 20 with intact LC (iLC), and patients without current or previous HCC. We excluded patients who were unable to provide consent, blood drawn, minors, and those who had not developed LC, as followed physician's determination. Two patients with pHCC were excluded because blood samples could not be drawn. Blood samples were collected from all participants except those excluded. Thus, 85 participants were eligible (Figure 1). Participants formed consecutive series. The 3 groups were statistically compared to determine whether they could be distinguished using the indicators. The clinical information of the participants was obtained from hospital medical records. Sample collection was performed in the hospital from after registration on October 8, 2021, to December 1, 2022. Data measurement and analysis were performed at the Hokkaido University of Science. Ethics approval to conduct the study was obtained from the Teine Keijinkai Hospital and Hokkaido University of Science (as described in the “Ethics Approval” section).

Flowchart of participants.
Written informed consent from the patient was required for participation in the study. De-identified all patient details. The reporting of this study conforms to the STARD guidline. 19
miRNA and Cytokine Selection
hsa-miR-146a-5p,15,20 hsa-miR-21-5p,15,21,22 hsa-miR-122-5p,15,21 and hsa-miR-320b 23 were selected as target miRNAs based on their physiological relevance for HCC, the availability of LNA primers for robust qPCR, regardless of GC content, 18 and the ability to optimize the conditions for measuring blood levels in preliminary studies. In addition, measurable combinational predictors physiologically associated with target miRNAs, such as cytokines and fibrosis indices, were evaluated: IL-17A, 24 which activates hepatocyte stellate cells (HSCs) and leads to liver fibrosis, inflammatory IFN-γ, 25 and anti-inflammatory IL-10, which increases in HCC and hepatitis with inflammation, is considered inadequate for differentiation of cHCC. 26 But, a decrease in IL-10 may provide some benefit in discriminating of cured HCC. MiR-146a-5p has roles in immune responses and pathogenesis of HCC; targets tumor necrosis factor receptor-associated factor 6, interleukin-1 receptor-associated kinase 1 in HSC, signal transducer and activator of transcription (STAT) 1 in IL-10 producing regulatory T cell (Treg) and IFN-γ producing natural killer cell and hepatocyte nuclear factor 1α in hepatocytes.15,20 MiR-21-5p is associated with tumor invasion and metastasis 20 and derived from HCC contributes to tumor progression by suppressing phosphatase and tensin homolog deleted from chromosome 10 (PTEN) as a tumor suppressor in HSC.15,22 MiR-122 is associated with inflammation and advanced fibrosis that initiates viral hepatitis, LC, and early stages of HCC.15,21 MiR-320b associates with nonalcoholic and viral hepatitis, 15 and tumor growth inhibition. 23 Evaluation of interrelated miRNA and cytokine responses, which are involved in the fibrogenesis oncogenic immune response, may complement evaluation with conventional tumor markers.
Measurement of Valuables
Plasma samples were stored at −80 °C until use. Plasma concentrations of target miRNAs were measured using template RNA, including miRNAs, extracted from the plasma using the QIAGEN miRNeasy Serum/Plasma Advanced kit (QIAGEN, Hilden, Germany). cDNA was generated using the QIAGEN miRCURY LNA RT kit, and the reverse transcription reaction was confirmed using a spiked control as UniSp6. RT-qPCR was performed using the miRCURY LNA SYBER Green PCR kit and an miRNA PCR Assay containing target-specific primers (hsa-miR-103a-3p, YP00204063; hsa-miR-146a-5p, YP00204688; hsa-miR-21-5p, YP00204230; hsa-miR-122-5p, YP00205664; hsa-miR-320b, YP02119299; QIAGEN). The standards of miRNAs were not available. The relative expression of target miRNAs was analyzed by RT-qPCR, using a 7500 Fast Real-Time PCR system (Applied Biosystems, Foster City, CA, USA) and normalized to the endogenous stable control miR-103a-3p 27 using the comparative threshold cycle method. Appropriate amplification and determination of the targets using the LNA primers for qPCR method 18 were ensured by the single product attributed to the melting curves of each target miRNA.
The plasma concentrations of cytokines (IL-17A, IL-10, and IFN-γ) were measured using the Legend Max human ELISA kit (BioLegend); the standard ranges for IL-17 and IL-10 were 3.9 to 250 pg/mL, and for IFN-γ was 7.8 to 1000 pg/mL, and the % coefficient of variation of intra- and interassay precision was < 5 and 8, respectively.
The following indicators were used in the study: HCC tumor markers, such as AFP and DCP; liver function indices, such as the Child–Pugh score (CPS) 28 ; and liver fibrosis indices, such as the Fib4-index. 29
Statistical Analysis
A significance level of 5%, a power of 0.8, and an effect size of 0.64 was determined. cHCC was used to target a sample size of 40 cases and 40 other cases. Multiple comparisons among the groups were performed using the Kruskal–Wallis and Steel–Dwass tests, as appropriate. Correlations between the indices were evaluated using Pearson's or Spearman's correlation coefficients, as appropriate. Stratification or matching was not performed.
The ability of the predictors to distinguish each of the 3 groups (cHCC, pHCC, or iLC) from the others was calculated by considering specificity and accuracy using the area under the curve (AUC) and receiver operating characteristic (ROC) curves 30 by logistic regression analysis using the presence of each event. Single or multiple indicators integrated using propensity scoring were calculated as predictors and used as covariates. Two covariates were used, which represented 1/10 of the group's minimum number of cases. 31 Covariates with correlation coefficients greater than 0.8 between factors were considered in the analysis as one factor or as one factor by propensity scoring 2 factors and condensing them to avoid multicollinearity. The pLR and optimal AUC were determined from the sensitivity, specificity, and odds ratio (OR) at the cut-off points to maximize sensitivity and specificity, as estimated by Youden's index. 32 Moreover, an AUC of 0.8 or higher was considered high discriminatory power. Comparisons of the discriminative power for the prediction accuracy of the 3 groups were performed using the differences in AUC, net reclassification improvement (NRI), 33 and integrated discrimination improvement (IDI). 34 The discriminative of positive and negative was based on a comparison of the distribution of propensity scores for each group using kernel density estimation. 35 From discriminant analysis using the linear discriminant method, conventional tumor markers such as AFP, DCP, and propensity score attributed to integrated indices were used as covariates for preliminary validation to predict classification into existing early-HCCs, nonearly-HCCs (exclude early-HCCs from cHCCs), and LCs (sum of pHCCs and iLCs), and provided the canonical plot. Integrated indices with propensity scoring that achieved the highest AUC and pLR for discriminating cHCC, pHCC, and iLC, respectively, were used for validation. The 95% mean confidence ellipses and 50% contours for the classification of LC (green circles), early-HCC (red circles), and nonearly-HCC (blue circles) are shown in the plot. Test and reference standard results that are indeterminate indicators but not applicable were excluded. Missing values were deleted list-wise, but no data were missing. Multiple comparisons, correlations, logistic regression analyses, differences in AUC, and kernel density estimations were performed using JMP Pro 16 (SAS Institution, Inc., Cary, NC, USA). NRI and IDI were performed using R version 4.2.2 (R Foundation for Statistical Computing, http://www.R-project.org). Statistical significance was defined as two-sided P values of .05: * P < .05, ** P < .01, *** P < .001, and **** P < .0001.
Results
Characteristics of 3 Groups of Participants
The characteristics of the 85 patients in the 3 groups are presented in Table 1.
Characteristics of the 3 Groups of Participants.

Abbreviations: HCC, hepatocellular carcinoma; cHCC, patient of cirrhosis of the liver with current HCC which include early-HCC; pHCC, patient of cirrhosis of the liver with prior HCC; iLC, patient of intact cirrhosis of the liver. P values were determined by Kruskal-Wallis test for continuous variables and represent comparisons of cHCC, pHCC, and iLC. Data are presented as median [interquartile range].
Valuables relative to miR-103a-3p.
Significant differences in miR-146a-5p, miR-21-5p, IL-17, IL-10, IFN-γ, AFP, DCP, CPs, and Fib4 indices were observed among the 3 groups (Table 1). Descriptive data were not available.
As shown in Table 1 and Figure 2A and B, the median of miR-146a-5p in the cHCC group was significantly higher than that in the pHCC and iLC groups (0.625 vs 0.406, P < .05; and 0.625 vs 0.407, P < .05, respectively), and the median of miR-21-5p in the cHCC group was significantly higher than that in the iLC group (0.489 vs 0.284, P < .01). As shown in Figure 2C and D, there were no significant between-group differences in the expression of the other miRNAs (Table 1).

Comparisons of each indicator among the 3 groups of cirrhosis of the liver.
The median IL-17 level in the iLC group was significantly lower than that in the cHCC and pHCC groups (8.43 vs 13.0, P < .01 and 8.43 vs 16.4, P < .01, respectively), and there were no significant differences between IL-17 levels in the cHCC and pHCC groups. The IL-10 median in the cHCC group was higher than in the pHCC group (3.23 vs 1.34, P < .01) and the IFN-γ median in the iLC group was significantly higher than in the pHCC group (4.60 vs 0.00, P < .05; Table 1).
The median AFP was significantly higher in the cHCC group than in the pHCC and iLC groups (8.00 vs 3.00, P < .001 and 8.00 vs 4.00, P < .01, respectively), and the median of DCP was significantly higher in the cHCC group than in the pHCC and iLC groups (56.0 vs 21.0, P < .001 and 56.0 vs 20.5, P < .01, respectively; Table 1), although there was no significant difference between groups with no current HCC complications.
Since the CPs were not continuous, the values were biased toward the median, with no difference between the quartiles. The cHCC group had significantly higher median FIB-4 index values than the pHCC group (3.46 vs 2.33, P < .01; Table 1).
No significant differences were found between early-stage HCC and LC groups for any of the indices. The only significant difference between early-HCC and nonearly-HCC groups was observed for miR-21-5p, which was significantly higher in an early-HCC group than in the nonearly-HCC group (0.28 vs 0.54, P < .05; Table 1).
As shown in Figure 3, positive correlations were found between miR-21-5p, miR-146a-5p, AFP, and PVKA II (r = .526, P < .001 and r = .846, P < .001, respectively). miR-146a-5p was not correlated with other factors, whereas miR-21-5p was positively correlated with DCP, CPs, and Fib4 index (r = .302, P < .01; r = .243, P < .05; r = .230, P < .230, respectively). Analysis of the correlations between each indicator showed that the correlation coefficient between AFP and DCP was greater than 0.8, suggesting multicollinearity between the 2 factors. Therefore, they could not be used as independent covariates in the logistic analysis. Hence, in this study, AFP, DCP, or an integrated predictor with propensity score (AFP−DCP) was used as the independent variable in the logistic regression analysis of the ROC curves and AUC analysis.

Correlations between the indices of patients (n = 85). R values were evaluated using Pearson or Spearman correlation coefficients, as appropriate. * P < .05, ** P < .01, *** P < .001.
cHCC Discrimination
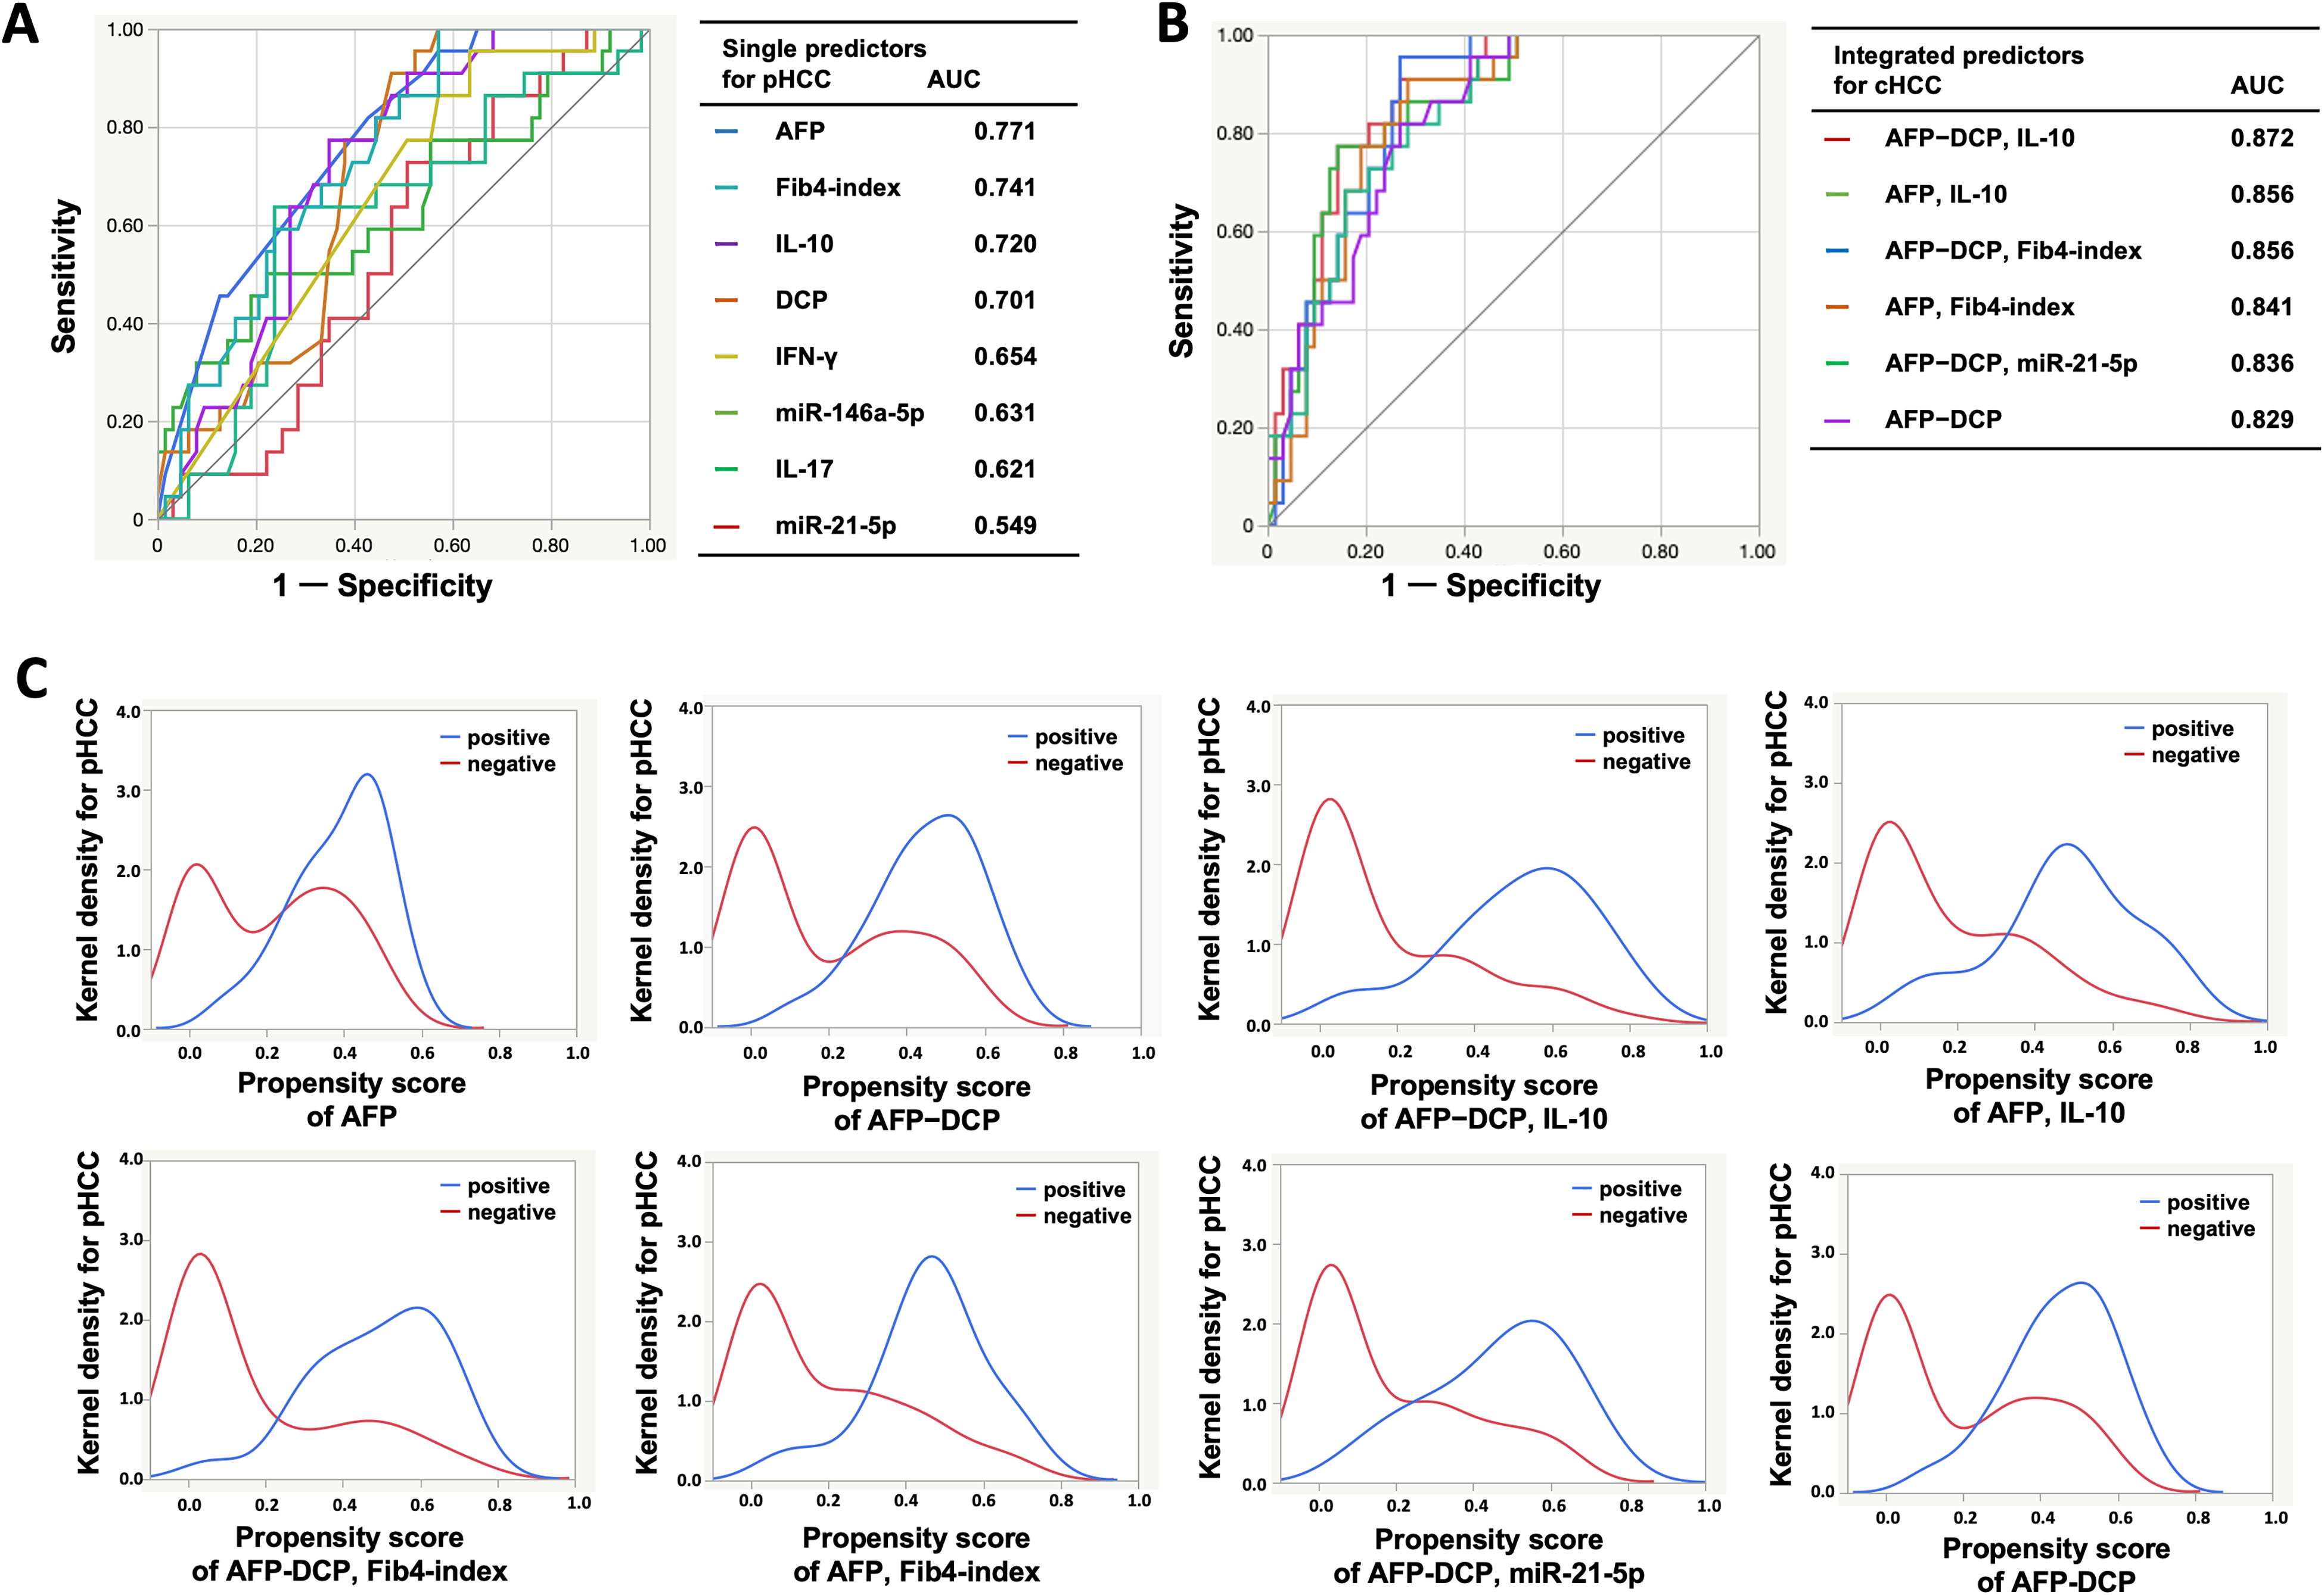
Individual AUCs for distinguishing between the cHCC group and others attributed to single predictors are shown in Table 2 and Figure 4A. Among the single predictors, the optimal AUC of AFP showed the highest value of 0.794 (95% CI: 0.682-0.874). However, its discriminative power was insufficient, as it was less than 0.8. An optimal cutoff point of 9 ng/mL had a sensitivity of 48.8% and a specificity of 97.6%; if the cutoff point was set at 20 ng/mL, the sensitivity and specificity were 37.2% and 100%, respectively.

The ability of predictors to discriminate cHCC among other LCs.
AUCs for Distinguishing Each of Liver Cirrhosis Groups Attributed to Single Predictors.
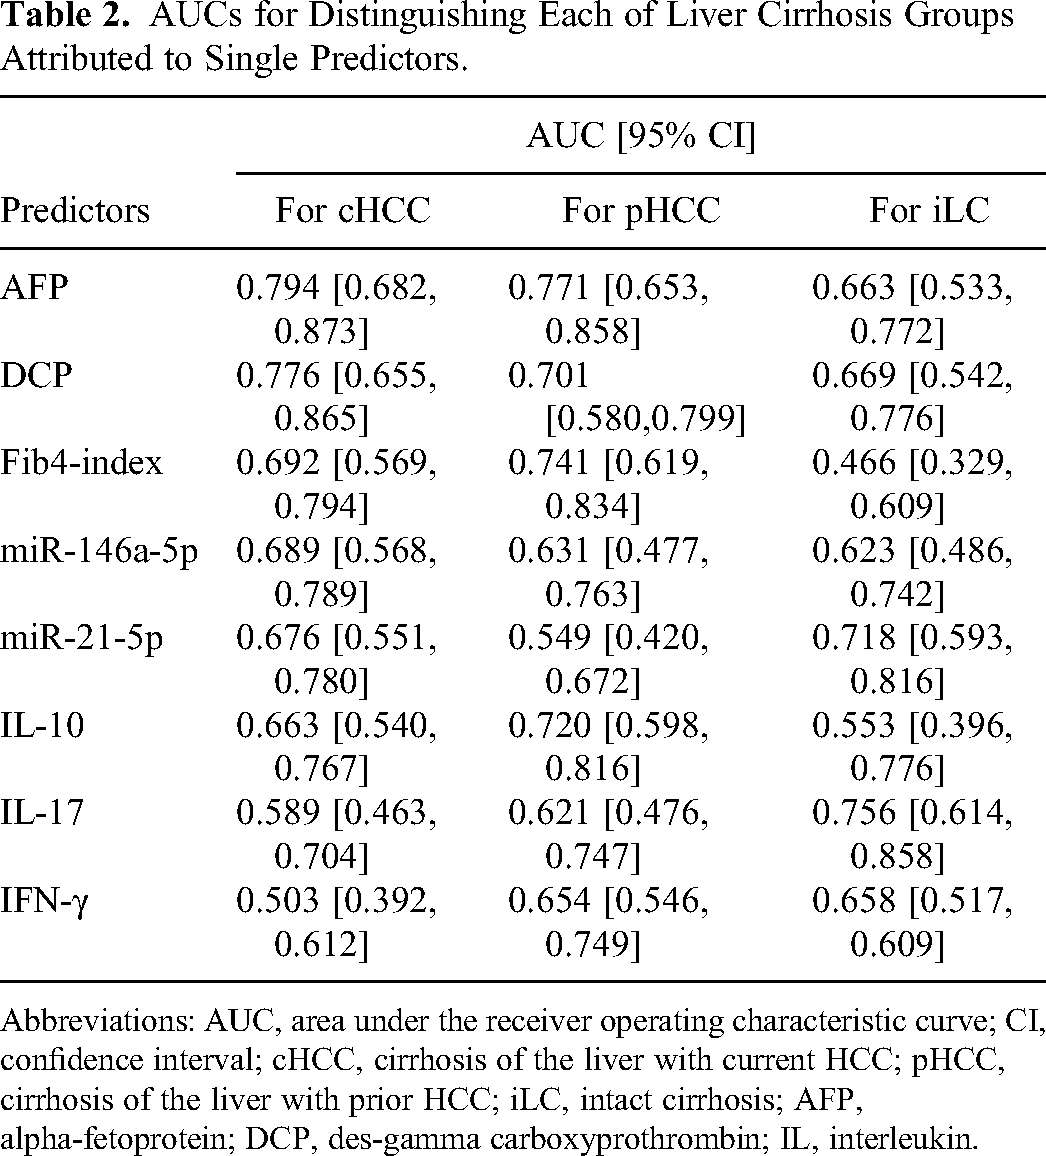
Abbreviations: AUC, area under the receiver operating characteristic curve; CI, confidence interval; cHCC, cirrhosis of the liver with current HCC; pHCC, cirrhosis of the liver with prior HCC; iLC, intact cirrhosis; AFP, alpha-fetoprotein; DCP, des-gamma carboxyprothrombin; IL, interleukin.
As shown in Table 3 and Figure 4B, propensity score analysis revealed 4 significant and highly discriminative sets, including the integration of AFP, DCP, IL-17, and miR-21-5p as predictor components, with an AUC of 0.9. The OR for the integrated predictors ranged from 41.4 to 135.3, higher than 23 for those of AFP alone. Among the integrated predictors, the AUC of AFP−DCP integrated with IL-17 was the highest at 0.935 (95% CI: 0.869-0.969). The pLR for the integrated predictors was greater than 5, and that of AFP−DCP integrated with miR-21-5p was the highest at 32.2. The likelihood-ratio test showed no significant involvement of miR-146a-5p and Fib4-index among the integrated predictors.
AUCs, pLR, and OR for Distinguishing Each of the Liver Cirrhosis Groups Attributed to Integrated Predictors by Propensity Scoring.

Abbreviations: AUC, area under the receiver operating characteristic curve; pLR, positive likelihood ratio; OR, odds ratio; ND, not determined; cHCC, liver cirrhosis with current HCC; pHCC, liver cirrhosis with prior HCC; iLC, intact liver cirrhosis. AFP−DCP was a propensity score predictor for both; AFP, alpha-fetoprotein; DCP, des-gamma carboxyprothrombin; IL, interleukin.
P value of goodness of fit of the estimated model: **** P < .0001; P value for likelihood ratio test for effect of each of predictors: † P < .05, †† P < .01, ††† P < .001, †††† P < .0001.
Kernel density estimation showed that AFP alone lacked discriminatory power for positive and negative results. The set of AFP−DCP, IL-17 integrated with AFP−DCP, or AFP−DCP integrated with miR-21-5p showed reduced false-negatives with an increased propensity score for positives, decreased overlapping distributions for probability density, and improved discriminatory power (Figure 4C).
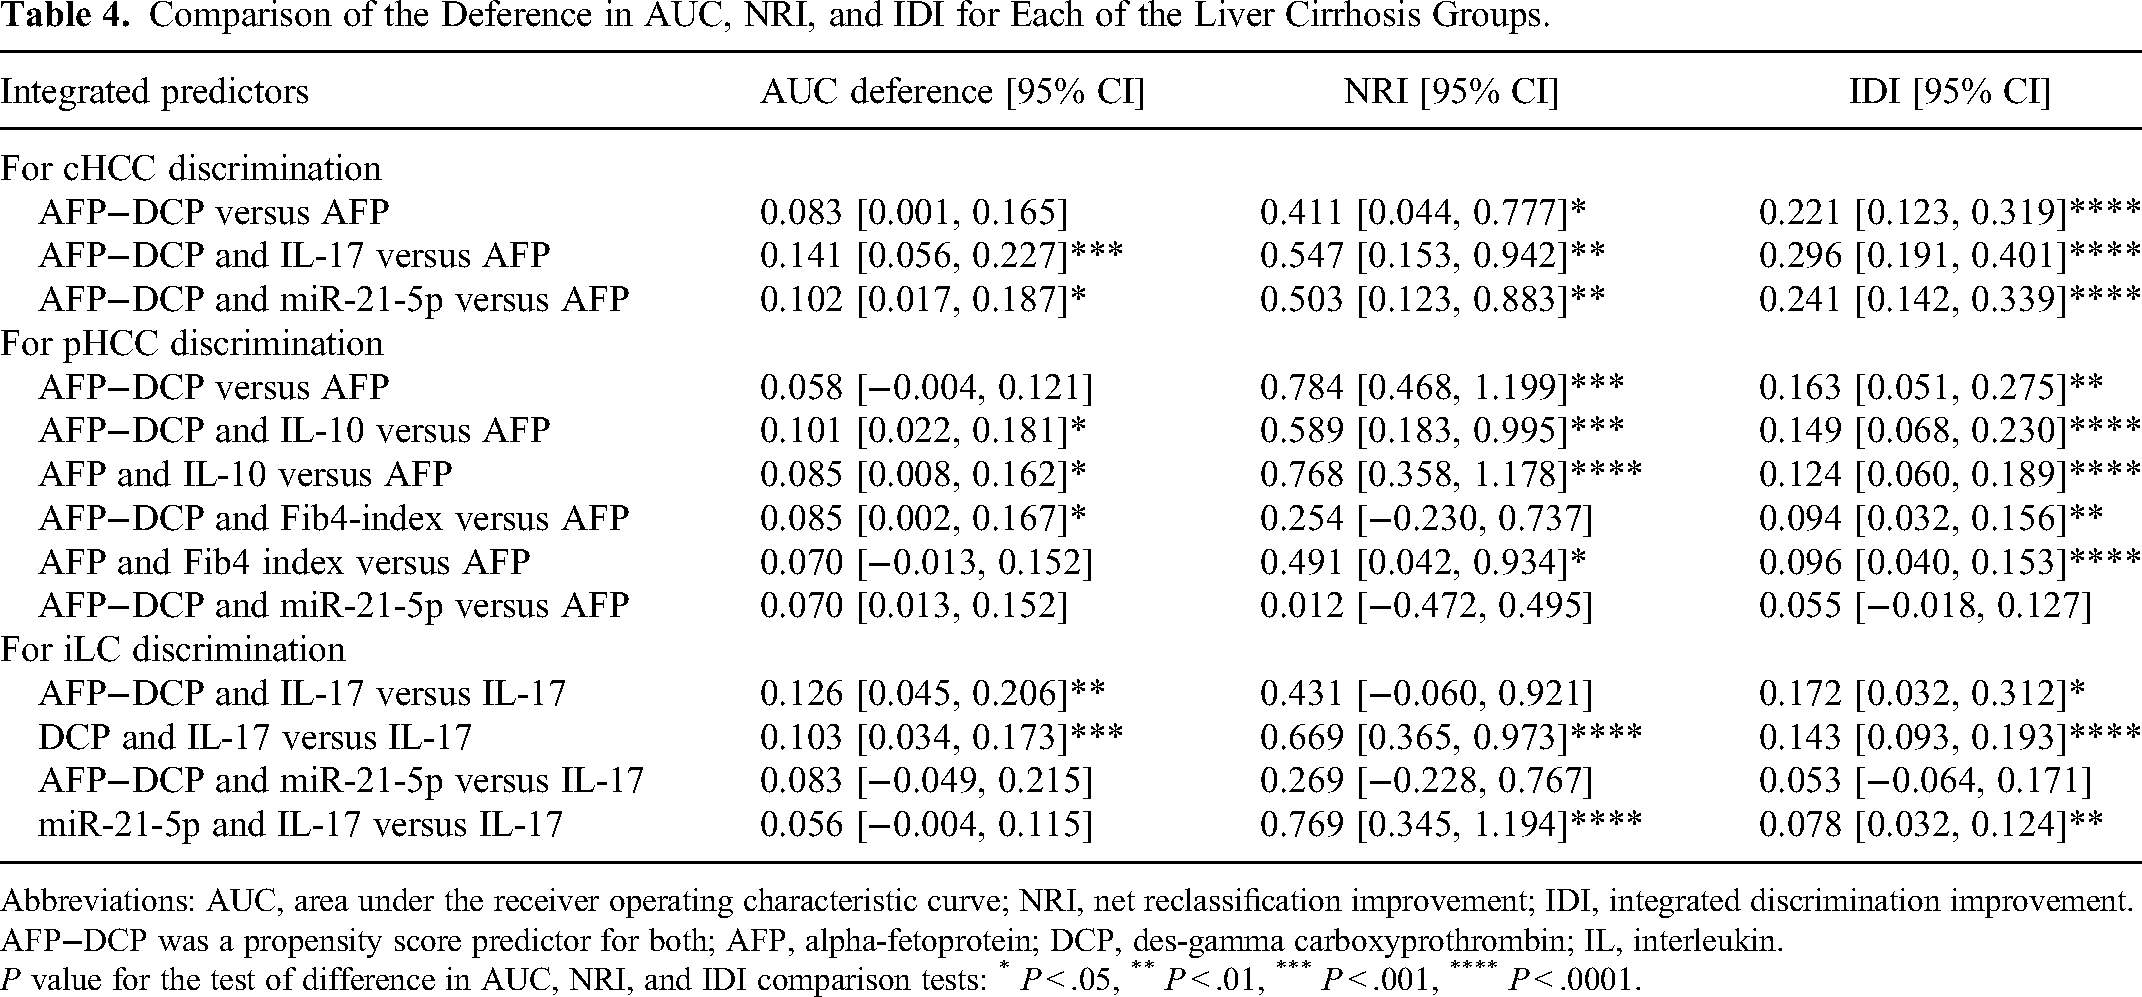
Compared to AFP, which is the best single predictor of cHCC, AFP−DCP integrated with IL-17 or miR-21-5p showed significantly better discrimination in terms of differences in AUC, NRI, and IDI (P < .001, P < .01, and P < .0001 for AFP−DCP with IL-17; P < .05, P < .01, and P < .0001 for AFP−DCP with miR-21-5p, respectively) (Table 4). Furthermore, the integrated set, in which significant differences compared to AFP in the NRI and IDI were obtained, showed a significant risk of cHCC reclassification from classification using AFP alone, depending on the estimates attributed to the integrated set (Supplemental Table 1).
Comparison of the Deference in AUC, NRI, and IDI for Each of the Liver Cirrhosis Groups.
Abbreviations: AUC, area under the receiver operating characteristic curve; NRI, net reclassification improvement; IDI, integrated discrimination improvement. AFP−DCP was a propensity score predictor for both; AFP, alpha-fetoprotein; DCP, des-gamma carboxyprothrombin; IL, interleukin.
P value for the test of difference in AUC, NRI, and IDI comparison tests: * P < .05, ** P < .01, *** P < .001, **** P < .0001.
pHCC Discrimination
Individual AUCs for distinguishing between the pHCC group and the others attributed to single predictors are presented in Table 2 and Figure 5A. Among the single predictors, the AUC of AFP showed the highest value of 0.771 (95% CI: 0.653-0.858), an optimal cutoff point of 4 ng/mL with a sensitivity of 81.8% and specificity of 57.1%; however, its discriminatory power was insufficient, as it was < 0.8.
The ability of predictors to discriminate pHCC among other LCs.
As presented in Table 3 and Figure 5B, propensity score analysis revealed 6 significant and highly discriminative sets, including integrations of AFP, DCP, IL-10, Fib4 index, and miR-21-5p as predictor components, with an AUC > 0.83. Among the integrated predictors, the AUC of AFP−DCP combined with IL-10 was the highest at 0.872 (95% CI: 0.886-0.931). The OR for the individual integrated predictors ranged from 11.3 to 56.8, higher than 6 for those of AFP alone. The pLR of the integrated predictors was <5. The likelihood ratio test showed no significant involvement of miR-146a-5p in the integrated predictors.
Kernel density estimation showed that AFP alone lacked discriminatory power for positive and negative results. Although the AFP−DCP set integrated with the IL-10 or Fib4 index or miR-21-5p, AFP integrated with the IL-10 or Fib4 index showed reduced false-positive results with a decreased propensity score of negatives and decreased overlapping distributions for probability density, improving their discriminatory power (Figure 5C).
Compared with AFP, which is the best single predictor for pHCCs, IL-10 integrated with AFP−DCP or AFP provided significantly better discrimination based on the differences in AUC, NRI, and IDI (P < .05, P < .001, and P < .0001 for AFP−DCP with IL-10; P < .05, P < .0001, and P < .0001 for AFP with IL-10, respectively). AFP−DCP integrated with the Fib4 index provided significantly better discrimination based on the differences in AUC and IDI (P < .05 and P < .01, respectively). AFP integrated with the Fib4 index and AFP−DCP showed significantly better discrimination in NRI and IDI (P < .05 and P < .0001 for AFP with the Fib4 index; P < .001 and P < .01 for AFP−DCP). No significant differences were observed in miR-21-5p integrated with AFP−DCP compared to AFP for the 3 evaluation criteria (Table 4). Furthermore, the integrated set, in which significant differences compared to AFP in the NRI and IDI were obtained, showed a significant risk of pHCC reclassification from classification using AFP alone, depending on the estimates attributed to the integrated set (Supplemental Table 2).
iLC Discrimination
Individual AUCs for distinguishing between the iLC and other groups attributed to single predictors are presented in Table 2 and Figure 6A. Among the single predictors, the AUC of IL-17 was the highest at 0.756 (95% CI: 0.614-0.858), with an optimal cut-off point of 8.6 ng/mL, a sensitivity of 55.0%, and a specificity of 89.2%, but < 0.8, resulting in poor discrimination.

The ability of predictors to discriminate iLC among other LCs.
As shown in Table 3 and Figure 6B, propensity score analysis revealed 6 significantly highly discriminative sets, including integrations of AFP, DCP, IL-17, and miR-21-5p as predictor components, with an AUC > 0.81. Among the integrated predictors, the AUC of AFP−DCP integrated with IL-17 was the highest at 0.882 (95% CI: 0.784-0.939). The OR for the individual integrated predictors ranged from 13.7 to 53.6, higher than 10 for those of IL-17 alone. The pLR of the integrated predictors was < 5. The likelihood ratio showed no significant involvement of miR-146a-5p in the integrated predictors.
Kernel density estimation showed that no single predictor had sufficient discriminatory power between positive and negative results. Although the set of IL-17 integrated with AFP−DCP, DCP, or AFP and miR-21-5p integrated with IL-17 or AFP−DCP showed increased propensity score of positive group and slightly decreased overlapping distributions for probability density, it improved each set discriminatory powers. Among the combinations, only the set integrating AFP−DCP and miR-21-5p increased, despite the overall lower peak kernel density in the positive group (Figure 6C).
Compared with IL17 (Table 4), which was the best single predictor for iLC, IL-17 integrated with DCP provided significantly better discrimination based on the differences in AUC, NRI, and IDI (P < .001, P < .0001, and P < .0001, respectively). The set of miR-21-5p that integrated with IL-17, but not with AFP−DCP, showed significantly better discrimination between NRI and IDI (P < .0001 and P < .01, respectively). This is consistent with the observation that miR-21-5p induced significant reclassification more frequently in combination with IL-17 than with AFP−DCP (Supplemental Material). The integrated set, in which significant differences in the NRI and IDI were obtained, showed a significant risk of LC reclassification from classification using IL-17 alone, depending on the estimates attributed to the integrated set (Supplemental Table 3).
Validation for Early-HCC and LC Groups
Conventional tumor markers and propensity score-integrated predictors were preliminary validated using discriminant analysis to predict classification into early-HCC, nonearly-HCC, and LC groups. Among the integrated predictors, the combination of AFP-DCP and individual integrated predictors, miR-21-5p for cHCC-discrimination, IL-10 for pHCC, and IL-17 for iLC was the best combination of integrations for the prediction of classification. Comparisons of the predictions by tumor markers with those by the best-integrated set of propensity scores were presented (Table 5). Moreover, the sensitivity, specificity, and pLR for discrimination of early-HCCs compared to the conventional one increased from 37.5% to 62.5%, 55.8% to 83.1%, and 0.85 to 3.70, respectively. Additionally, the sensitivity, specificity, and pLR for discrimination of LCs compared to the conventional one increased from 59.5% to 69.0, 65% to 88.4, and 1.71 to 5.94, respectively. Canonical plots of the predicted classification into early-HCC, nonearly-HCC, and LC groups attributed to conventional markers or the best combination of integrated predictors are shown. The integrated predictors provided less overlap in the distribution of the classification of LCs (green circles) and early-HCCs (red circles) than the conventional predictors (Figure 7A and B).

The canonical plots of discriminant analysis for prediction of classification into early-HCCs, nonearly-HCCs, and LCs.
Comparisons of Preliminary Predictions of Classification Early-HCC and LC by Tumor Markers and by the Best Propensity-Scored Integrated Predictors for Validation.
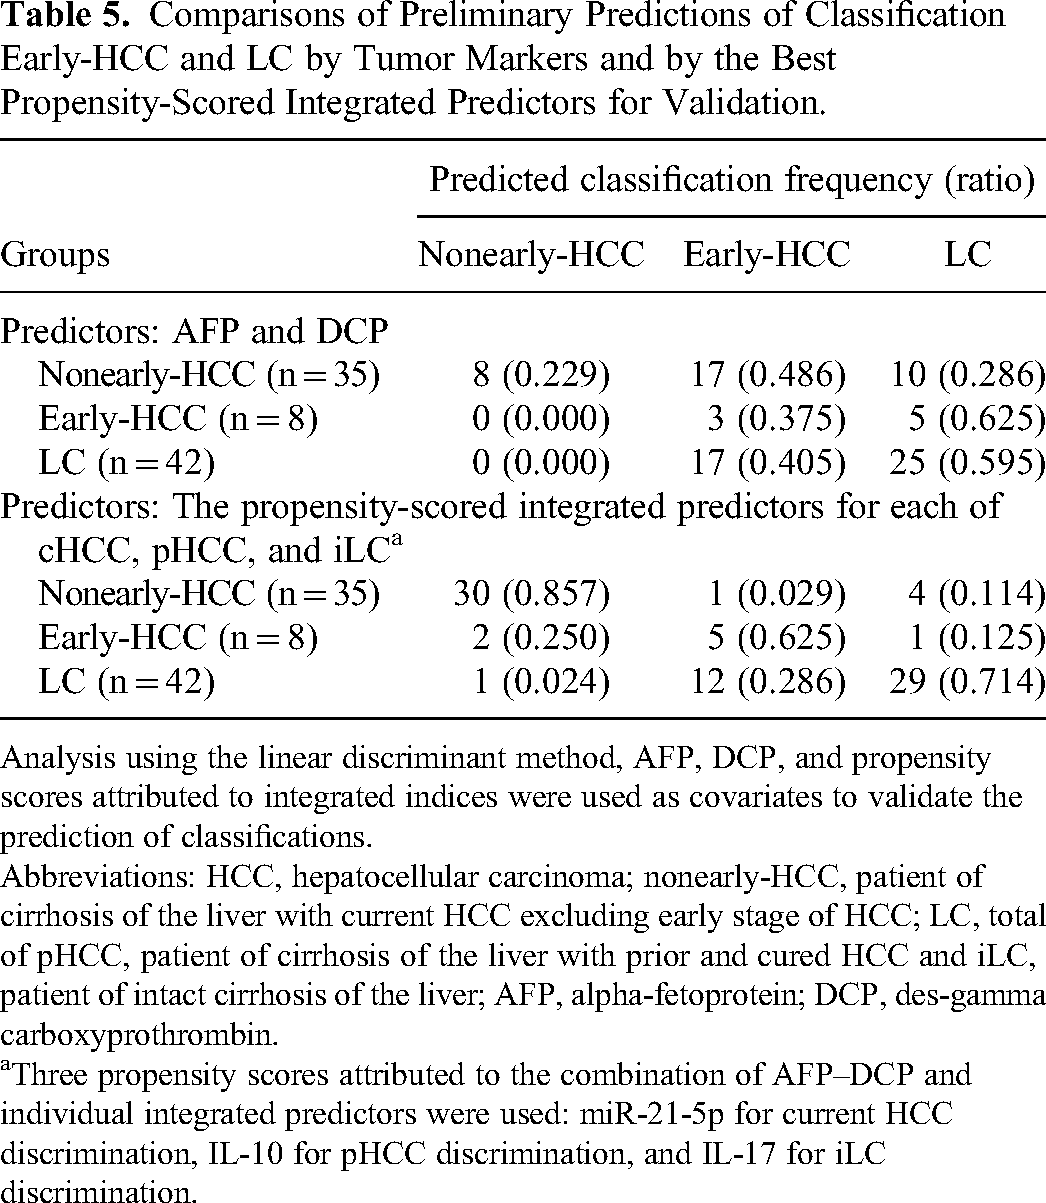
Analysis using the linear discriminant method, AFP, DCP, and propensity scores attributed to integrated indices were used as covariates to validate the prediction of classifications.
Abbreviations: HCC, hepatocellular carcinoma; nonearly-HCC, patient of cirrhosis of the liver with current HCC excluding early stage of HCC; LC, total of pHCC, patient of cirrhosis of the liver with prior and cured HCC and iLC, patient of intact cirrhosis of the liver; AFP, alpha-fetoprotein; DCP, des-gamma carboxyprothrombin.
Three propensity scores attributed to the combination of AFP–DCP and individual integrated predictors were used: miR-21-5p for current HCC discrimination, IL-10 for pHCC discrimination, and IL-17 for iLC discrimination.
Discussion
As surveillance tools for the early detection of HCCs, tumor markers provide important information for determining the presence or the absence of tumors when abdominal ultrasonography results are negative. A systematic review for the detection of early-HCCs showed general cut-off points, sensitivity, and specificity (AFP: 20 ng/mL, 49%-71% and 49%-86%; DPC: 40 ng/mL, 15%-54% and 95%-99%) for the tumor markers. 36 Surveillance with AFP alone indicates 29% to 51% false negative and 14% to 51% false positive results, while those of DPC alone indicates 46% to 85% false negative results. Furthermore, accounting for the decreased basal levels of AFP in patients with LCs after treatment with NA and DAA,11,12 the AFP cutoff point should be lowered below the general levels to reduce false negative results. However, there is a concern regarding the loss of cost-effectiveness owing to an increase in false positives due to the associated decrease in specificity. In our study, the AFP cutoff point in the optimal AUC was 9 ng/mL, which was lower than the general level, likely because the evaluated patients included those on antiviral therapy. Even with the optimally lowered cutoff points in our study, AFP and DCP alone could not provide a detailed picture of qualitative differences in HCCs, such as the presence or the absence of preexisting HCCs. Thus, AFP and DCP require simultaneous measurements to complement each other's sensitivity and specificity.9,10 However, with the conventional sensitivity-oriented method, in which a positive result is obtained when either of the tumor markers exceeds their respective cutoff points, the specificity decreases as the number of integration indicators increases, leading to a reduction in cost-effectiveness.
To avoid reducing the cost-effectiveness of surveillance, even under reduced cutoff points, a high pLR is necessary, even for the early detection of HCCs. Based on epidemiological results and a comparison of pre- and posttest ORs, a pLR of 4.75 or higher may be required to achieve a true-positive rate of approximately 10%, 37 which would be sufficient for the annual incidence of HCC in patients with cirrhotic 6 or chronic hepatitis C who have achieved SVR. 2 The current method, which integrates predictors, including tumor markers and others based on propensity scores, could increase the pLR while maintaining sensitivity and improving testing efficiency. Thus, the pLR at the optimal cutoff points of the ROC curve for each integrated predictor based on propensity scores for HCC identification was > 5, indicating that this method is clinically useful as a surveillance tool for HCC.
It was speculated that the integrated AFP−DCP contributed to the improved power of discrimination in the cHCCs and pHCCs, as it could avoid potential confounding factors and contribute to a lower false-negative rate for AFP and a lower false-positive rate for DCP. In our study, the significant usefulness of AFP-DCP was demonstrated by NRI and IDI,33,34 which compensated for the lack of testing accuracy when approximating AUCs but was not optimal for the independent discrimination of cHCCs and pHCCs.
Furthermore, an improvement in the discrimination power was noted when additional specificities for discriminating between groups were integrated into the tumor markers. In particular, the discriminatory power attributed to the integration of miR-21-5p or IL-17 into AFP−DCP as a cHCC discriminator, AFP−DCP or AFP into IL-10 as a pHCC discriminator, or DCP into IL-17 as an iLC discriminator was superior to that of each single best predictor.
In this study, the integration of IL-17 with AFP or AFP–DCP was a useful set with significantly higher discriminatory power for the cHCC and iLC groups; in contrast, the integration of IL-10 with AFP or AFP−DCP was a useful set with significantly higher discriminatory power for the pHCC group.
The inflammatory Th17 cell-derived IL-17A activates HSCs and causes and promote hepatic fibrosis, such as lesion of HCC. 24 These characteristics of IL-17 are assigned to integrated predictors and may contribute to its discriminative power, by increasing the pLR of cHCCs, and OR of iLCs, and having a positive impact on the distribution of propensity scores. On the other hand, while the use of IL-10 to differentiate cHCCs from hepatitis is considered inadequate, 26 when used in combination, an additive effect was observed in distinguishing pHCCs from pHCCs. The current reduction in IL-10 levels due to the complete healing of HCC may have contributed to the increased discriminatory power by decreasing the false-positive predictive probability of the propensity scores. Thus, IL-10 is useful for discrimination in terms of the degree of anti-inflammation and may be applicable when used in combination to distinguish early-HCCs.
Current qPCR based on miRNA-specific LNA technology 18 provides robust measurement of target miRNAs. However, this study did not demonstrate the utility of miR-122-5p and miR-320b, reported to be associated with the pathogenesis of HCC,15,21–23 and a useful overall discriminator to identify HCC. 17 Unlike miR-21-5p, the likelihood ratio for logistic regression analysis did not show the involvement of miR-146a-5p as a significant integrated predictor for cHCC-discrimination. The differences between miR-146-5p and miR-21-5p may be due to the magnitude of the contribution of the patient background to carcinogenesis and immune responses. Therefore, further studies are required in this aspect.
In this study, miR-21-5p was not a useful stand-alone biomarker, but its integration with AFP−DCP was useful with high discriminatory power against the cHCC group. Interestingly, discrimination of the iLC group showed that miR-21-5p integrated with IL-17 was a useful biomarker with high discriminatory power in NRIs and IDIs, but not in AUC, compared to the single best indicator. Thus, compared to classification by the single best indicator, a greater proportion of patients were reclassified into a new risk category based on decreased false negatives and increased positive results, considering NRI comparisons. 33 These indicated that the attribution of miR-21-5p with equal weighting may have been suggested by the IDI comparisons. 34 Certainly, as indicated by the kernel density estimation. The results should be interpreted with caution due to the false negatives involved; however, the importance of miR-21-5p integrated with IL-17 in discriminating the iLC group should not be ruled out, even though the AUC was not optimal.
There are 612 target genes of miR-21-5p in breast cancer, 38 indicating the importance of miR-21-5p as a hub of miRNAs-mRNA regulatory network also in HCC, 21 and a marker for liquid biopsy for HCC. 15 HCC-derived miR-21, contributes to tumor progression by converting HSCs into cancer-associated fibroblasts by suppression of PTEN, fostering an inflammatory microenvironment, and promoting tumor invasion through angiogenesis and. They also regulate IL-17-producing cells. 21 Therefore, it is speculated that the physiological contributions, including the immune response of miR-21-5p to the integrated predictors, have improved the discriminatory power of the cHCC and iLC groups, respectively. miR-21-5p is involved in immune responses, including modulation of regulatory T cell/effector T cell balance of CD4+ T cells in gastric cancer. 39 One activates the major targets of miR-21-5p in inflammation is STAT3, which is constantly upregulated in all solid tumors. 40 STAT3 directly activates the transcription of miR-21, while miR-21-5p represses STAT3 and contributes to negative-feedback regulation. 41 The persistence of inflammation is indicated by the increase in IL-17, which induces serine/threonine kinase-dependent IL-6/Janus kinase2/STAT3 activation and tumor progression in HCCs. 42 In this study, the current increase in IL-17 in cHCC indicates chronic inflammation with sustained enhancement of the STAT3 pathway. Under such chronic inflammation, HCC-derived miR-21-5p may be insufficient for the negative-feedback regulation of STAT3, resulting in HCC progression. Furthermore, miR-21-5p was significantly increased in more severe HCCs compared to early-stage HCCs, even though the number of early-HCCs was limited. Therefore, HCC-derived miR-21-5p may affect the severity of HCC as well as miR-221, 43 which is known to be associated with tumor stage but was not evaluated in this study. Thus, one possible physiological background for the present results is that the IL-17 and miR-21-5p indices were higher in patients with cHCC than in those with iLC, and the integration of each index into AFP–DCP increased the discriminatory power of cHCCs, which is due to the contribution of inflammatory immune responses.
This study provided the minimum number of samples required for logistic analysis. Thus, discriminant analysis was performed to validate, albeit preliminary, the prediction of early-HCCs and LCs using the current integrated predictors. Validation analysis showed that the prediction set of AFP-DCP combined with iR-21-5p, IL-10, and IL-17 by propensity scoring, which achieved high AUC and pLR in discriminating cHCCs, pHCCs, and iLCs, respectively, improved the prediction of classification into early-HCC and LC groups compared with conventional methods using AFP and DCP. The poor classification of the conventional method may be due to the lower AFP and DCP levels attributed to postantiviral treatment. This is consistent with the current observations of the canonical plot predictions showing that AFP and DCP alone are difficult to distinguish between early-HCC and LC groups due to overlapping classification distributions. While there was still some overlap, the separation of distributions for the classification of early-HCCs and LCs using the 3 integrated indices improved over the previous method. Additionally, the sensitivity, specificity, and pLR of the classifications also improved. The increase in pLR, an indicator unaffected by the number of cases, might be a beneficial result. Therefore, this study has clinical significance as a pilot study because it suggests the possibility of reducing the misclassification of early-HCC and LC, which is a current problem in LC surveillance.
A limitation of this study is that miRNA expression in the liver tissue was not evaluated to avoid patient invasiveness. In addition, this pilot study was conducted with only the minimum number of cases required for the current logistic analysis 31 and no stratification or matching by individual etiology and no robust validation for the classification of early-HCCs and LCs were performed. Therefore, future studies are required to verify this.
Conclusion
Tumor markers alone are insufficient to discriminate early-HCCs from LCs, during the recent advances in treatment methods for LCs. The integrated sets combining AFP–DCP with miR-21-5p, IL-10, and IL-17 by propensity scoring achieved higher AUC and pLR in discriminating cHCCs, pHCCs, and iLCs, improved discriminatory power to identify qualitative changes in LCs over conventional methods. Although preliminary, validation analysis indicates that such an integrated set of discriminative predictors improves the prediction of classification into early-HCCs and LCs compared to conventional methods using tumor markers. As a pilot study, the current set of predictors, including post-antiviral therapy patients with reduced tumor marker values, may facilitate the early detection of HCCs in surveillance. Although further validation is required, this pilot study is a milestone in the future.
Supplemental Material
sj-docx-1-tct-10.1177_15330338231212084 - Supplemental material for Integrated Predictors by Propensity Scoring With Tumor Markers and Plasma Levels of microRNA-21-5p, IL-17, and IL-10 Complement Early Detection of Hepatocellular Carcinoma in Patients With Liver Cirrhosis
Supplemental material, sj-docx-1-tct-10.1177_15330338231212084 for Integrated Predictors by Propensity Scoring With Tumor Markers and Plasma Levels of microRNA-21-5p, IL-17, and IL-10 Complement Early Detection of Hepatocellular Carcinoma in Patients With Liver Cirrhosis by Maiko Machida, PhD, Mayuko Ambo, Runa Mishina, Nanaka Hada, Fuhito Tachibana, Miki Yamashita, PhD, Ainari Konda, PhD, and Kunihiko Tsuji, MD, PhD in Technology in Cancer Research & Treatment
Footnotes
Acknowledgments
We thank the staff of Teine Keijinkai Hospital, Chihiro Watanabe, Keisuke Sugawara, Takeshi Takeich and Dr Jun Miura of Sapporo Hanazono Hospital.
Declaration of Conflicting Interests
The author(s) declared no potential conflicts of interest with respect to the research, authorship, and/or publication of this article.
Funding
The author(s) disclosed receipt of the following financial support for the research, authorship, and/or publication of this article: This work was supported by research grants from Hokkaido University of Science grants for 2021-37, and partly supported by the Japan Society for the Promotion of Science Grants-Aid for Scientific Research (Grants number: 21K06648).
Ethics Approval
This study is a joint research between the Hokkaido University of Science and Teine Keijinkai Hospital Center of Gastroenterology. Ethics approval to conduct the study was obtained from Teine Keijinkai Hospital (No. 2-021242-00, accepted on September 14, 2021) and the Hokkaido University of Science (No. 21-17, accepted on September 08, 2021), registered as “Liquid biopsy using microRNAs for early detection of liver fibrosis progression and hepatocellular carcinoma” in UMIN000049394, on November 01, 2022, ![]() .
.
Supplemental Material
Supplemental material for this article is available online.
Abbreviations
References
Supplementary Material
Please find the following supplemental material available below.
For Open Access articles published under a Creative Commons License, all supplemental material carries the same license as the article it is associated with.
For non-Open Access articles published, all supplemental material carries a non-exclusive license, and permission requests for re-use of supplemental material or any part of supplemental material shall be sent directly to the copyright owner as specified in the copyright notice associated with the article.