
Abstract
Keywords
Introduction
Gastrointestinal stromal tumor (GIST) is the most common mesenchymal tumor of the gastrointestinal tract, accounting for about 0.1% to 3% of gastrointestinal malignant tumors. It occurs frequently between 50 and 70 years old people, with no gender difference. 1 Gastrointestinal stromal tumor can occur in any part of the digestive tract, mainly in the stomach (55%-70%), followed by small intestine (20%-30%), colorectal (5%), and esophagus (5%).2–4 Gastrointestinal stromal tumor has a variety of biological behaviors and a potential malignant tendency, which is easy to transfer to the liver and abdominal cavity. 5 Gastrointestinal stromal tumor is mainly treated with surgery and targeted drug therapy, and its prognosis is closely related to risk grade, pathological stage, and treatment methods. 6 There are great differences in the treatment methods and prognosis of GIST with different risk grades. Patients with lower risk can be completely removed by surgery, while patients with higher risk have significantly higher recurrence rate and metastasis rate.7,8 Therefore, preoperative diagnosis and prediction of GIST risk grade are of great significance for the choice of treatment and prognosis of patients. In order to obtain pathological samples of tumor for risk grading and evaluation of the tumor before operation, a puncture biopsy is essential. However, this is an invasive method and might lead to tumor cell metastasis and tumor bleeding. Computed tomography (CT) examination, as a noninvasive examination method, has great advantages in this field. At present, many studies have shown that CT examination has a high value in predicting GIST risk classification.9–12 In this study, a simple scoring model for predicting the biological risk of GIST was constructed based on the features of enhanced CT, providing a simple and practical imaging method for the formulation of individualized clinical treatment plans.
Materials and Methods
Clinical Data
From January 2017 to December 2021, GIST patients confirmed by postoperative pathology in our hospital were retrospectively collected. This study was approved by the Ethics Committee of the Affiliated Huaian No.1 People's Hospital of Nanjing Medical University (Number: KY-2022-045-01). As a retrospective study, the patients were exempted from written informed consent. Inclusion criteria: (1) Primary GIST confirmed by postoperative pathology; (2) Enhanced CT was performed in our hospital within one week before surgery. Exclusion criteria: (1) Recurrence or metastasis of GIST; (2) Preoperative targeted therapy or other therapy; (3) Poor image quality affects image observation and data measurement. Finally, 149 GIST patients were included in this study (Figure 1).

A study flowchart shows selection of study population and exclusion criteria.
CT Protocol
Abdominal plain and enhanced scans were performed with the SIEMENS SOMATOM Definition dual-source CT scanner. The patients were fasted for 6 h before the examination and drank 600 to 1000 mL of water 40 to 60 min before the scan to fill the gastrointestinal tract. The patients were placed in the supine position, and the scanning range was from the dome of the diaphragm to the level of the pubic symphysis. The scanning parameters were as follows: tube voltage: 100 to 120 kV, tube current: 300 mA; collineation width:64 × 1.25 mm, pitch: 1.5:1, matrix:512 × 512, slice thickness: 5 mm, slice interval: 5 mm. Nonionic contrast agent iohexol or ioversol was injected via a high-pressure syringe through the cubital vein at a bolus dose of 1.5 mL/kg and an injection rate of 2.5 to 3 mL/s. Contrast-enhanced scanning was performed using a trigger scanning mode. When the triggering threshold of aorta reached 170 HU, the enhanced images of arterial phase and portal vein phase 30 s after triggering were obtained, and the scanning range was consistent with that of plain scan. After scanning, the original images were transferred to the Syngo CT 2012B imaging station for multiplanar reformation, and the reconstructed slice thickness was 5 mm to obtain the coronal and sagittal images.
Image Analysis and Data Measurement
Two radiologists (with 10 years and 5 years experiences, respectively, in abdominal imaging) independently read the images of picture archiving and communication system and does not know the related clinical and pathological results, disputed issues would be resolved by consensus. CT image features were recorded, including location, tumor size (maximum diameter), morphology, density, margin, growth pattern, enhancement pattern, necrosis and cystic, calcification, surface ulcers, intratumor gas, and enlarged vessels feeding or draining the mass (EVFDM), PELN. The growth pattern can be divided into exogenous type, endogenous type, and mixed type. On the enhanced CT images, the CT values of the tumor parenchyma were measured in plain scan, arterial stage, and portal vein stage. The region of interest was defined as 50 mm2, avoiding blood vessels, gas, and necrosis, and the final measurement was the average measured by 2 radiologists. CTN, CTAP, and CTPP were recorded on plain scan, arterial stage, and portal vein stage, respectively. Using CTN as a reference, the differences in CT values (ΔAP, ΔPP) and contrast enhancement ratio (CER) of tumors at the post-enhanced arterial and portal vein stages were calculated according to the following formula:

Pathological Evaluation
According to 2008 of the US National Institutes of Health (NIH) modified standard (M-NIH), it was divided into 4 grades: very low, low, medium, and high risk based on the comprehensive evaluation of tumor size, mitotic phase count, tumor primary site, tumor rupture, and other indicators. 13 Very low-risk group: size 2 cm or less and mitotic count 5 or less; Low-risk group: size between 2 and 5 cm and mitotic count 5 or less; Medium-risk group: (1) size 2 cm or less and mitotic count between 6 and 10; (2) size between 2 and 5 cm and mitotic count between 6 and 10 and the primary GIST at stomach; (3) size between 5 and 10 cm and mitotic count 5 or less and the primary GIST at stomach; High-risk group: (1) tumor rupture with any size or mitotic count; (2) size more than 10 cm with any mitotic count or primary location; (3) mitotic count more than 10 with any size or primary location; (4) size more than 5 and mitotic count more than 5 with any primary location; (5) size between 2 and 5 cm and mitotic count more than 5 with the primary location not at stomach; (6) size between 5 and 10 cm and mitotic count 5 or less and the primary location not at stomach. The low-risk group consists of very low risk and low risk. The high-risk group consists of medium and high risk.
Statistical Analysis
SPSS 23.0 and MedCalc software were used for statistical analysis. Continuous variables were expressed as x ± s and independent sample t test or Mann-Whitney U test were used. Categorical variables were represented by observed counts and percentages within each subgroup and Pearson χ2or Fisher exact tests were used to compare. Univariate and multivariate logistic regression models were used to determine independent predictors of high-risk biological behaviors in GIST. The multifactor logistic regression model was constructed by stepwise positive selection. With P = .05 as the test level, β coefficient, odds ratio, and 95% confidence interval (CI) were calculated, and then a simple scoring model was established according to the method proposed by Sullivan et al 14 Receiver operating characteristic curve (ROC) was used to evaluate the predictive ability of the model and calculate the area under the curve (AUC) as well as the sensitivity and specificity of the model. DeLong test was used to compare the AUC of different diagnostic indicators. P < .05 was considered statistically significant.
Results
Clinical Date
There were 149 GIST patients in this group, including 79 males and 70 females, aged from 31 to 86, with an average age of (59.93 ± 10.91) years old. Among 149 GIST patients, 104 cases were gastric stromal tumors (69.80%, 104/149), 38 cases of small intestinal stromal tumors (25.50%, 38/149), 5 cases of abdominal stromal tumor (3.36%, 5/149), and 2 cases (1.34%, 2/149) of rectal stromal tumors. Forty-five cases were in the low-risk group (30.20%, 45/149) and 104 cases were in the high-risk group (69.80%, 104/149). The results of statistical analysis showed that there was no significant difference between GIST risk classification and gender and age (P = .168, .320), but a significant difference was found between GIST risk classification and tumor size and location (P < .001).
The Efficacy of Enhanced CT Signs in Diagnosing GIST Risk Classification
Univariate analysis showed that the tumor size and location, margin, growth pattern of the tumor, whether there were ulcers on the tumor surface, EVFDM, PELN, plain CT value (CTN), arterial phase contrast enhancement rate (CERAP), and venous phase contrast enhancement rate (CERPP) were statistically significant (P < .05) (Table 1).
Univariate Analysis of the Relationship Between Enhanced CT Signs and GIST Risk Classification.a
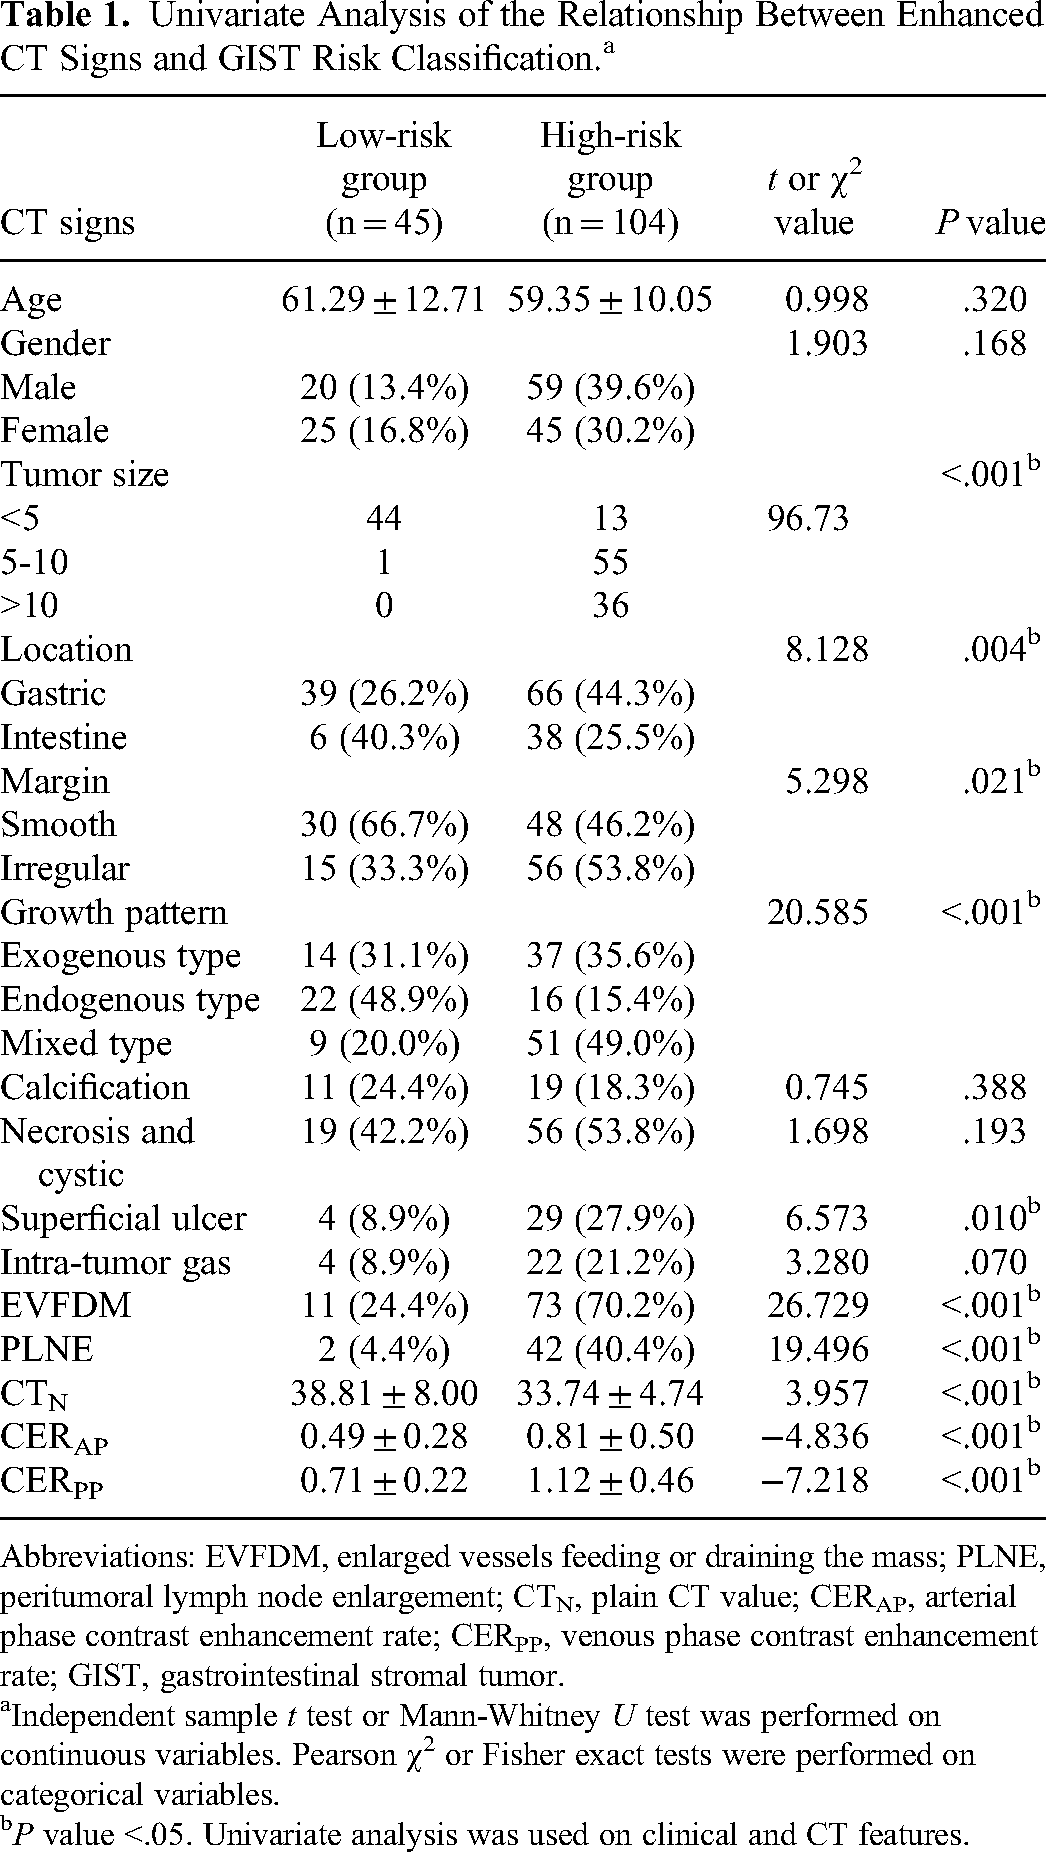
Abbreviations: EVFDM, enlarged vessels feeding or draining the mass; PLNE, peritumoral lymph node enlargement; CTN, plain CT value; CERAP, arterial phase contrast enhancement rate; CERPP, venous phase contrast enhancement rate; GIST, gastrointestinal stromal tumor.
Independent sample t test or Mann-Whitney U test was performed on continuous variables. Pearson χ2 or Fisher exact tests were performed on categorical variables.
P value <.05. Univariate analysis was used on clinical and CT features.
Construction of a Simple Scoring Model for Predicting GIST Biological Risk Based on the Signs of Enhanced CT
Variables with statistically significant differences in the above univariate analysis (tumor size, location, margin, growth pattern, superficial ulcer, EVFDM, peritumoral lymph node enlargement [PLNE], CTN, CERAP, and CERPP) were included in binary logistic regression analysis. The results showed that tumor size, EVFDM, PLNE, and CERPP were independent predictors of biological risk of GIST (P < .05) (Table 2). The AUC values of tumor size, EVFDM, PLNE, and CERPP were 0.930 (0.877-0.965), 0.729 (95% CI: 0.650-0.798), 0.680 (95% CI: 0.598-0.754), and 0.807 (95% CI: 0.735-0.867), respectively (Table 3). According to ROC curve results, when tumor size, EVFDM, PLNE were found or CERPP > 0.893, it suggested the diagnosis of high-risk GIST.
Results of Multiple Logistic Regression of Risk Predictor for GIST Patients.a

Abbreviations: EVFDM, enlarged vessels feeding or draining the mass; PLNE, peritumoral lymph node enlargement; CTN, plain CT value; CERAP, arterial phase contrast enhancement rate; CERPP, venous phase contrast enhancement rate; OR, odds ratio; GIST, gastrointestinal stromal tumor; CI, confidence interval.
Independent sample t test or Mann-Whitney U test was performed on continuous variables. Pearson χ2 or Fisher exact tests were performed on categorical variables. Multivariate logistic regression was used on clinical and CT features.
P value <.05.
Effectiveness of Independent Predictors and Simple Scoring Model in the Grading of Biological Risk of GIST.

Abbreviations: EVFDM, enlarged vessels feeding or draining the mass; PLNE, peritumoral lymph node enlargement; GIST, gastrointestinal stromal tumor; AUC, area under the curve; CI, confidence interval.
The scoring model was established according to the Logistic regression predictor, and the integral value of β coefficient was taken to establish the scoring system. When the tumor with EVFDM, PLNE, the tumor size >5 or CERPP > 0.893, the score was assigned as 1 point, otherwise the score was 0 points, and the final scores were each score added. The final score of the scoring model ranged from 0 to 4, and with the increased score, the GIST risk increased (Figures 2 and 3). Receiver operating characteristic curve results showed that the AUC of the scoring model was 0.941 (95% CI: 0.893-0.973), when the total score >1 point, the sensitivity, specificity, positive predictive value, negative predictive value, and accuracy of the scoring model in diagnosing high-risk GIST were 85.58%, 88.89%, 88.51%, 86.04%, and 86.18%, respectively (Table 3, Figure 4). Hosmer-Lemeshow test of goodness of fit showed P = .150, and the calibration curve suggested that the scoring model predicted GIST high risk and actual risk with good consistency. Compared with the ROC curve AUC of tumor size, EVFDM, PLNE, and CERPP indexes alone in predicting GIST high risk, the scoring model was better than the above indexes, and the differences were statistically significant (Z = 26.510, P < .001; Z = 3.992, P < .001; Z = 6.353, P < .001; Z = 4.052, P = .013).
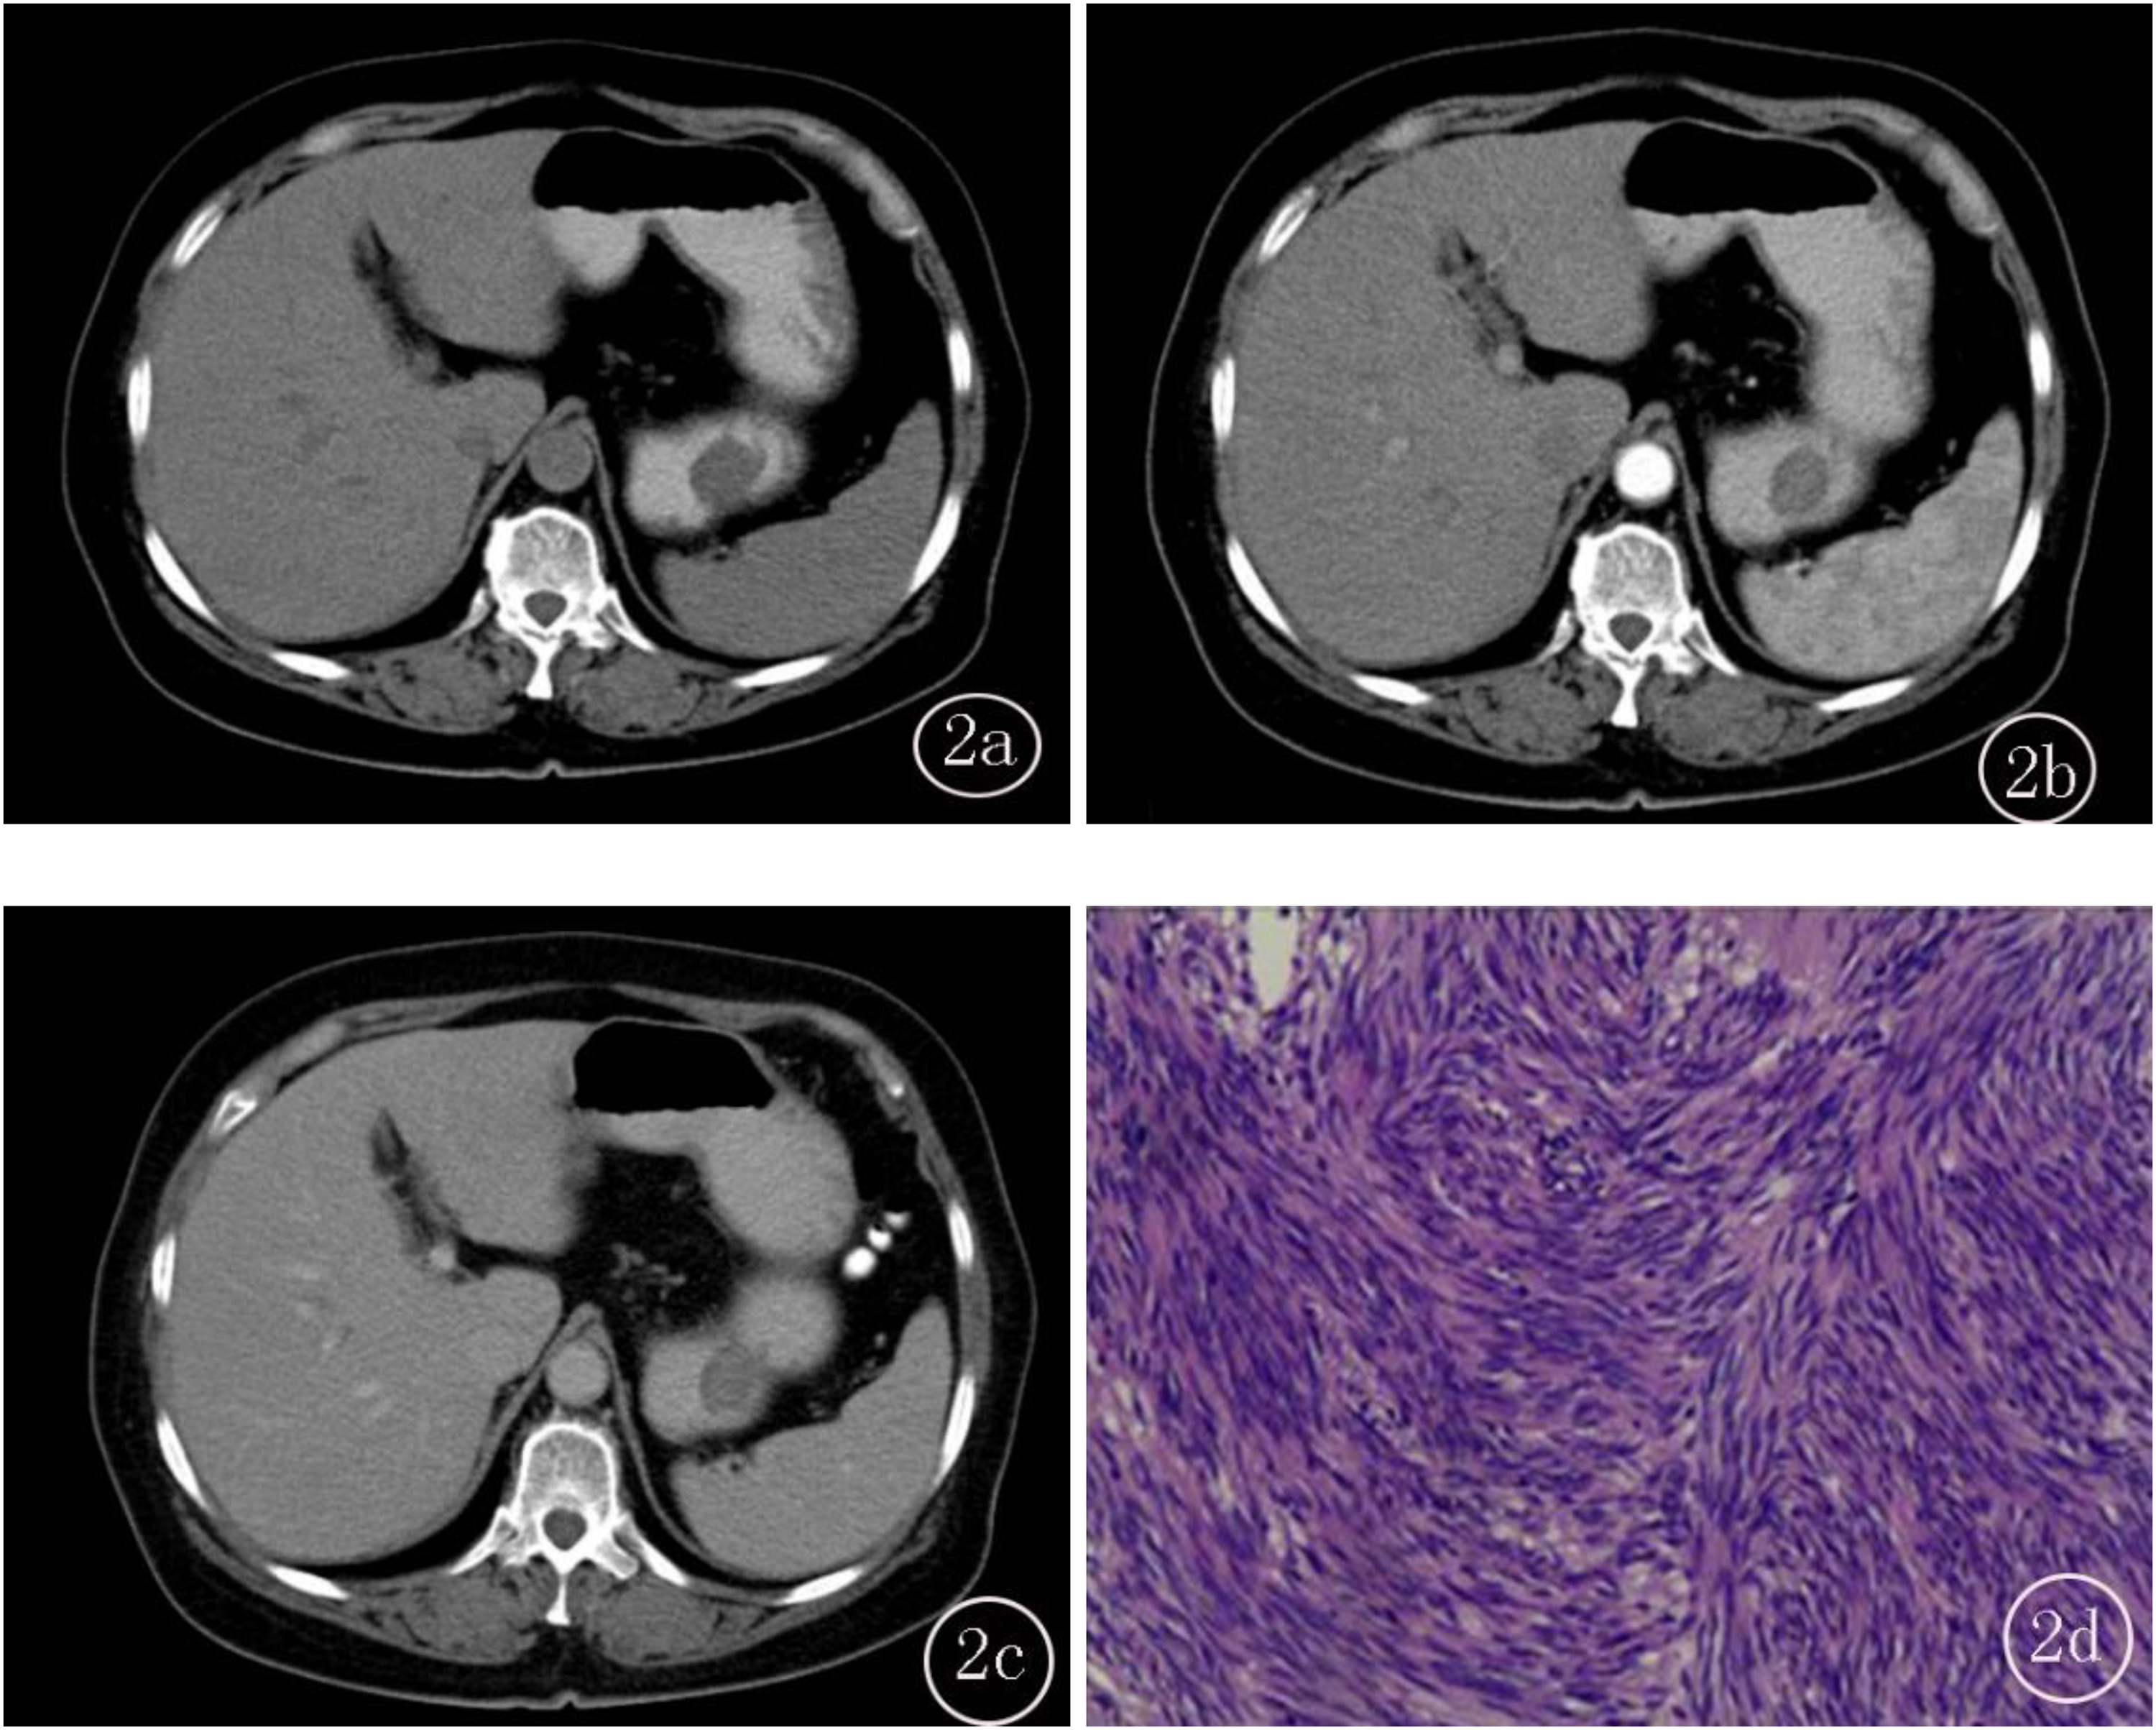
A-D, Female, 70 years old, (A) CT plain, the lesion CT value was 35.41HU, and the tumor size was about 3.5cm. The lesion was located in the greater curvature of the stomach body with smooth edges, endogenous type, no ulcers on the surface, and no gas in the tumor. (B) Homogeneous enhancement in arterial phase, CT value was about 54.34, CERAP was about 0.53, no cystic or necrosis in the lesion, no peritumoral lymph node enlargement [PLNE], and no enlarged vessels feeding or draining the mass (EVFDM). (C) Further enhancement in venous phase, CT value was about 60.34, CERPP was about 0.70, and final CT score was 0; (D) Postoperative pathology showed gastric stromal tumor (low risk).
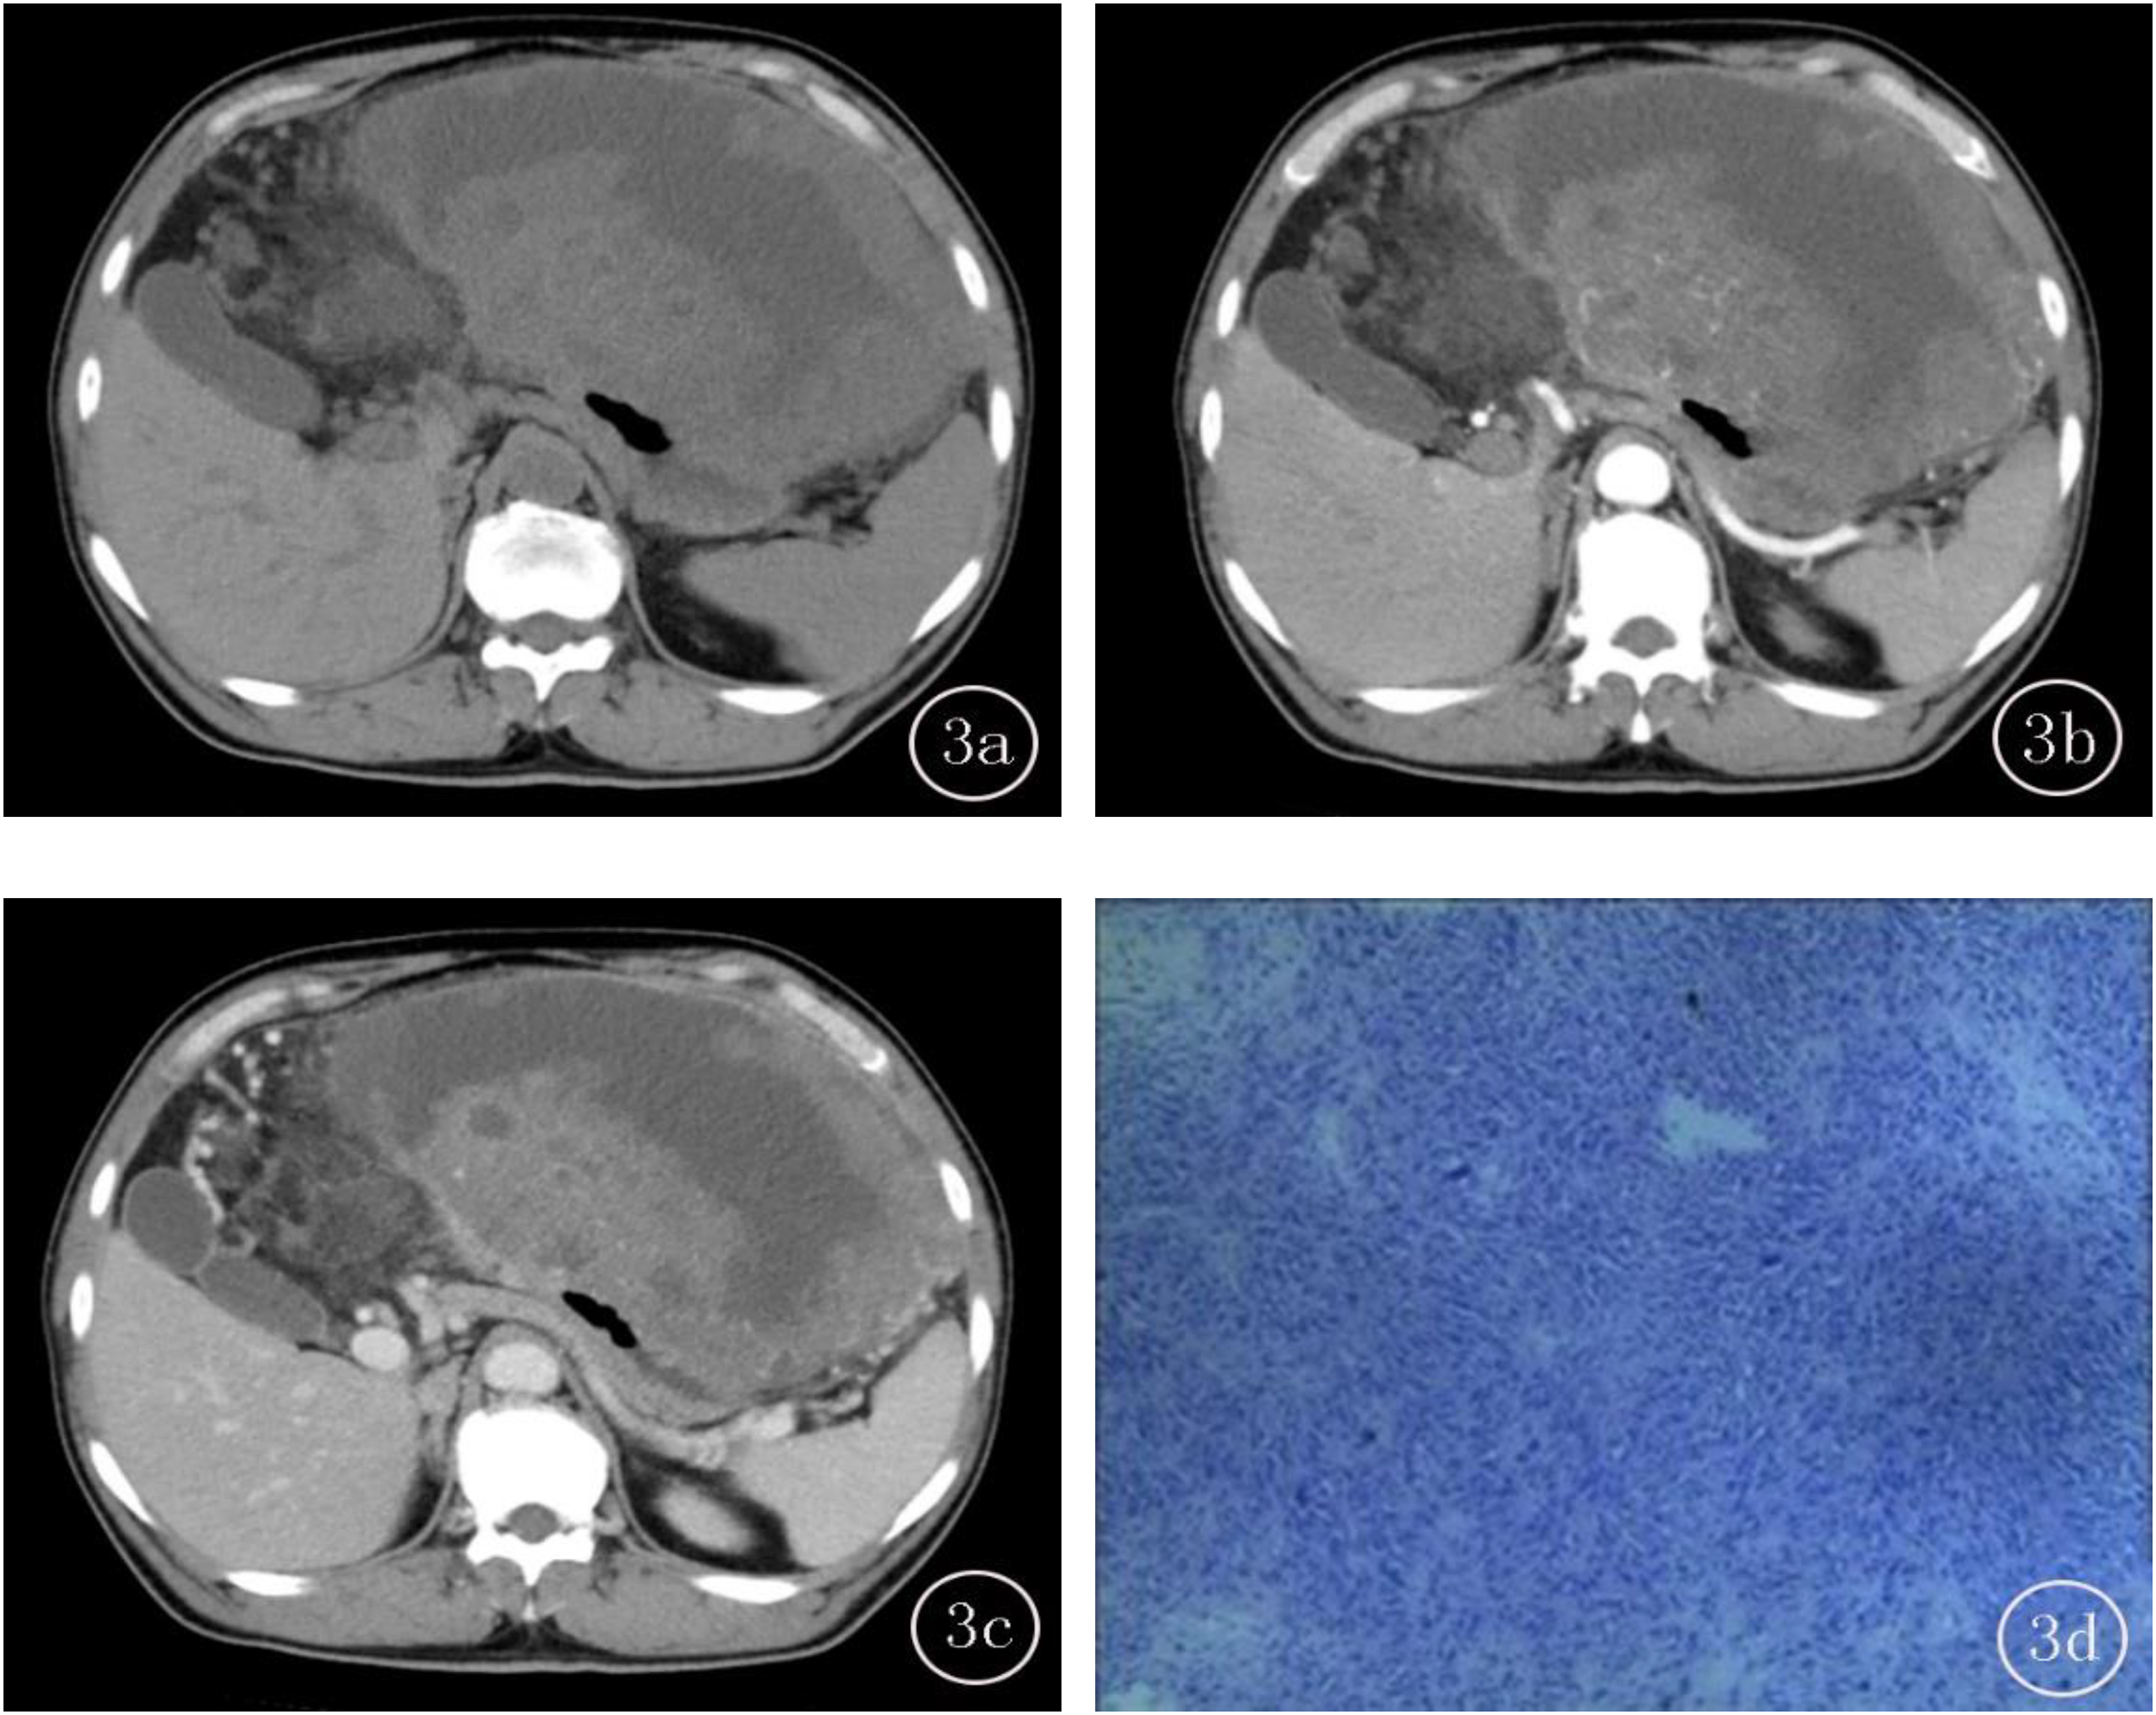
A-D, Male, 59 years old, (A) CT plain, the lesion CT value was 30.67HU, and the tumor size was about 16.5cm, the lesion was located in the gastric bottom, the edge was irregular, the mixed growth, no surface ulcer, and no gas in the tumor. (B) Uneven enhancement in arterial phase, CT value was about 48.71, CERAP was about 0.59, cyst or necrosis in the lesion, several lymph nodes were enlarged around the tumor, with obvious enlarged vessels feeding or draining the mass (EVFDM). (C) Further enhancement in venous phase, CT value was about 73.07, CERPP was about 1.38, and final CT score was 4; (D) Postoperative pathology showed gastric stromal tumor (high risk).
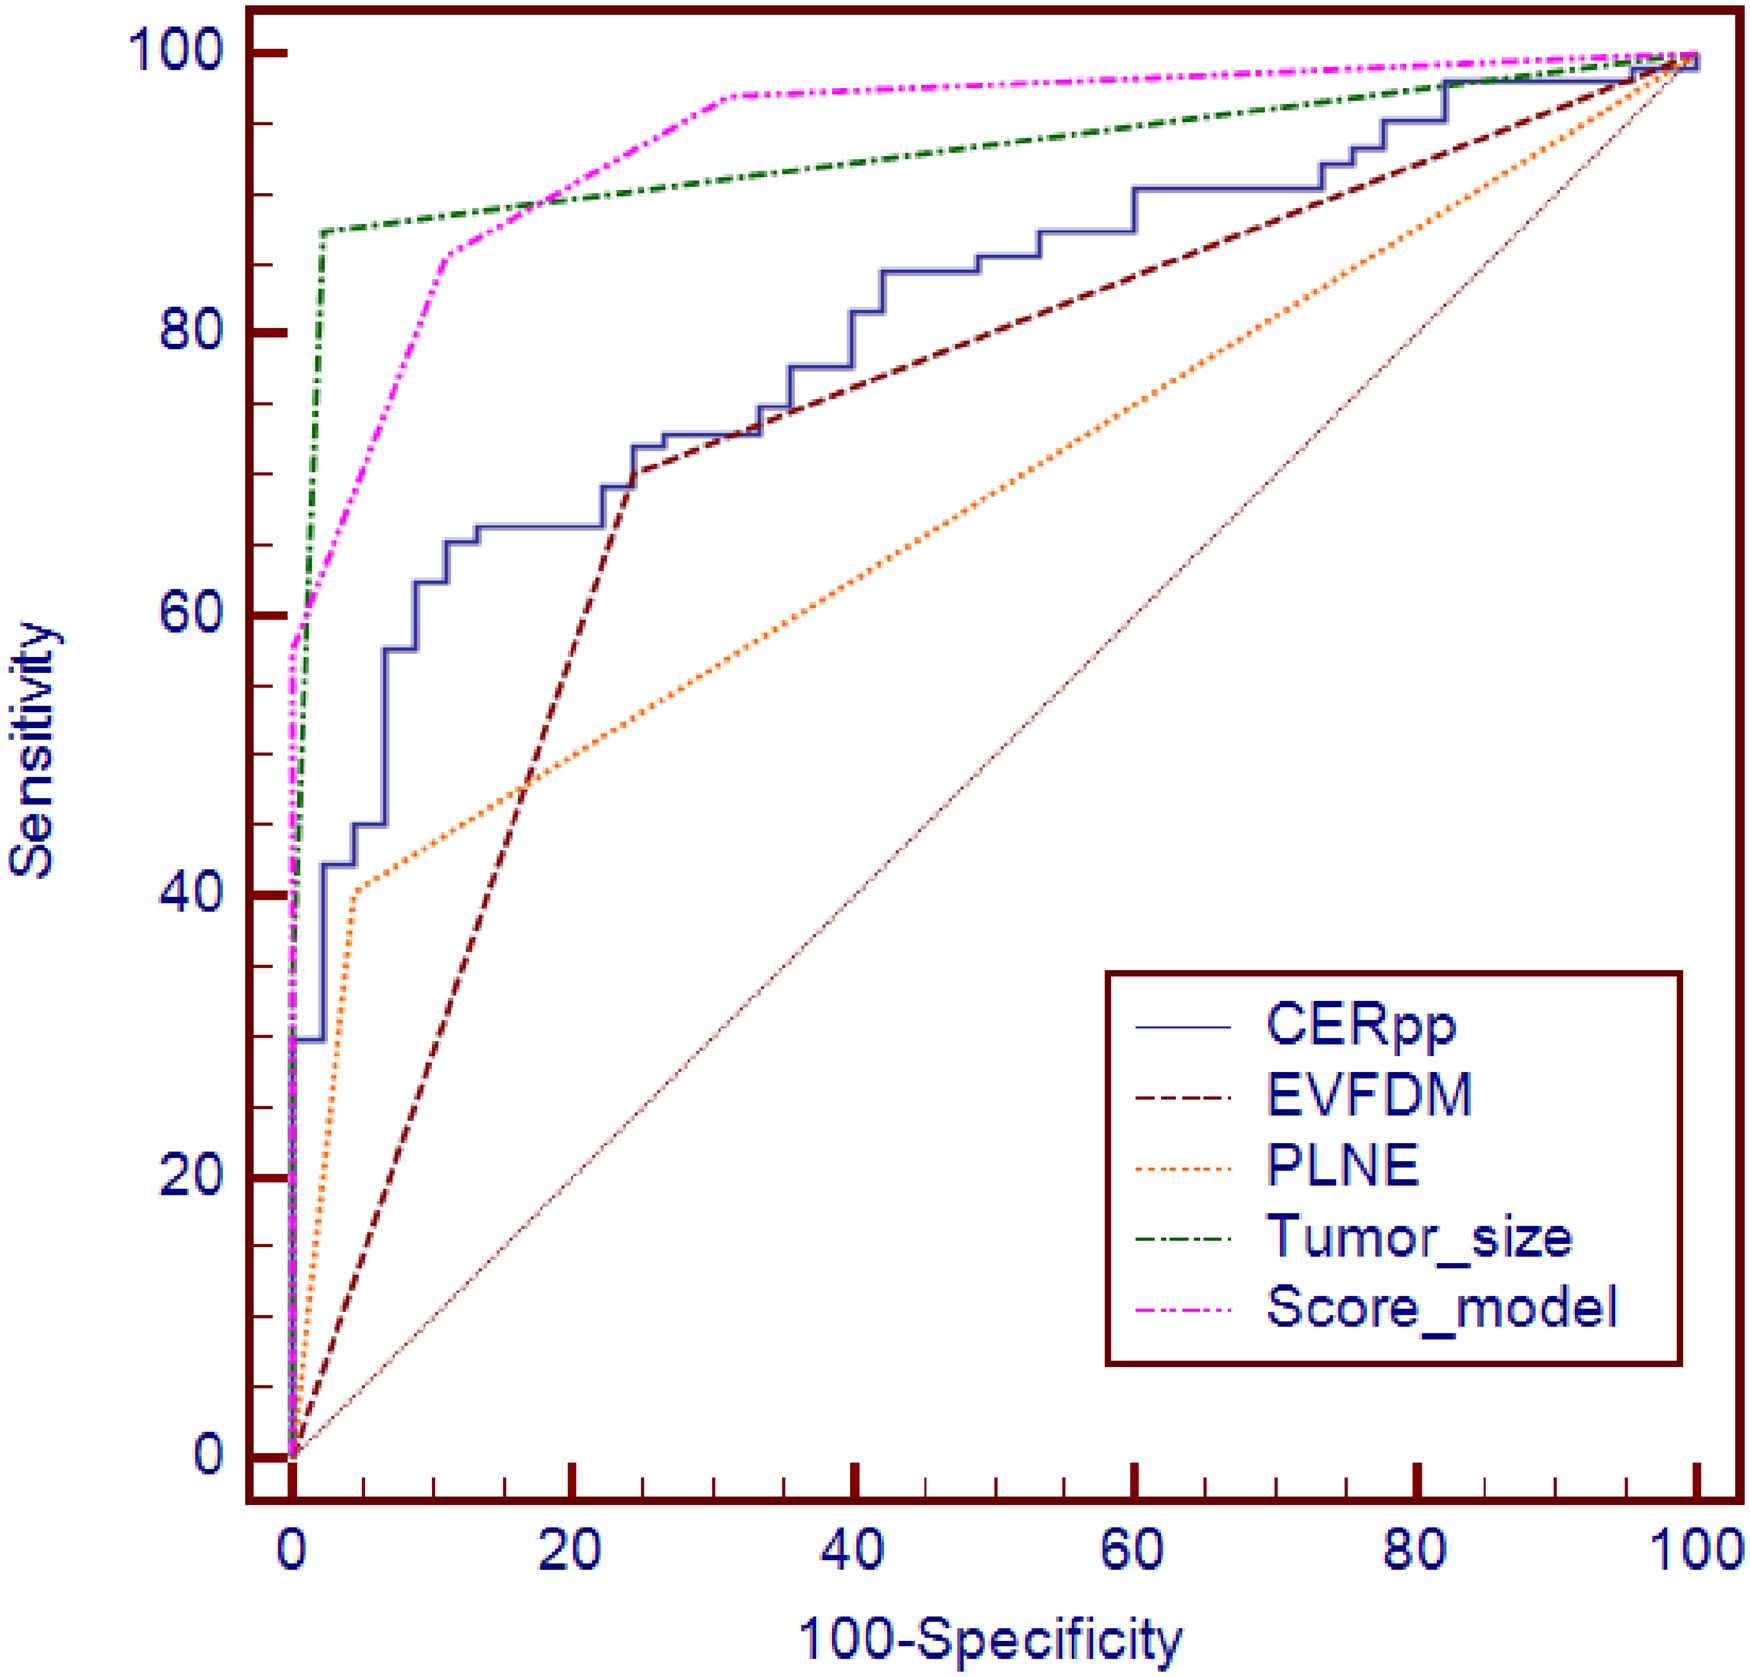
Receiver operating characteristic (ROC) curves of independent predictors and simple scoring model.
Discussion
Accurate preoperative assessment of the biological risk of GIST patients is very important for the selection of individualized treatment and the improvement of prognosis. At present, M-NIH standard is the most widely used in clinical assessment of prognostic risk of GIST, but preoperative risk classification is determined based on pathological examination. Due to the rich blood supply of GIST, puncture biopsy can cause tumor rupture and bleeding, increasing the risk of tumor spread,15,16 so preoperative puncture biopsy is not recommended for tumors that can be completely resected after preoperative evaluation. CT examination is currently the first choice for preoperative assessment of resectable GIST because it is noninvasive. Contrast-enhanced CT can provide an important reference for differential diagnosis, assessment of biological risks, and selection of treatment plans for GIST.
The scoring model was originally used to evaluate the risk factors of cardiovascular disease17,18 and has been widely used in risk stratification of different diseases, which can well predict the risk of disease occurrence and development.19,20 In this study, enhanced CT signs of GIST were screened through retrospective cohort study, and a simple scoring model based on enhanced CT signs was constructed. The results showed that this scoring model had good clinical application value for the prediction of biological risk of GIST. Some studies found that preoperative enhanced CT features of GIST patients21–23 are correlated with postoperative pathological risk grade, which can provide an important basis for preoperative assessment of biological risk of GIST. However, these studies only analyzed the correlation between CT signs and GIST risk classification and did not discuss the diagnostic efficacy of CT signs in predicting GIST risk. In order to further explore the value of enhanced CT in the biological risk assessment of GIST and build an effective and practical clinical prediction model, this study analyzed the features of enhanced CT in combination with clinical data, and the results of single factor analysis showed that significant differences in tumor size, location, margin, growth pattern, superficial ulcer, EVFDM, PLNE, CTN, CERAP, and CERPP were found between low-risk and high-risk groups. The variables with statistically significant differences from the above univariate analysis were incorporated into multiple logistic regression, and the results showed that tumor size, EVFDM, PLNE, and CERPP were independent predictors of the biological risk of GIST, with reliable prediction performance. Tumor size has been proven to be positively correlated with the malignancy of GISTs in previous studies,24,25 which was consistent with our research. Tumor vessels supply the tumor with oxygen and nutrients, required to sustain tumor growth and progression, and provide a gateway for tumor metastasis through the blood or lymphatic vasculature. The presence of enlarged vessels feeding or draining (EVFD) in the mass is considered a reliable index for evaluating GIST malignancy, because of its adequate blood supply which is crucial to tumor proliferation and metastasis. 26 Lymph node metastasis is not common among patients with GISTs and its prognostic value is controversial. The peritumoral lymph node enlargement was also included as an independent risk factor in our study. Apostolos et al 27 have demonstrated that lymph node metastasis is also associated with worse overall survival in patients with metastatic GISTs. The CT value in venous phase was often higher than arterial phase of GIST after enhancement. In our study, CERPP in high-risk GIST was significantly higher than that in low-risk GIST, while CERAP has no statistical significance between the high- and low-risk GIST. It is known that portal enhancement reflects the diffusion of contrast medium in the interstitial space. Destruction of lymphovascular structures may increase the microvascular permeability, which can account for higher a CT value in the portal phase. A study on gastric GIST has shown a similar result as the final independent risk factors of tumor size, growth pattern (exophytic or mixed), margin, intratumoral enlarged vessels, and enhancement pattern. 12 The AUC values of tumor size, EVFDM, PLNE, and CERPP were 0.955 (95% CI: 0.908-0.982), 0.729 (95% CI: 0.650-0.798), 0.680 (95% CI: 0.598-0.754), and 0.807 (95% CI: 0.735-0.867), respectively. When the tumor with EVFDM, PLNE, tumor size >5, or CERPP>0.893, which indicates that GIST has high-risk biological behavior and is prone to relapse and metastasis. According to the above characteristics, the simple scoring model was further constructed, and the results showed that the scoring model had high diagnostic efficiency, with an AUC of 0.941. As the cutoff value was equal to 1, the sensitivity of the scoring model in the diagnosis of biological high risk was 85.58%, the specificity, positive predictive value, negative predictive value, and accuracy were 88.89%, 88.51%, 86.04%, and 86.18%, respectively, all of which were better than the independent estimation of GIST biological risk by a single index.
There are some limitations in this study. (1) This study was a retrospective study, and the inclusion and exclusion criteria of patients may lead to certain selection bias. (2) Although this study established a prediction model for assessing GIST biological risk, it has not been further verified externally, so the reliability and validity of the model still need to be further evaluated and verified by prospective, multi-center studies. (3) Omics and deep learning have been widely used in the evaluation of tumor heterogeneity in recent years. The features of contrast-enhanced CT-based omics may be of higher value in the preoperative evaluation of GIST risk grade. In the next study, we will carry out in-depth data mining, using omics and other methods. It may further improve the diagnostic efficacy of preoperative assessment of GIST risk classification. (4) We include the Stomach and small intestine GIST in our research, while the risk assessment may differ as the different location. In further study, we can compare the risk assessment between each organ. To sum up, the constructed simple scoring model based on the enhanced CT features was a simple and practical clinical prediction model, which can accurately and objectively estimate preoperative biological risk of GIST, and help to develop individualized treatment plan and improve the prognosis of GIST patients.
Footnotes
Abbreviation
Acknowledgments
First and foremost, I would appreciate the organization of the affiliated Huaian No.1 People's Hospital of Nanjing Medical University which gives me a comfortable learning atmosphere. Second, I would like to show my deepest gratitude to the partner, who has provided me with valuable guidance in every stage of the writing of this thesis. His keen and vigorous academic observation enlightens me not only in this thesis but also in my future study. Last but not least, I shall extend my thanks to all my teachers and colleagues who have helped me to develop the fundamental and essential academic competence.
Declaration of Conflicting Interests
The author(s) declared no potential conflicts of interest with respect to the research, authorship, and/or publication of this article.
Ethical Statement
This study was approved by the Ethics Committee of the Affiliated Huaian No.1 People's Hospital of Nanjing Medical University (Number: KY-2022-045-01). As a retrospective study, the patients were exempted from written informed consent.
Funding
The author(s) received no financial support for the research, authorship, and/or publication of this article.