
Abstract
Objectives
To establish and validate a radiomics nomogram model for preoperative prediction of KIT exon 9 mutation status in patients with gastrointestinal stromal tumors (GISTs).
Materials and methods
Eighty-seven patients with pathologically confirmed GISTs were retrospectively enrolled in this study. Imaging and clinicopathological data were collected and randomly assigned to the training set (n = 60) and test set (n = 27) at a ratio of 7:3. Based on contrast-enhanced CT (CE-CT) arterial and venous phase images, the region of interest (ROI) of the tumors were manually drawn layer by layer, and the radiomics features were extracted. The intra-class correlation coefficient (ICC) was used to test the consistency between observers. Least absolute shrinkage and selection operator regression (LASSO) were used to further screen the features. The nomogram of integrated radiomics score (Rad-Score) and clinical risk factors (extra-gastric location and distant metastasis) was drawn on the basis of multivariate logistic regression. The area under the receiver operating characteristic (AUC) curve and decision curve analysis were used to evaluate the predictive efficiency of the nomogram, and the clinical benefits that the decision curve evaluation model may bring to patients.
Results
The selected radiomics features (arterial phase and venous phase features) were significantly correlated with the KIT exon 9 mutation status of GISTs. The AUC, sensitivity, specificity, and accuracy in the radiomics model were 0.863, 85.7%, 80.4%, and 85.0% for the training group (95% confidence interval [CI]: 0.750-0.938), and 0.883, 88.9%, 83.3%, and 81.5% for the test group (95% CI: 0.701-0.974), respectively. The AUC, sensitivity, specificity, and accuracy in the nomogram model were 0.902 (95% confidence interval [CI]: 0.798-0.964), 85.7%, 86.9%, and 91.7% for the training group, and 0.907 (95% CI: 0.732-0.984), 77.8%, 94.4%, and 88.9% for the test group, respectively. The decision curve showed the clinical application value of the radiomic nomogram.
Conclusion
The radiomics nomogram model based on CE-CT can effectively predict the KIT exon 9 mutation status of GISTs and may be used for selective gene analysis in the future, which is of great significance for the accurate treatment of GISTs.
Keywords
Introduction
Gastrointestinal stromal tumors (GISTs) are the most common submucosal tumors of the gastrointestinal tract and are the most common subtype of soft tissue sarcomas.1–3 Due to the presence of KIT gene mutations in approximately 80% of GIST cases,4,5 the biological consequences of these mutants and the drugs targeting them such as tyrosine kinase inhibitors (TKIs), which have been widely utilized in clinical settings, have received extensive attention and in-depth research. 3 The KIT gene mutation in most patients with GIST is located in exon 11. These patients are highly sensitive to the TKI imatinib, and the therapeutic effects of this treatment are significant. 6 KIT exon 9 mutations are the second most common type of KIT mutation, accounting for approximately 9% of all GISTs. 7 Compared with the most common KIT exon 11 mutations, GISTs with KIT exon 9 mutations are more invasive and likely to metastasize to peritoneum and liver.8–10 Previous studies have shown that imatinib is less effective in GIST patients with KIT exon 9 mutations, and their progression-free survival (PFS) and overall survival (OS) rates are short.11,12 Therefore, early determination of the KIT exon 9 mutation in patients with GIST is important for accurate prognosis and timely treatment. At present, the determination of KIT-related genes mainly depends on surgery or biopsy to obtain tissue samples, which is invasive and expensive. Genetic testing requires high-end equipment and technology, which is difficult to popularize in some grassroots hospitals.13,14 Therefore, there is an urgent need to establish a non-invasive and economical method for detecting KIT exon 9 mutations.
The concept of radiomics was first proposed by Dutch scholar Lambin in 2012. It can extract high-throughput texture features from conventional medical images that cannot be recognized by the naked eye and analyze their correlation with tumor heterogeneity, degree of malignancy, and specific protein and gene expression profiles, thus supporting prognostic evaluation, preoperative diagnosis, and clinical implementation of individualized treatment.15,16 The radiomics nomogram has been used to diagnose malignant tumors, including the differential diagnosis of prostate cancer and benign prostatic hyperplasia, 17 and lymph node metastases from breast cancer.18,19 Recently, the role of imaging has evolved to include the correlation of radiomics features with gene expression, also known as radiogenomics.20,21 For instance, the PET/CT or CT radiomics model could identify the epidermal growth factor receptor (EGFR) mutational status in lung adenocarcinoma with moderate accuracy.22,23 However, to the best of our knowledge, radiomics methods have not been used to predict the presence of KIT exon 9 mutations in GISTs. Therefore, the purpose of our study was to establish and verify a nomogram based on contrast-enhanced computed tomography (CE-CT) imaging and to explore the feasibility of predicting KIT exon 9 mutation status in patients with GIST.
Materials and Methods
Patients
This retrospective study was approved by the Ethics Review Committee of Shengjing Hospital, affiliated with China Medical University (approval number: 2022PS969K). Informed consent was waived by the committee because of the retrospective nature of this study. The reporting of this study conforms to the Strengthening the Reporting of Observational Studies in Epidemiology (STROBE) guidelines. 24 We have de-identified all patient details to ensure the confidentiality of patient information.
We retrospectively collected all imaging and clinicopathological data of patients with pathologically confirmed GISTs between January 2015 and December 2021. The inclusion criteria were as follows, (1) pathological diagnosis of GIST; (2) enhanced CT performed within 2 weeks before surgery; and (3) gene detection conducted within 2 weeks after surgery. The exclusion criteria were as follows, (1) patients who received neoadjuvant therapy with TKIs, such as imatinib, before surgery; (2) patients with unclear images that made image segmentation difficult; (3) lack of clinicopathological information. The workflow is described in detail in (Figure 1A). Finally, 87 GIST patients were randomly assigned to the training and test sets in a 7:3 ratio, including 14 and 46 patients with- and without KIT exon 9 mutations in the training set, and 9 and 18 patients with- and without KIT exon 9 mutations in the test set, respectively (Figure 1B).

(A) flowchart diagram representing the study design. (B) The distribution of GISTs with KIT exon 9 mutations in the training sets and testing sets, there were no statistical significance in the proportion of KIT exon 9 gene mutations between the two sets (P = .3278). (C) Use of a least absolute shrinkage and selection operator (LASSO) logistic regression to select features. Curve of binomial deviation of the radiomics model varying with parameter λ, the 5-fold-cross-validation was used to select the optimal model parameter λ. The horizontal is the log (λ) value. The vertical axis is the binomial deviation. The number above indicates the number of selected features, and the λ at the minimum binomial deviation of the model is the optimal value (the curve of the image group characteristic coefficient of the vertical dotted line). (D) Graph of the variation of the radiomics feature coefficient with λ. The number above represents the number of filtered features. GIST, Gastrointestinal stromal tumor. CE-CT, contrast-enhanced computed-tomography.
KIT Mutation Status
Real-time fluorescence quantitative polymerase chain reaction was used to analyze tumor tissue samples that were obtained through biopsy or surgical resection. If accompanied by mutations in any KIT exon 9 mutation, the sample was considered to have a KIT exon 9 mutation and was included in our study.
Image Acquisition
Preoperative abdominal scans were performed with a 320-channel scanner (Aquilion ONE 640; Canon Medical Systems, Otawara, Japan) and a 256-channel scanner (Brilliance 128; Philips Medical Systems, Amsterdam, the Netherlands). The scanning conditions were as follows, tube current 250 mA, tube voltage 120 kV, layer thickness 3 mm, interlayer spacing 3 mm, FOV 500 mm × 500 mm, and matrix 512 × 512. All patients underwent plain scanning followed by enhanced scanning with a contrast agent (iopromide solution: iodine concentration, 300 mg/mL). The total amount of contrasting agent was calculated as 1.5 mL/kg body weight. The elbow vein was injected using a high-pressure syringe at a flow rate of 2.5–3.5 mL/s. The arterial and venous phases were scanned 25–30 s and 60–70 s after contrast injection, respectively.
Tumor Segmentation and Feature Extraction
CE-CT images in the DICOM format were downloaded from the picture archiving and communication system, including the most representative arterial and venous phase CT images. Then, two radiologists with >5 years of experience in abdominal imaging diagnosis, who were blinded to pathological results, manually delineated the region of interest (ROI), layer-by-layer on the arterial phase and venous phase enhanced CT images of all 87 GIST patients. Volume of interest 3D reconstruction was then performed to accurately extract the texture parameters. Then, in Python software (https://www.python.org,v.2.7.0), the Pyradiomics package (https://www.pypi.org/project/pyradiomics/,v3.0) was used to extract the features of the segmented tumor image under the Gaussian filter Laplace operator (log-Sigma = 2.0, 3.0, 4.0, 5.0) and wavelet transform processing. The radiomics features included the first-order (n = 288), shape (n = 14), gray-level co-occurrence matrix (GLCM; n = 384), gray-level dependence matrix (GLDM; n = 224), gray-level run length matrix (GLRLM; n = 256), gray-level size zone matrix (GLSZM; n = 256), and neighboring gray-tone difference matrix (NGTDM; n = 80). A total of 1502 radiomics features were provided in each phase; thus, a total of 3004 features were obtained.
Selection of Radiomics Features and Construction of Radiomics Models
First, a consistency test was carried out to remove features with an intra-group correlation coefficient (ICC) >0.75. Then, the variance homogeneity test (F test; P < .05) and Spearman correlation analysis were performed to retain features with a correlation coefficient >0.9. Finally, a least absolute shrinkage and selection operator (LASSO) regression was used for 5-fold cross-validation to further filter redundant features (Figure 1C and D) and to establish a radiomics score (Rad-score). Finally, 12 features were retained, including 5 arterial phase (AP) features and 7 venous phase (VP) features. The Rad-score for each patient was calculated as follows,

Construction of the Radiomic Nomogram
The data that significantly correlated with the KIT exon 9 mutation in univariate analysis (extra-gastric location and distant metastasis) and Rad-score were included in the multivariate logistic regression analysis, and a radiomics nomogram including the above predictive factors was constructed for all patients. In addition to drawing the receiver operating characteristic (ROC) curve and area under curve (AUC), the Hosmer-Lemeshow test was used for calibration, and decision curve analysis (DCA) was carried out by quantifying the net benefit of the training and test sets of the combined model under different threshold probabilities.
Statistical Analysis
R statistical software (v3.6.3; www.Rproject.org), SPSS (v.25.0, IBM, Armonk, NY, USA), and MedCalc (v.19.6.1, MedCalc Software BVBA, Ostend, Belgium) were used for all statistical analyses. The results of all clinical quantitative indicators are expressed as the mean and standard deviation. If the quantitative data followed a normal distribution, an independent sample t-test was used to compare the differences between each index and the results; otherwise, the Mann-Whitney U test was used, and the chi-square test was used to compare qualitative data. A two tailed P value <.05 was considered statistically significant.
Results
Patients’ Characteristics
The details of the clinical and imaging data of all patients are shown in Table 1. There were no significant differences in the clinical and imaging data between the training and test groups (P > .05, Table 2). There were significant differences in distant metastasis and lesion location between those with and without the KIT exon 9 mutation; that is, KIT exon 9 mutations were more common in extra-gastric GISTs and distant metastases.
Comparison of the Clinical Data and Pathological Results Between the KIT Exon 9 Mutation (−) and KIT Exon 9 Mutation (+) GIST Groups.
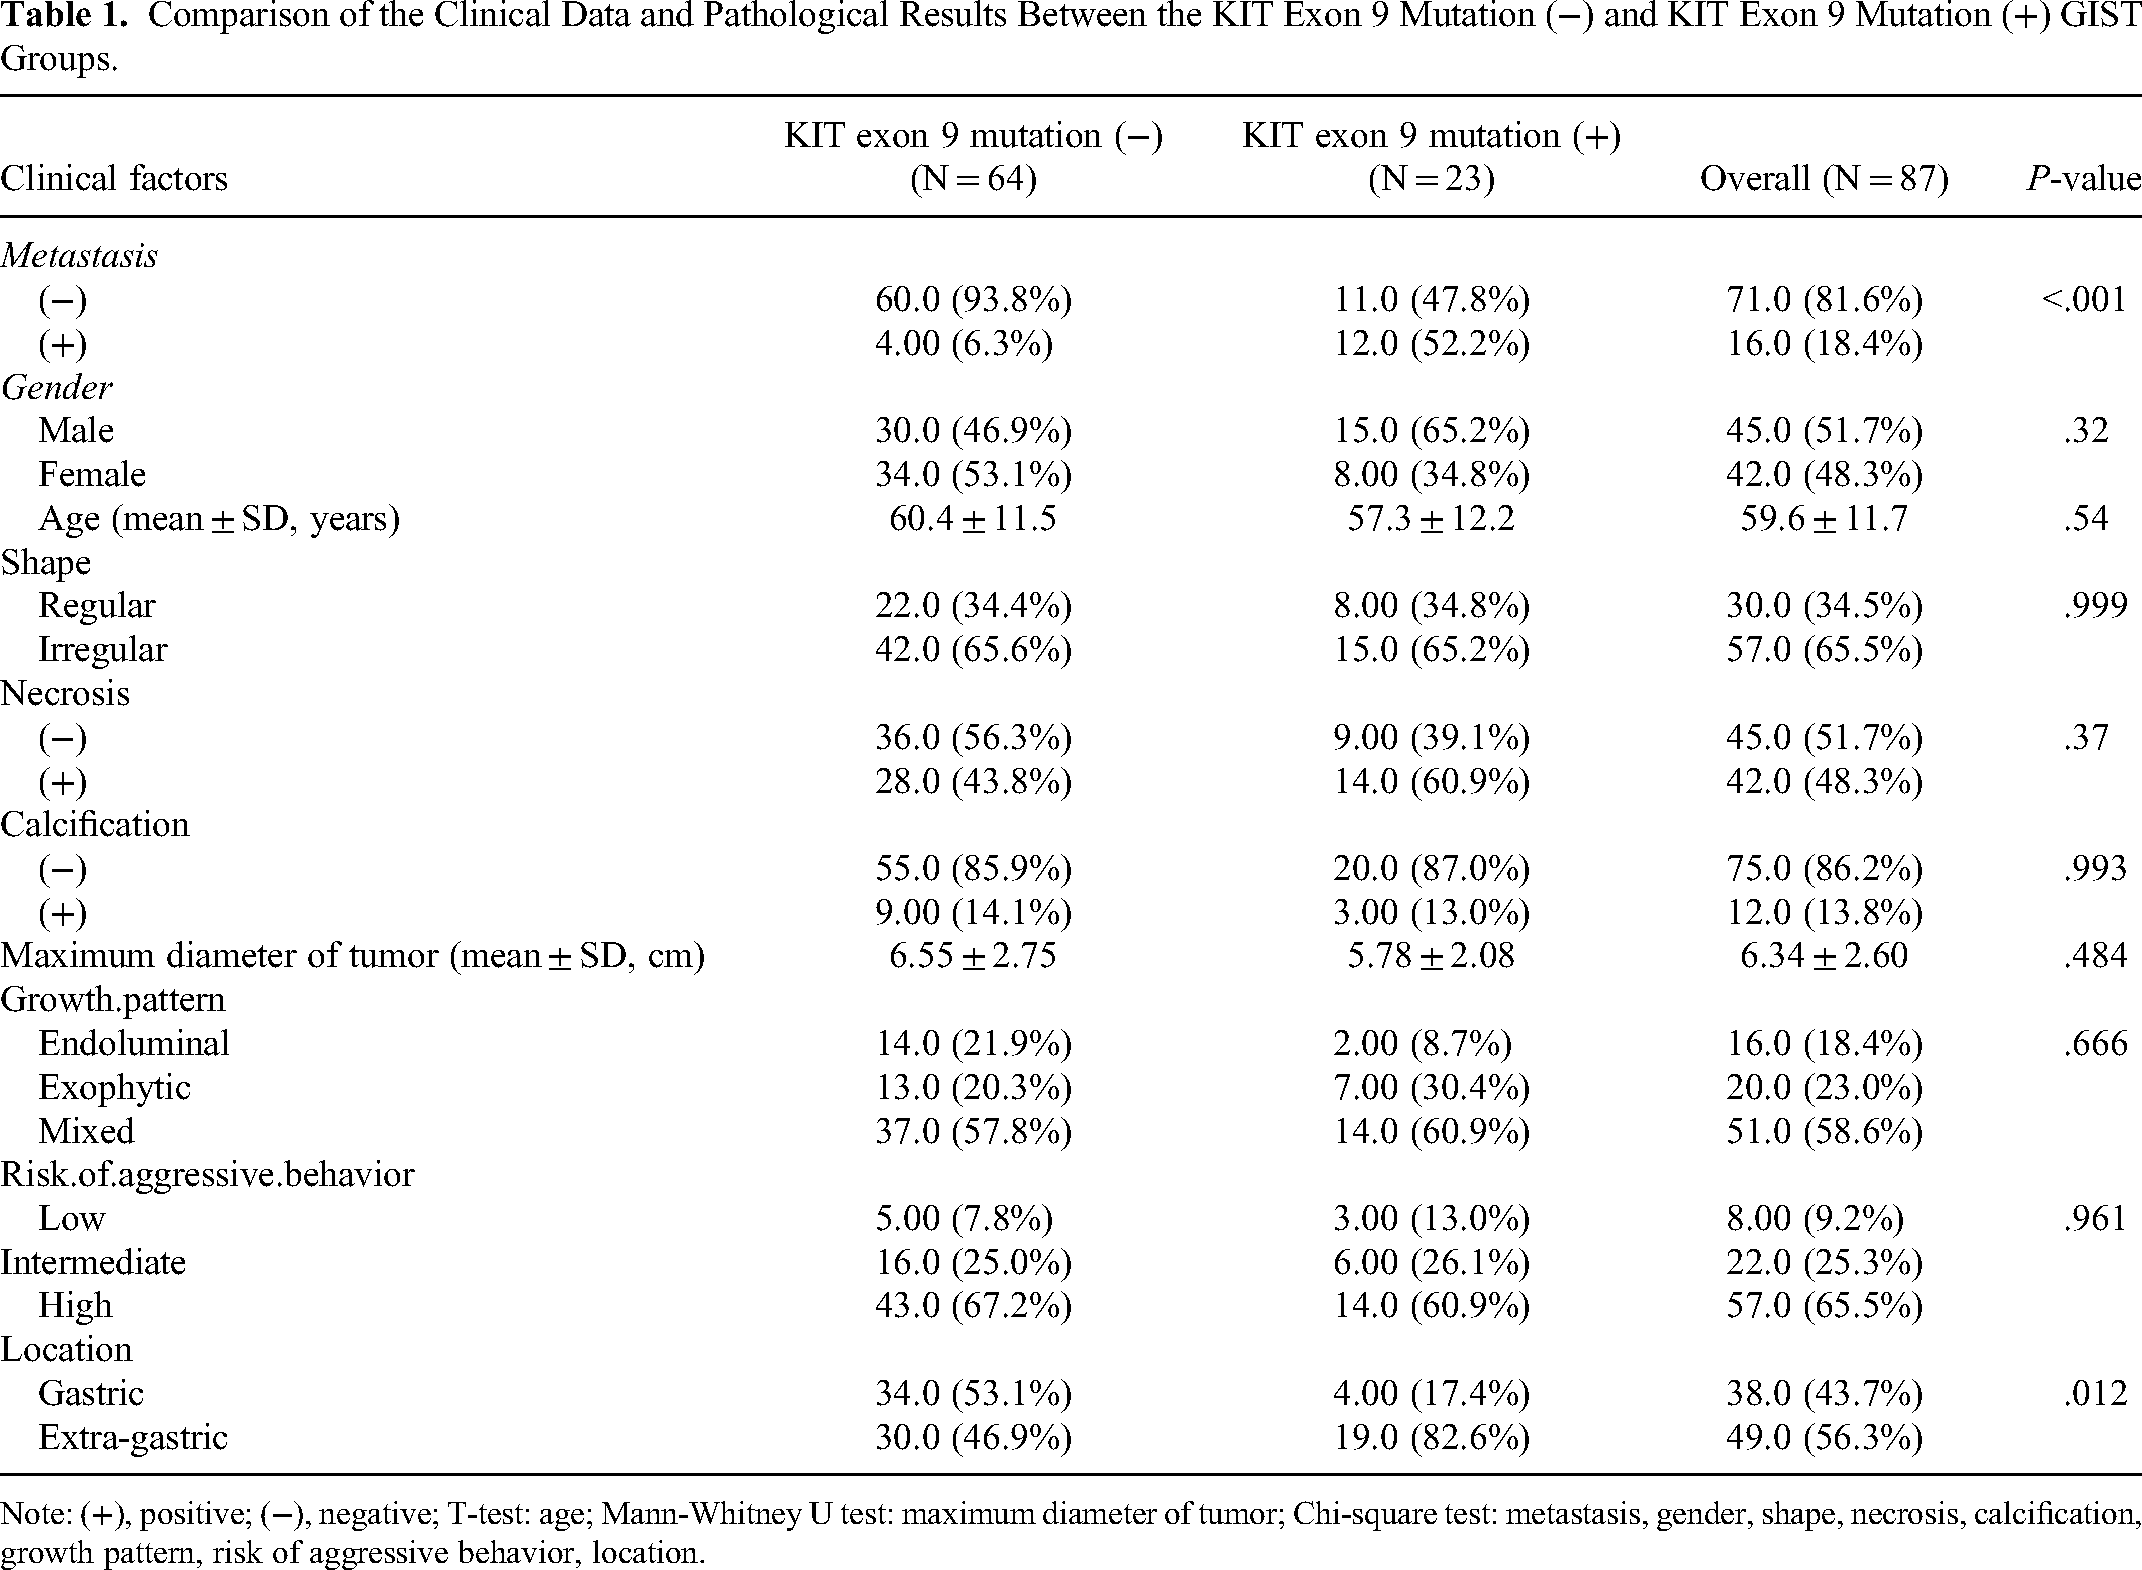
Note: (+), positive; (−), negative; T-test: age; Mann-Whitney U test: maximum diameter of tumor; Chi-square test: metastasis, gender, shape, necrosis, calcification, growth pattern, risk of aggressive behavior, location.
Comparison of the Clinical Data and Pathological Results of Patients in the Training and Testing Sets.

Note: (+), positive; (−), negative; T-test: age; Mann-Whitney U test: maximum diameter of tumor; Chi-square test: metastasis, gender, shape, necrosis, calcification, growth pattern, risk of aggressive behavior, location.
Construction and Efficiency of the Clinical Prediction Model
Two risk factors were used to establish a clinical prediction model. In the training group, the AUC value, sensitivity, specificity, and accuracy for predicting KIT exon 9 mutations were 0.800 (95% CI: 0.676-0.892), 0.571, 0.957, and 0.867, respectively. In the test group model, the AUC value, sensitivity, specificity, and accuracy were 0.694 (95% CI: 0.489-0.856), 0.444, 0.944, and 0.778, respectively (Table 3).
Predictive Ability of the Radiomics Nomogram, Radiomics Model, and Clinical Model for the Classification of KIT Exon 9 Mutation GISTs.

Abbreviations: AUC, area under the receiver operating characteristic curve; CI, confidence interval.
Construction and Efficiency of the Radiomics Model
A total of 3004 features from the arterial and venous phases were reduced to 12 potential predictors after screening, which was used to establish the radiomics model. Our results showed that the AUC value, sensitivity, specificity, and accuracy for predicting KIT exon 9 mutations in the training group model were 0.863 (95% CI: 0.750-0.938), 0.857, 0.804, and 0.850, respectively. In the test group model, the AUC value, sensitivity, specificity, and accuracy were 0.883 (95% CI: 0.701-0.974), 0.889, 0.833, and 0.815, respectively (Table 3).
Construction and Efficiency of the Radiomics Nomogram
The clinical risk factors (extra-gastric location and distant metastasis) and Rad-score were included in the multivariate logistic regression analysis (Table 4), and a more stable radiomics nomogram model was constructed. In the training group, the AUC value, sensitivity, specificity, and accuracy for predicting KIT exon 9 mutations were 0.902 (95% CI: 0.798-0.964), 0.857, 0.869, and 0.917, respectively. In the test group, the AUC value, sensitivity, specificity, and accuracy of the nomogram was 0.907 (95% CI: 0.732-0.984), 0.778, 0.944, and 0.889 (Table 3, Figure 2). The calibration curve showed good consistency between the prediction and actual pathology in the imaging nomogram of the two groups (Figure 3). In addition, the Hosmer-Lemeshow test showed no statistically significant results in the training and test groups (training group 0.645, test group 0.636), indicating that the two groups of models did not deviate from the goodness of fit. To evaluate its clinical applicability, we constructed a clinical decision curve (DCA; Figure 4).

The ROC curves of different models used to identify the KIT exon 9 mutation. (A: training set; B: testing set).
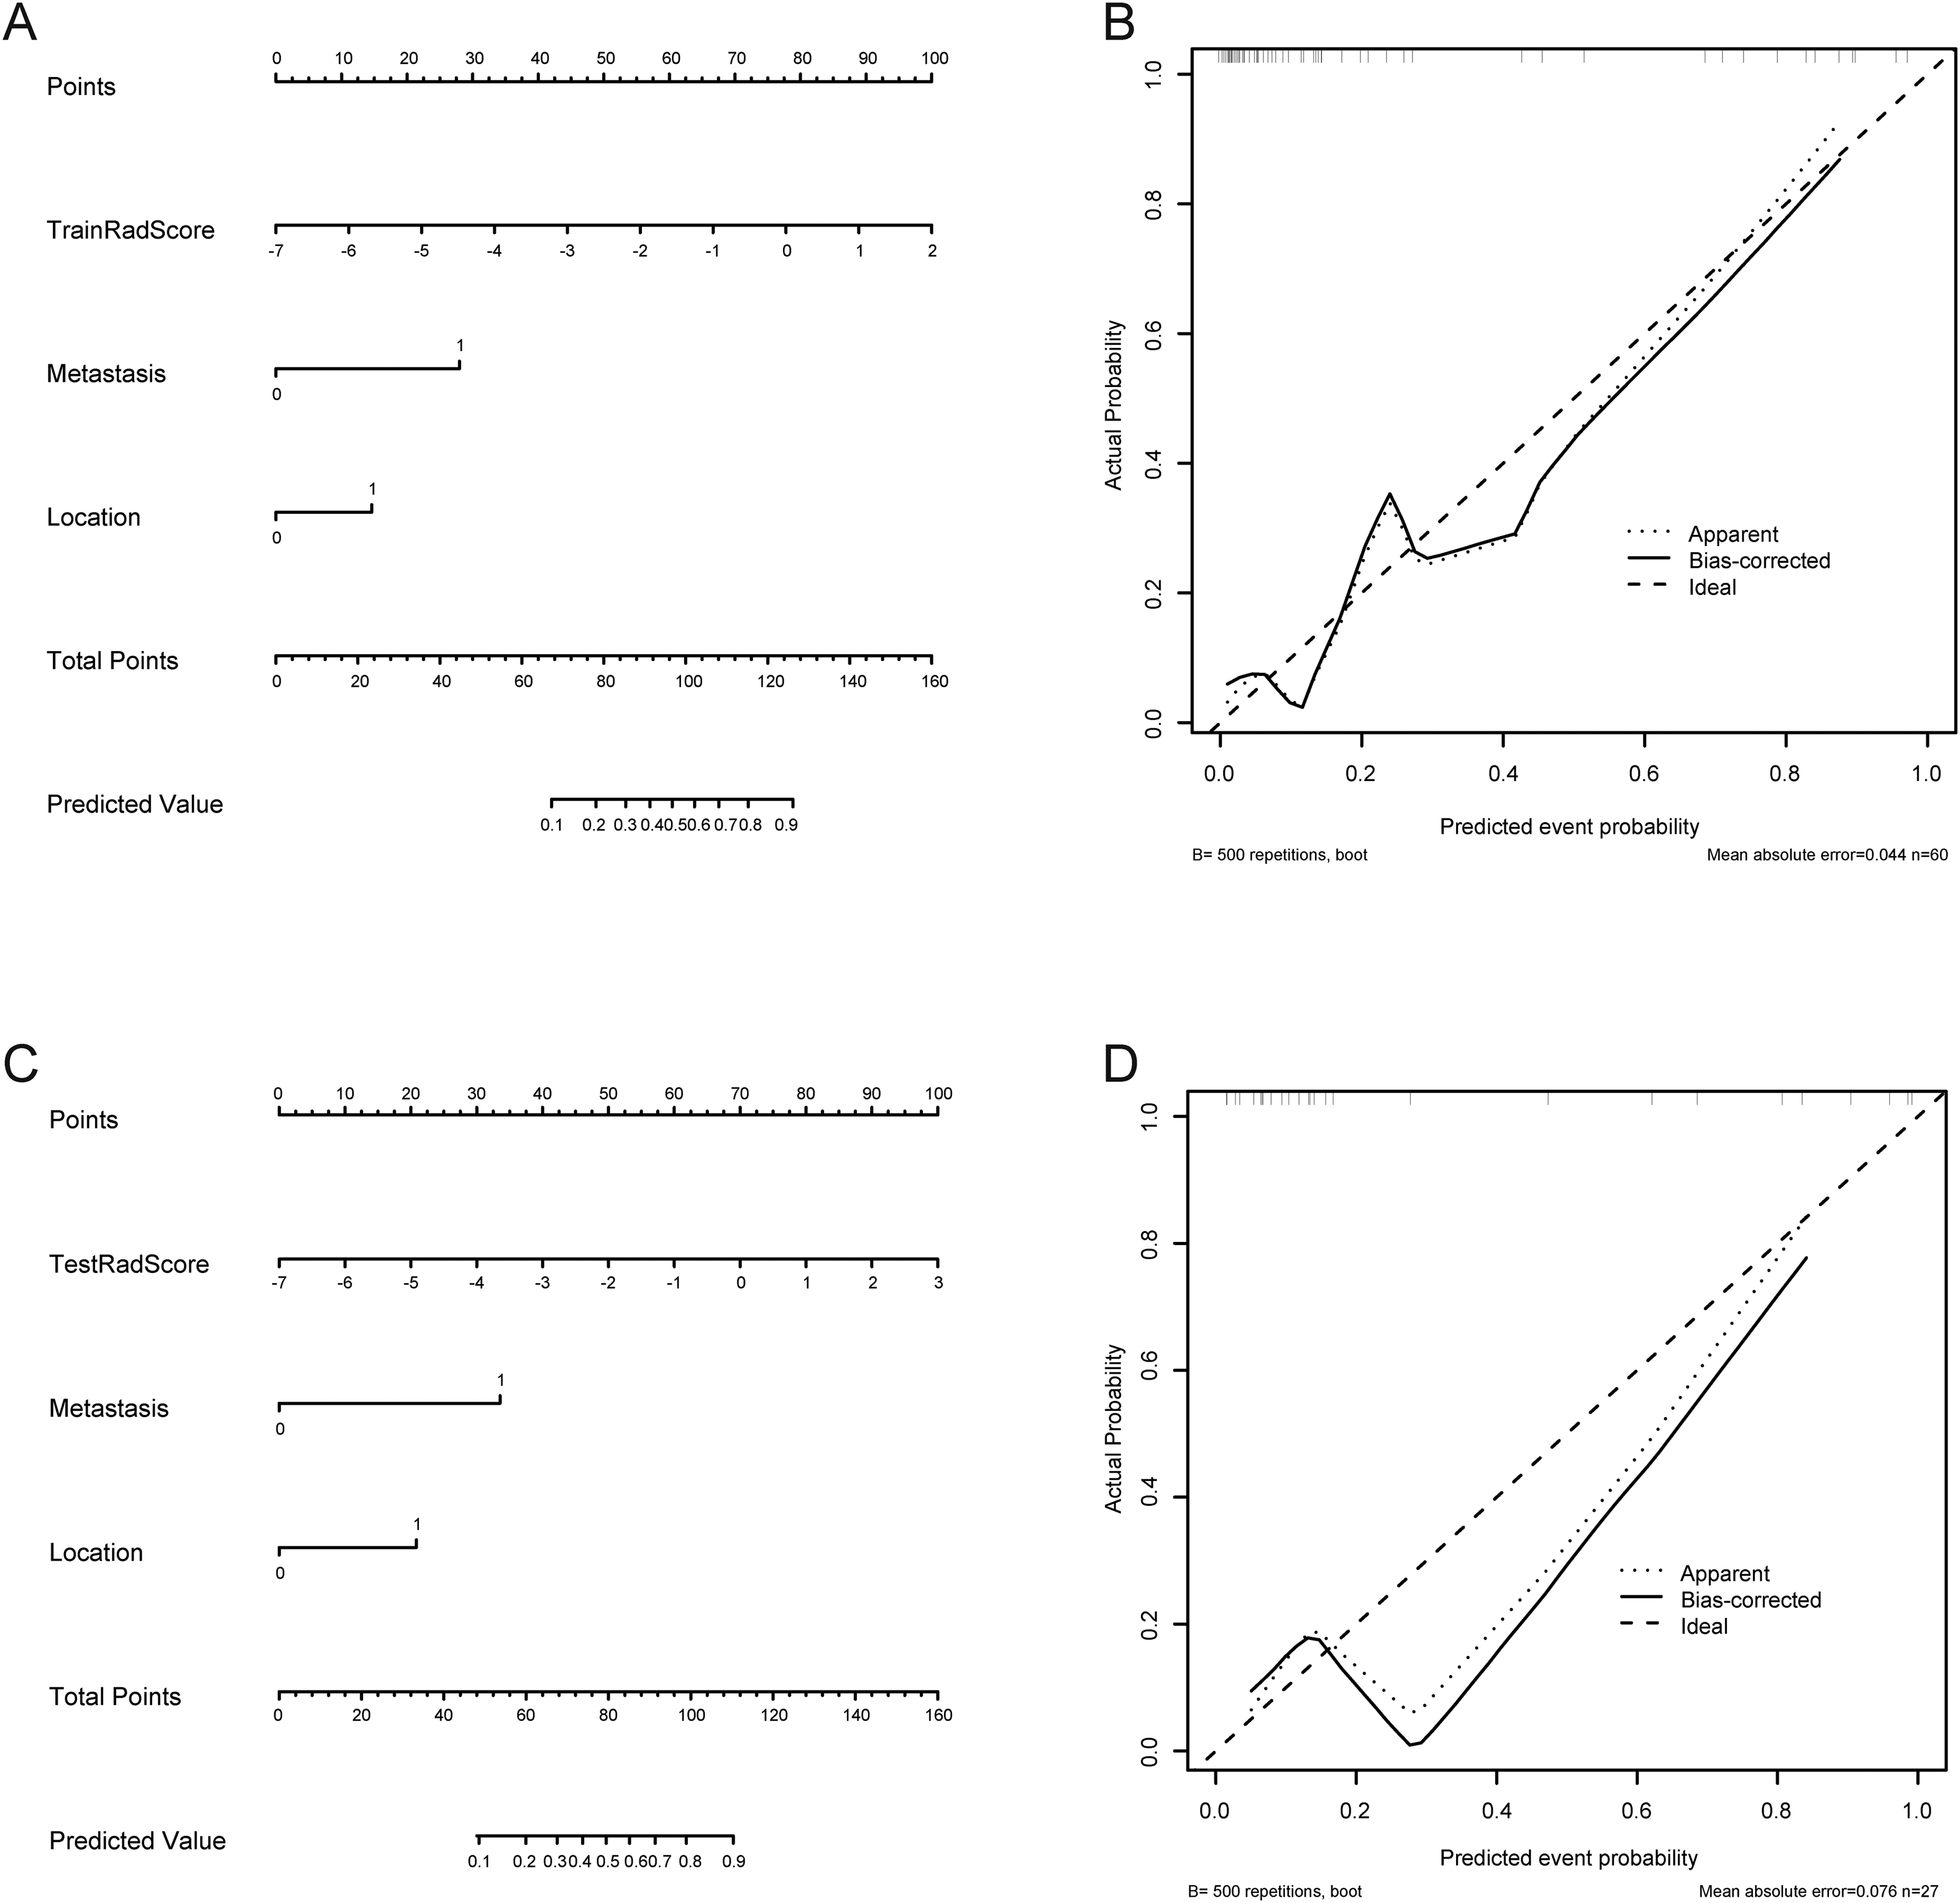
The radiomics nomogram and calibration curves for predicting the KIT exon 9 mutation with the training (A, B) and testing sets (C, D). Location (0: extra-gastric 1: gastric). Metastasis (0: negative 1: positive).

Clinical decision curve of the three models with the training (A) and testing sets (B). The green, blue, and red lines correspond to the nomograms from the clinical, radiomics, and nomogram models, respectively.
Positive Results of Multivariate Logistic Regression Analysis for the Prediction of KIT Exon 9 Mutations.
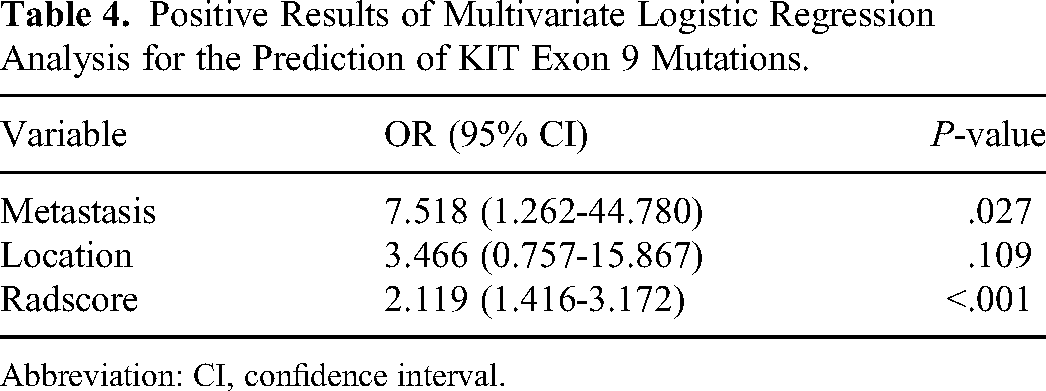
Abbreviation: CI, confidence interval.
Discussion
Compared with the most common KIT exon 11 mutation GISTs, KIT exon 9 mutation GISTs have completely different biological, histopathological, and clinical features. Its unique genetic structure and cellular characteristics indicate that KIT exon 9 mutation GISTs are less sensitive and respond poorly to imatinib. 10 In patients with advanced GISTs, treatment with an initial dose of 400 mg imatinib daily was not effective for patients with KIT exon 9 mutations. 25 Compared with the daily dose of 400 mg, a higher dose of 800 mg of imatinib improved the PFS of patients with KIT exon 9 mutation; however, this treatment has not been tested in prospective trials, and a higher-dose of imatinib can increase toxicity, which makes its clinical use challenging.26,27 Therefore, the early diagnosis of KIT exon 9 mutations in patients with GISTs is important for selecting appropriate clinical treatment options and estimating patient prognosis.
In previous studies, radiomics showed great potential for GISTs, which can effectively predict the malignant potential of GISTs,28,29 mitotic index, 30 and Ki-67 expression index.31,32 In addition, a preliminary study has been conducted on the use of radiomics for the classification and prediction of GISTs gene mutations. Xu et al showed that CT texture analysis is helpful in distinguishing whether GISTs have KIT exon 11 mutations on enhanced CT images. 13 However, they only outline the largest plane of the tumors and adjacent layers, instead of drawing layer-by-layer ROIs, which leads to the generation of an ROI with insufficient details of tumor in 3D; therefore, only a few radiomic features are extracted (only 30). On this basis, Liu et al further expanded the sample size, including three-phase CE-CT images, and sketched tumor ROIs layer by layer, which extracted more kinds of radiomics features; the preoperative radiomics nomogram was found to have a good ability to predict the KIT exon 11 mutation state of GISTs (training set and verification set AUCs were 0.913 and 0.715, respectively). 33 However, no related studies have explored whether radiomics can effectively predict the presence of KIT exon 9 gene mutations in GISTs. In this retrospective study, we established and verified clinical and CE-CT-based radiomics models, and combined these two models to construct a more intuitive and simple-to-use radiomics nomogram. Our results show that the prediction effect of the radiomics nomogram was significantly better than that of the independent clinical and radiomics models, which can provide help for clinical individualization to predict the KIT exon 9 mutation state in patients with GISTs.
In our study, statistical analyses showed that GISTs with KIT exon 9 mutations tended to develop in extra-gastric locations (such as in the small intestine) and were more likely to have distant metastases. These results are consistent with those of the previous studies.10,34 However, the clinical model constructed using the above two risk factors is not ideal for predicting the mutation state of KIT Exon 9 (training and test set AUCs were 0.800 and 0.694, respectively). The prediction effect was significantly improved after including the rad-score (training and test set AUCs were 0.902 and 0.907, respectively). Similar results were reported by Liu et al In the clinical model including CA724, the AUC of the training and test sets were 0.699 and 0.509, respectively. However, the value of AUC increased significantly after being included in the rad-score (training and test set AUCs were 0.913 and 0.715, respectively), indicating that relying solely on clinical features to predict the status of GIST gene mutations is not reliable, and the development of a radiomics model will significantly improve the accuracy of GIST gene mutation prediction. Our DCA further confirms the claim that for non-treatment and all treatment strategies with a treatment probability threshold of 0–0.8, the nomogram model was superior to the clinical predictive model and radiomics model, which indicates that the use of a radiomics nomogram to evaluate the state of the KIT exon 9 mutation has a higher clinical net benefit than the clinical model.
CE-CT is widely used as a routine imaging examination for GISTs. It can comprehensively evaluate the disease stage, malignant potential, and metastasis according to the tumor imaging manifestations, such as size, shape, and enhancement mode, and is the first choice for the evaluation of GISTs.35,36 Considering the lack of contrast between the tumors and the surrounding tissue in the plain scan phase, the boundary of the tumors appear unclear, making the outlining of ROI difficult. Therefore, we selected the most meaningful arterial and venous phase images in CE-CT, and analyzed them layer-by layer to outline the tumors and obtain comprehensive 3D image information. In the two-phase images, we extracted a total of 3004 radiomics features. After step-by-step screening, 12 features were filtered, including four wavelet transform features and seven Gaussian filter features, and only one feature was obtained from the original images. Therefore, we speculate that the wavelet transform and Gaussian filter can highlight the details in the original images and show more information, and thus can better reflect the heterogeneity between tumors, which is consistent with the conclusions of Qi et al. and Zhao et al.32,37 GLCM is a type of image analysis technology that can describe the distribution and shape of image pixels in the form of a grey matrix. 38 GLRLM is the same as GLCM, which can evaluate the distributions of discrete grayscale in the images; however, GLCM evaluates gray symbiosis between adjacent pixels or voxels, and GLRLM evaluates the run length. 39 The definition and calculation method of the GLSZM is based on the GLRLM, and can be used to calculate the number of groups (or regions) that connect voxels. 40 Among the final retained radiomics parameters, the above gray-matrix-related features account for the vast majority (GLRLM: n = 3, GLCM: n = 6, GLSZM: n = 1), which shows that compared with the first-order features, higher-order features such as gray matrix correlation features can more accurately reflect the spatial position and intensity relationship of pixels in the images as well as the roughness and smoothness of the image, facilitating the exploration of a deeper level of tumor heterogeneity and resulting in a stronger ability to distinguish tumors.
Our study has some limitations. First, this was a retrospective study with potential selection bias. Second, the ROI of the tumor tissue was manually segmented. Although a consistency test has been carried out, there are inevitable differences between the original morphology of the tumor tissue. Finally, because KIT exon 9 mutations are relatively rare among GISTs, the sample size is small and multicenter studies were not conducted, which may affect the accuracy of the model. In the future, we plan to expand the sample size and cooperate with other large hospitals to conduct multicenter research with larger sample sizes. Furthermore, we plan to use, advanced techniques, such as semi-automatic image segmentation and deep learning, to improve the depth and accuracy of our research.
In conclusion, our study combined clinicopathological features with radiomics methods to establish and verify a nomogram based on CE-CT. The results show that radiomics has great potential for predicting GIST gene mutations, which may enable clinicians to optimize clinical decisions for treating patients with GIST.
Footnotes
Declaration of Conflicting Interests
The author(s) declared no potential conflicts of interest with respect to the research, authorship, and/or publication of this article.
Funding
The author(s) disclosed receipt of the following financial support for the research, authorship, and/or publication of this article: This study was supported by a grant from the National Natural Science Foundation of China (grant number: 81771947) to Zaiming Lu and the 345 Talent Project in Shengjing Hospital of China Medical University to Ying Ren.
Ethical Statement
This retrospective study was approved by the Ethics Review Committee of Shengjing Hospital, affiliated with China Medical University (approval number: 2022PS969K). Informed consent was waived by the committee because of the retrospective nature of this study. The reporting of this study conforms to the Strengthening the Reporting of Observational Studies in Epidemiology (STROBE) guidelines. We have de-identified all patient details to ensure the confidentiality of patient information.