
Abstract
Background
To investigate the differences between physicians in target delineation in intensity-modulated radiation therapy for nasopharyngeal carcinoma as well as their impact on target dose coverage.
Methods
Ninety-nine in-hospital patients were randomly selected for retrospective analysis, and the target volumes were delineated by 2 physicians. The target volumes were integrated with the original plans, and the differential parameters, including the Dice similarity coefficient (DSC), Hausdorff distance (HD), and Jaccard similarity coefficient (JSC) were recorded. The dose–volume parameters to evaluate target dose coverage were analyzed by superimposing the same original plan to the 2 sets of images on which the target volumes were contoured by the 2 physicians. The significance of differences in target volumes and dose coverage were evaluated using statistical analysis.
Results
The target dose coverage for different sets of target volumes showed statistically significant differences, while the similarity metrics to evaluate geometric target volume differences did not. More specifically, for PGTVnx, the median DSC, JSC, and HD were 0.85, 0.74, and 11.73, respectively; for PCTV1, the median values were 0.87, 0.77, and 11.78, respectively; for PCTV2, the median values were 0.90, 0.82, and 16.12, respectively. For patients in stages T3-4, DSC, and JSC were reduced but HD was increased compared to those in stages T1-2. Dosimetric analysis indicated that, for the target volumes, significant differences between the 2 physicians were found in D95, D99, and V100 for all the target volumes (ie, PGTVnx, PCTV1, and PCTV2) across the whole group of patients, as well as in patients with disease stages T3-4 and T1-2.
Conclusions
The target volumes delineated by the 2 physicians had a high similarity, but the maximal distances between the outer contours of the 2 sets were significantly different. In patients with advanced T stages, significant differences in dose distributions were found, stemming from the deviations of target delineation.
Keywords
Introduction
The incidence of nasopharyngeal carcinoma (NPC) is relatively high in Southeast Asia and South China. 1 Due to the anatomical features of the nasopharynx and the biological characteristics of NPC, radiation therapy (RT) has long been considered to be a primary and major treatment approach against NPC. 2 Since the late twentieth century, intensity-modulated radiation therapy (IMRT) has become the mainstream technique in NPC treatment. With the application of combined treatment including IMRT, the local control rate of early-stage NPC patients exceeds 90%, while an improvement in the patient's quality of life is also achieved. 3 However, the prerequisite for successful treatment should include proper delineation of the target volumes. In clinical applications, for the same region or structure, differences exist in the target delineation performed by different physicians.4,5 The differences in the delineation of NPC target volume can affect the optimization of the treatment strategies and the evaluation of therapeutic effects.6,7 The delineation of target volumes is complicated in NPC due to reasons such as the narrowing of the nasopharyngeal cavity and the complexity of adjacent tissue. There is limited research showing the differences between physicians in target delineation in IMRT for NPC. In a previous study, patients undergoing IMRT for NPC were randomly selected, and the acquired CT images were transmitted to a radiotherapy planning system for contouring. Then, the planned target volume of IMRT was delineated manually by 10 physicians from different radiotherapy centers, planning target volumes for primary tumor and involved cervical lymphadenopathy. The results showed that the maximum difference was more extensive than 40% between individual volume and mean values for the planning target volume of the primary tumor (PTVnx) and involved cervical lymphadenopathy (PTVnd). 8 The present study was designed in order to evaluate the difference in target volume delineation in different stages of NPC between different observers and its effect on the dose coverage. In terms of the volume, similarity, and distance of contour of the target area, this study aimed to investigate the differences between different physicians in IMRT target delineation for NPC treatment under the same reference standard, as well as the impact on dosimetric coverage. The target volume difference and dose coverage were analyzed for patients divided into 2 groups according to T staging, T1-2, and T3-4. The potential causes and the significance of the differences have also been investigated, in order to provide a reference basis for clinical quality control.
The reporting of this study conforms to STROBE guidelines. 9
Materials and Methods
Study Population
Ninety-nine newly diagnosed and histologically proven NPC patients who were admitted to the Cancer Center of the People’s Hospital of Guangxi Zhuang Autonomous Region (here have de-identified all patient details) from 2016 to 2018 were randomly selected and enrolled in this retrospective study. Their age ranged from 27 to 69 years old with a median age of 47 years. There were 7 patients in stage T1, 31 patients in stage T2, 40 patients in stage T3, and 21 patients in stage T4, according to the 2010 AJCC Staging System. 10 The study was approved by the institutional review board of the *** and the requirement for informed consent was waived due to the retrospective nature of the study.
Immobilization and Simulation
All patients were required to lie down on a wide-bore CT simulator couch (Somatom Sensation Open; Siemens Medical Solutions, Erlangen, Germany) in a supine position with their heads in a neutral position. Individualized thermoplastic masks were designed to cover the head, neck, and shoulders. Intravenous contrast-enhanced CT using a 2-mm slice from the vertex to the manubriosternal joint was performed for planning. The CT data were imported to the MIM Maestro Software (Ver. 5.2; MIM Software Inc, Cleveland, US) for target delineation.
Delineation of the Targets
The delineation of the target volumes was completed independently by 2 physicians, both of whom were clinical attending physicians specialized in radiotherapy, had more than 5 years of working experience, and received training in the same school. Furthermore, the target volume delineation was conducted in compliance with the same delineation consensus. 10 The same image registration of MR and CT images was used for each target delineation.
The target delineation was in accordance with the International Commission on Radiation Units and Measurements Reports 50 and 62 11 and international guidelines for the delineation of the clinical target volumes (CTV) for NPC. 12 Briefly, GTVnx and GTVnd include the primary gross volume and the involved cervical lymphadenopathy, respectively, determined by the imaging, clinical, and endoscopic findings. In this study, we didn’t include GTVnd in the analysis because the initial assessment revealed only minor differences in the delineation of GTVnd. The high-risk clinical target volume (CTV1) was defined as GTVnx plus a 5-mm margin and the entire nasopharyngeal mucosa plus a 5-mm submucosal volume. The low-risk CTV2 covered CTV1, the entire nasopharynx, the parapharyngeal space, the pterygopalatine fossa, the posterior third of the nasal cavity, and the maxillary sinuses, inferior sphenoid sinus, posterior ethmoid sinus, skull base, and anterior half of the clivus. CTV2 also covered the entire neck nodal regions for node-positive patients. However, for node-negative patients, only the upper neck was included in CTV2. Level 1b was not routinely irradiated unless there was confirmed lymphadenopathy in level 1b, or a large metastatic node size (3 cm)/extracapsular spread was present in level 2a. PGTVnx, PGTV1, and PGTV2 were generated by adding 3-mm margins to GTVnx, CTV1, and CTV2, respectively (Table 1).
Target Volume Definition for NPC in IMRT.

Abbreviations: IMRT, Intensity-modulated radiation therapy; NPC, nasopharyngeal carcinoma
Metrics to Evaluate Target Delineation Similarities and Dose Coverage
The metrics included the Dice similarity coefficient (DSC), the Hausdorff distance (HD), and the Jaccard similarity coefficient (JSC) for the 2 sets of delineation. These metrics could be directly collected on the target delineation system (Ver. 5.2; MIM Software Inc, Cleveland, US).
The DSC indicated the proportion of the overlapping volumes
13
and the value range was 0-1. The high similarity between the 2 constructs could be proven by a DSC value close to 1. The DSC is calculated with the following equation:

HD is the maximal distance between the outer contours of 2 constructs. The geometric difference between the 2 constructs was positively associated with the value of HD,
16
which is defined by:

The original treatment plans clinically approved for patient treatment were imported into the MIM Maestro Software System and integrated with the new target volumes delineated by the 2 physicians. The dose prescription in the original plan was to deliver 69.96, 60.8, and 54.4 Gy for 95% of PGTVnx, PCTV1, and PCTV2, respectively. The original plan dose was not re-optimized for the new target volumes. The same dose optimized in the original individual plan was used to evaluate target coverage for new target volumes. The parameters relevant to the dose coverage were collected, including the dose delivered to 99% of the target volume (D99), the dose delivered to 95% of the target volume (D95), and the target volume treated by 100% of the prescription dose (V100).
Statistical Analysis
The analyses were performed by using SPSS 20.0 software (version 20.0, Armonk, NY). The Kolmogorov-Smirnov test was used to test data for normality. Mean ± standard deviation was used for data with normal distribution; whereas median (interquartile range) was used for data with skewed distribution. A paired sample t-test or Wilcoxon rank-sum test was chosen based on the data types. A probability value of < .05 was considered statistically significant.
Results
The difficulty of target delineation varies with different T stages. For patients in stages T1-2, the primary disease was localized within the nasopharynx, and the boundary was clear and easy to delineate. In stages T3-4, however, the tumors often invaded the surrounding tissues with edema, resulting in unclear boundaries, which more easily causes differences in delineation. Therefore, the cases in this study were divided into a T1-2 group and a T3-4 group to analyze the delineation differences between patients in the early stage and late stage.
For PGTVnx, PCTV1, and PCTV2 delineated by the 2 physicians, the volumes were not statistically different. When analyzed by clinical staging, the differences also failed to show any statistical significance in patients either with stages T1-2 disease or with T3-4 disease (P < .05), as listed in Table 2.
The Target Volumes of 99 Patients With Nasopharyngeal Carcinoma (

For PGTVnx, DSC, and JSC were both > .7. For PGTVnx, PCTV1, and PCTV2, the median DSCs in the T3-4 group were decreased by .03, .01, and .01, respectively, and the median JSCs in the T3-4 group were decreased by .04, 0, and .02, respectively, compared with those in the T1-2 group. Although the structural differences shown by the DSC and JSC were not obvious, the discrepancies in the maximal distances between the outer contours were significant. The median HD in the T3-4 group was increased by 3.16 mm, 4.23 mm, and 1.91 mm, respectively, compared with those in the T1-2 group.
For PGTVnx, PCTV1, and PCTV2, the DSC and JSC in the T3-4 group were significantly decreased and the HDs were significantly increased, compared to those in the T1-2 group (Table 3 and Figures 1 to 3).

Box plot for DSC, JSC, and HD of PGTVn.

Box plot for DSC, JSC, and HD of PCTV1.

Box plot for DSC, JSC, and HD of PCTV2.
DSC, JSC, and HD for the Target Volumes Delineated by the 2 Physicians.
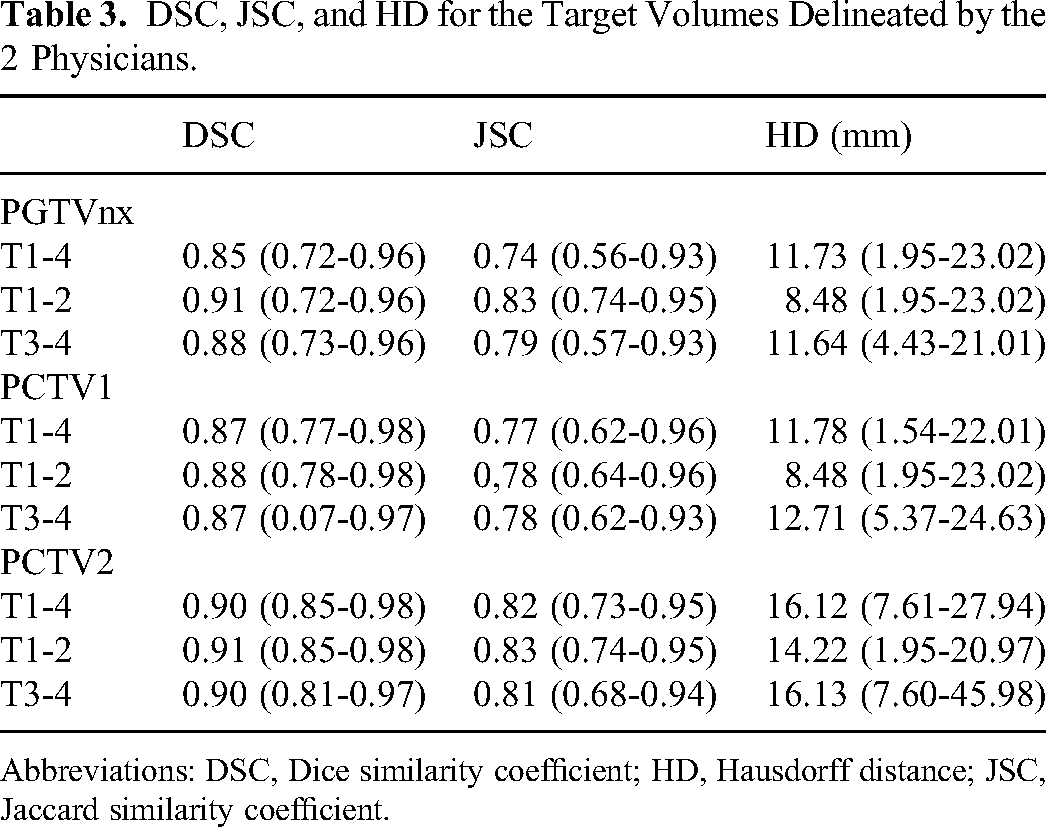
Abbreviations: DSC, Dice similarity coefficient; HD, Hausdorff distance; JSC, Jaccard similarity coefficient.
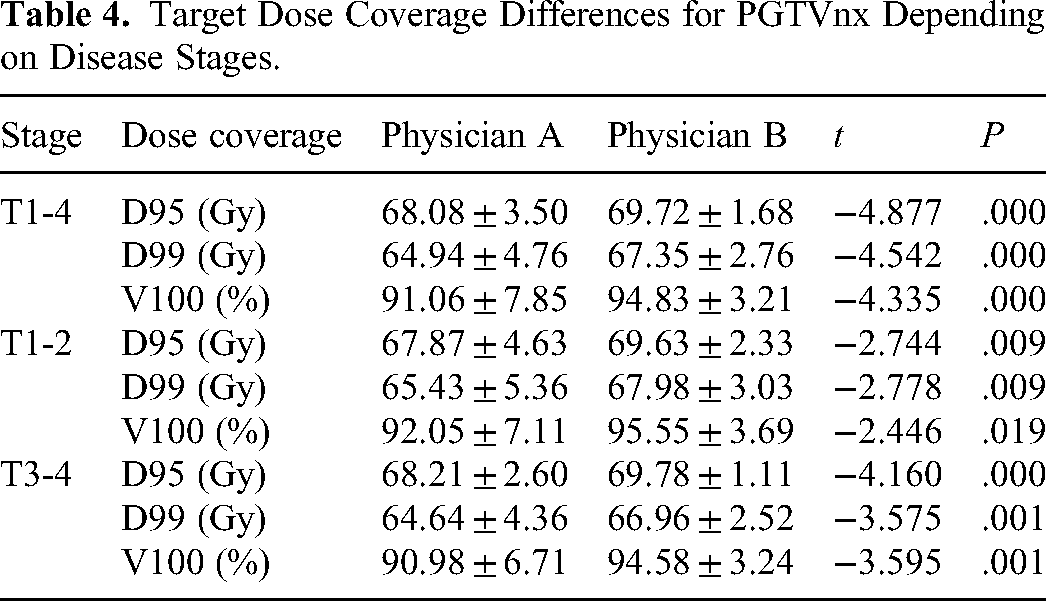
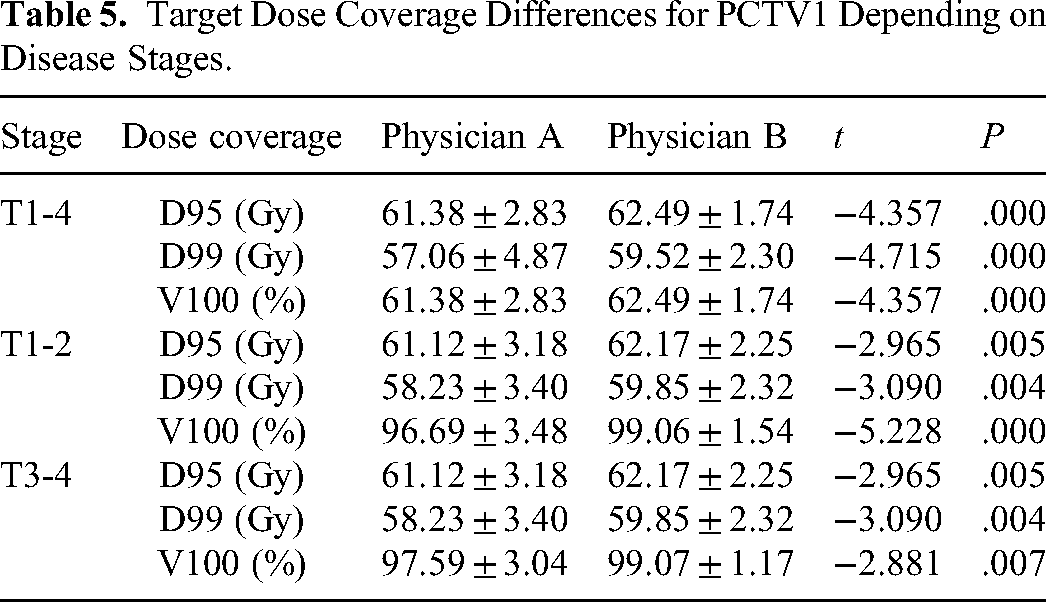
Based on the integration of the original treatment planning with the target volumes delineated by the 2 physicians, in which the same original plan and re-evaluate doses for different contours, physician A and physician B were obtained. There were statistically significant differences in the D95, D99, and V100 values of PGTVnx, PCTV1, and PCTV2 doses between physician A and physician B (P < .05). These differences were observed both in the T3-4 group and the T1-2 group. The prescription dosage coverages of the target volumes in physician B were larger than 95%, while most of the prescription dosage coverages of the target volumes in physician A were smaller than 95% (Tables 4 to 6 and Figure 4).

A patient presented with stage T4N2M0 disease. The thin line indicates the target volume delineated by physician A. The thick line indicates the target volume delineated by physician B. The red line indicates PGTVnx, the green line indicates PCTV1, and the blue line indicates PCTV2. The orange-colored area indicates the dose of 70 Gy, the green-colored area indicates the dose of 60 Gy, and the blue-colored area indicates the dose of 54 Gy.
Target Dose Coverage Differences for PGTVnx Depending on Disease Stages.
Target Dose Coverage Differences for PCTV1 Depending on Disease Stages.
Target Dose Coverage Differences for PCTV2 Depending on Disease Stages.

Discussion
Characterized by the complex structures surrounding the primary disease in anatomy, infiltrative growth, and the high risk of metastasis to the regional lymph nodes, the irradiated areas for NPC patients are often relatively large and highly irregular. Maintaining consistency in defining the target volumes has become one of the critical steps during the whole process of IMRT. However, deviations in the delineation of target volumes may still occur, even though physicians have sought to prevent this by resorting to modern technologies such as multimodal images and artificial intelligence.
In this study, DSC and JSC were used to assess the similarity between the target volumes delineated by the 2 physicians. In the current study, for PGTVnx, PCTV1, and PCTV2, the median DSCs were all above 0.85 and the median JSCs were all above 0.74, indicating considerably high similarity in the target volumes delineated by the 2 physicians.
HD represents the maximal distance between the outer contours of 2 constructs. The larger the HD value, the greater the difference in target delineation. In this study, for PGTVnx and PCTV1, the median HD was 11.78 and 11.73 mm, respectively, and the median HD for PCTV2 was relatively higher at 16.13 mm, indicating that there was an interobserver difference. CTV1 was generated from GTVnx by expanding GTVnx with a 5-mm margin and includes the entire nasopharyngeal mucous membrane and 5 mm depth of submucosal layer, therefore the median values of the maxima distance between the outer contours of PCTV1 and PGTVnx were quite similar. CTV2 covered CTV1 and GTVnd, including the low-risk regions outside CTV1 and the cervical lymphatic drainage area. 17
Peng et al 8 found significant differences in target delineation in NPC patients between different physicians. For PGTVnx, the maximum volume was 73.10 cc, and the minimum volume was 30.37 cc. The ratio of the maximum volume to the minimum volume was 2.41. In our study, the shape of the tumors was rather irregular, and the tumor size was relatively larger. In the 99 enrolled patients, there was no significant difference between the volumes delineated by the 2 physicians. However, some degree of deviation did exist, as shown in Figure 5. Therefore, the differences needed further analysis.

(a) to (c) The target delineation for 3 different NPC patients. The thin line indicates the target volume delineated by physician A. The thick line indicates the target volume delineated by physician B. The red line indicates GTVnx, the green line indicates CTV1, and the blue line indicates CTV2. The overall size of each target volume between physicians A and B is similar, however, the deviation in delineation at the CT cross-sections is clearly seen.
Among different physicians, the understanding of the region requiring prophylactic irradiation could vary. For instance, in the areas where the tumor is adjacent to organs at risks (OARs), such as the eyeball, brain stem, and temporal lobe, CTV2 should be appropriately modified to avoid the overlap between CTV2 and OARs, and the corresponding PCTV2 may also require manual contraction if necessary. The definition of these areas could be remarkably affected by the experience of physicians. The degree of contractions varies among different physicians, resulting in the difference in the outer contour. Moreover, level IB is not routinely included in CTV2 unless certain criteria are met as recommended by the guideline. 18 However, in clinical practice, more complicated circumstances might emerge, and therefore the inclusion of IB into CTV2 should be evaluated on an individual basis. Accordingly, in this study, the maximal distance between the outer contours of PCTV2 was relatively large (Figure 6).

(a) to (c) The PCTV2 of the target volumes delineated by the 2 physicians. The thin line indicates the target volume delineated by physician A. The thick line indicates the target volume delineated by physician B. The blue line indicates CTV2, and the purple line indicates PCTV2. (c) The maximal distance between the outer contours delineated by the 2 physicians reached 3.64 cm.
Accordingly, between the 2 physicians, the differences in the target delineation were more significant in the advanced T stages than those in the earlier T stages. For example, in stages T1-2, the primary disease was localized within the nasopharynx, and the boundary of the tumor could be directly detected based on the integration of CT and MRI images, leading to the limited magnitude of deviation in the target delineation. In stages T3-4, however, the primary disease often invaded the surrounding tissues, including the skull base, lateral pterygoid muscle, fascia of pharyngeal and skull base, and the cavernous sinus. In addition, following the invasion of the disease, the involved tissues often presented with edema and other conditions, resulting in a blurry boundary between tumors and surrounding normal tissues, which was difficult to be defined with imaging. Accordingly, the delineation by different physicians might not be consistent (Figure 7).

A patient presented with stage T4N2M0 disease. The thin line indicates the target volume delineated by physician A. The thick line indicates the target volume delineated by physician B. The red line indicates PGTVnx, the green line indicates PCTV1, and the blue line indicates PCTV2. Edema was observed in the external pterygoid muscle. Although MRI imaging had been integrated, it was still difficult to clearly identify the boundary of the tumor, and the differences in the target volumes delineated by the 2 physicians were clearly seen.
The small geometric difference in CTV volume often has a great impact on the dose coverage of the target volumes. 19 In this study, there were statistically significant differences in the D95, D99, and V100 values of PGTVnx, PCTV1, and PCTV2 between 2 sets of the target volumes delineated by physicians A and B. The target dose coverages for targets delineated by physician B were better than those of physician A when the identical original plan doses were used. In addition, the difference in dose coverage was the most prominent in the PGTVnx. Although DSC and JSC values reflect the high similarity between the target volumes delineated by the 2 physicians, there were differences in the dose coverage for the target volumes. This suggests that the values of DSC and JSC could evaluate the geometric overlap of sets with different structures, but are of limited value in predicting the dose coverage of the target volumes.
Precise delineation of NPC target volumes is not only critical for the design of radiotherapy planning but also a key factor for the overall treatment outcome. Proved by Segedin and Petric, 20 the variability among observers was the predominant factor of uncertainty in the process of delineating the outer contour of the target volume, which might lead to systemic errors in the dose delivered, thereby further affecting the local control of patients. Therefore, the delineation of the target volume should be done by using multimodal images, and the final decision requires a thorough discussion by cross-checking with other experienced physicians or the agreement of all physicians in the department, in order to ensure the accuracy of target delineation. Especially for NPC patients in advanced T stages, the uncertainty in defining the PTV border should be particularly considered during the treatment planning process to ensure that the prescription dose could cover the “true target area” as much as possible. Overall, accurate target delineation is not only a prerequisite for the quality assurance and quality control of RT but also a critical factor that might affect the choice of treatment strategies and the decision of treatment planning.
In Peng's multi-institutional study, 5 physicians from different clinics participated in target delineation. If the physicians have trained from the different clinics referring to other target delineation protocols, it may result in more differences in target delineation. While in this study, 99 patient cases were included, and the 2 radiation oncologists who had the same qualifications as mid-level physicians and trained from the same clinic conducted target delineation. Even with the identical imaging equipment, data, and the same contouring consensus, target dose coverage was significantly different, while the metrics of target volume similarity did not show significant differences. Although the enrolled cases in this study did not conduct sample size analysis and there was a lack of contrast standards, the results of this study can implicate the importance of target delineation consensus in IMRT for NPC.
Conclusions
The target volumes delineated by the 2 physicians had a high similarity, but the maximal distances between the outer contours of the 2 sets were significantly different. In patients with advanced T stages, significant differences in dose distributions were found, stemming from the deviations of target delineation.
Footnotes
Abbreviations
Declaration of Conflicting Interests
The authors declared no potential conflicts of interest with respect to the research, authorship, and/or publication of this article.
Funding
This work was supported by the GuangXi Key Research and Development Program (GuiKe-17195005) and by the Health and Family Planning Commission of Guangxi Zhuang Autonomous Region (Z20180709).
Ethics Approval
The study was approved by the institutional review board of the People's Hospital of Guangxi Zhuang Autonomous Region.