
Abstract
Keywords
Introduction
Pancreatic cancer, one of the devastating cancer types, has no effective treatment for most patients. It is a highly malignant tumor that accounts for 216 000 new instances of cancer each year and results in 200 000 fatalities globally. Pancreatic cancer patients have a less than 5% 5-year survival probability because the disease metastasizes quickly to local lymph nodes and spreads hematogenously to distant organs. Surgery is the only possibly effective cure for pancreatic cancer.1–6 The biology of pancreatic cancer, which is such a deadly disease, needs to be well understood to develop new treatment strategies, and it is predicted that it can be combated with personalized treatments in the future. For the development of individualized treatment plans, medication testing, and a deeper understanding of tumor biology, experimental systems are required. Cell cultures are considered excellent preclinical testing platforms. 7
Most studies on the biology of cancer rely on in vitro, and two-dimensional (2D) cell culture techniques. The disruption of interactions between the cellular and extracellular environments, changes in cell shape, polarity, and mechanism of division are just a few of the drawbacks of 2D cultures. Due to these drawbacks, models that are better able to replicate in vivo circumstances have been developed. Culture using three-dimensional (3D) matrices to construct 3D tumoroids is one such approach. 8 In tumoroids, gradients occur in oxygen, nutrients, waste products, etc In addition, it is widely accepted that 3D cell–cell interactions alter cell signaling in response to soluble substances, which has a significant impact on cell function. 9
The visualization of cancer cell spheroids has been studied with the research of various imaging techniques which has the potential to monitor drug carrier transportation to cancer cells in real-time using multicolor fluorescence microscopy. 10 In our previous studies, we proposed the cost-effective and portable mini-Opto tomography that enables 2D and 3D imaging of spheroids in a certain time interval for visualization.4,11 Since microscopes cannot view biological samples with a size of a few cm in a single-window image, these samples can be viewed locally by moving them. From this perspective, it has been suggested that the mini-Opto tomography platform would be useful to researchers who want to observe how an entire tumor spheroid grown in vitro in cell culture develops within weeks.
One of the matrices, which is used for producing tumoroids, is agarose, a natural, biodegradable, nonadhesive, and nontoxic polymer obtained from seaweed. Agarose possesses the property required for building tumoroids, including high porosity (average pore size, 100-300 nm), which enables the replacement of nutritional media for 3D cell development and offers access to gases and small molecules. Also, agarose is an optically transparent substance that works well for microscopic spheroid viewing. 12 For these reasons, in our study, a pancreatic cancer tumoroid was created using the MIA PaCa-2 cell line, which is widely used in vitro studies of pancreatic cancer,13,14 and agarose gel-based matrix.
Using computer-aided diagnosis (CAD) is the most effective way to diagnose cancer. 15 The CAD has recently been used to help doctors identify and locate suspicious cells in organs. 16 In order to develop effective treatment methods against cancer, appropriate observation and accurate analysis of cancer cells play an important role in developing effective treatment. The development of accurate diagnostic methods for cancer relies on meticulous tracing of the proliferation characteristics of cancerous cells that produce tumor mass in their natural medium. Segmentation of the tumor mass using computer-aided diagnoses is of great importance in quantitative and qualitative analysis of medical imaging. 17
The cancerous structure used in this study was a tumoroid cultured with MIA PaCa-2 pancreatic cancer cells produced in a laboratory environment. The tumoroid was imaged with the mini-Opto tomography platform previously. 11 The mini-Opto tomography device is a cost-effective and portable imaging tool that enables 3D imaging of various biological specimens such as cancer cells. With this platform, a new 3D volumetric image is created by reconstructing 2D images of cancer cells obtained from different angles. 11 The algebraic reconstruction technique (ART) is one of the most frequently used reconstruction techniques and, with ART, a 3D image of a tumor can be reconstructed from the 2D projections of that tumor. 18 In this study, we cultured 3 tumoroids with MIA PaCa-2 pancreatic cancer cells in matrices with agarose concentrations of 0.5%, 0.8%, and 1.5%. We traced the growth developments of these 3 tumoroids at 9 imaging time points (a total of 27 images) with 2D images obtained via the mini-Opto tomography platform using the property of zero-degree angle imaging of it.
Materials and Methods
Many computer software and image processing libraries are available to detect cancer cells from images by applying image processing techniques.19,20 In our study, the Python programming language and OpenCV library were used to perform image processing techniques on the images of the tumoroid. With the mini-Opto tomography imaging system, 2D images of 3 different tumoroid cultures with 0.5%, 0.8%, and 1.5% agarose concentration were taken at 9 imaging time points for each, and 3 different image sets were obtained. These 3 image sets were imported by Python programming environment which is an open-source software to be processed through a series of steps. Additionally, the OpenCV library which is an open-source library used for image and video analysis created by INTEL was used for image processing methods. 21 We worked with the OpenCV library of the Python programming language which consists of 2 main parts (preprocessing and segmentation) for thresholding (ie, threshold values of wide range), morphological operations (ie, 3 × 3-15 × 15 kernels for erosion and dilation), contour calculations (detecting and drawing the borders of tumoroids), and feature extraction (ie, perimeter, diameter, and area).
The preprocessing consists of uploading images, region of interest (ROI), red-green-blue (RGB) to gray transformation and filtering steps. The segmentation section consists of thresholding, morphological operations, and contour area-perimeter-radius calculation steps. These steps are shown in Figure 1.

The flowchart of image processing, segmentation, and feature extraction steps for the tumoroid images. A total of 6 processes were performed to distinguish tumoroids where they were located. These processes were ROI operation, RGB to gray transformation, filtering, thresholding, morphological operations, and contouring. After the images’ preprocessing and segmentation, the tumoroid images’ features were extracted in the feature extraction step.
Cell Culture Preparation
Preparation of pancreatic cancer cell culture
Human pancreatic cancer cell line MIA PaCa-2 (ATCC® CRL-1420TM) was cultured (Figure 2a) using 10% fetal bovine serum (FBS)-supplemented Dulbecco's Modified Eagle Medium (DMEM) without antibiotics in a humidified incubator at 37 °C and 5% CO2 atmosphere. After approximately 70% confluence, cells were passaged, and the culture media was switched every 2 days. 4
Preparation of tumoroids
The agarose gel-based matrices utilized in this study to create MIA PaCa-2 pancreatic tumoroids. 2.5 mL of 0.5%, 0.8%, and 1.5% agarose solutions were prepared and heated in a microwave, and they were put into 33 mm diameter Petri dishes for cell culture and allowed to polymerize. After that, each Petri dish received 2.5 mL of the culture medium (DMEM + 10% FBS) and was maintained for 1 day at 37 °C.
A total of 100 cells in 10 μL volumes were pipetted into the dishes, it was allowed to absorb the solution by the agarose matrices for 2 h, then a cell culture medium was added to the cells and the Petri dishes were placed in the incubator with their bottoms facing up. Standard incubation conditions were used for the cultures (5% CO2, 37 °C). The culture media were replaced 4 days after the initial seeding, and this process was repeated every 2 days after that. The plates were removed from the incubator every 2 days to observe the development of tumoroids with an inverted phase contrast microscope (Leica, Dmil Led Fluo). The imaging of 3 tumoroid cultures with 0.5%, 0.8%, and 1.5% concentrations was initiated with the mini-Opto tomography imaging system (Figure 2b, c) after observing the effective formation and proper growth of the tumoroid by the inverted phase contrast microscope (Figure 2a).
Image acquisition
The images of 3 different sets were acquired via mini-Opto tomography imaging system (Figure 2b, c) that is capable of angular imaging from different angles (e.g., −/+45-degree) of the sample.4,11 In this study, we only operated the 2D imaging characteristic of mini-Opto tomography imaging system using the zero-degree angle scanning operation on different days (9 different imaging time points) to observe the size change of the 3 different tumoroids over time. The image set-1, the image set-2, and the image set-3 were created for tumoroids prepared by 0.5%, 0.8%, and 1.5% agarose concentrations, respectively.
Image preprocessing
The images obtained from the mini-Opto tomography imaging system were RGB images. In this study, since the RGB color channel image contains more structural information than the single channel grayscale image, only grayscale images consisting of grayscales ranging from the weakest intensity black to the strongest white intensity were used.22–24 We converted the images from RGB to grayscale format by applying equation (1) to perform the next steps of image processing such as filtering, thresholding, morphological operations, and contour-area calculation (Figure 1) in our implementation.
In order to distinguish the tumoroid borders from the environment where they are located, it is necessary to perform preprocessing on the images. The preprocessing step consists of uploading images, ROI operation, RGB to grayscale transformation, and image filtering.
In the first step, the raw format of RGB images (Figure 2d) was loaded into the ImageJ program to determine the ROI and background of ROI. Then, the ROI and background of ROI were selected manually on the raw images, allowing the human eye to distinguish the cancerous region (tumoroid borders) from its surrounding (Figure 2e). The raw format of RGB images (Figure 2d) was also uploaded into the Python program to convert it to the grayscale format (Figure 2f) in the preprocessing step.

Tumoroid culture and imaging experiment setup. (a) First image was taken with the inverted phase contrast microscope after culturing MIA PaCa-2 pancreatic cancer cells. (b) Preparation for imaging setup, that is, marking the surrounding tumoroid with a marker. (c) Placement of Petri dish that includes tumoroid into the mini-Opto tomography imaging system. (d) RGB raw image with the size of 9.6 mm × 12.8 mm (resolution: 960 pixels × 1280 pixels) acquired by the mini-Opto tomography imaging system. (e) Selecting ROI and background to determine the distinguishability of the tumoroid from the medium where it is located. (f) Converting the raw image to a grayscale image for use in the preprocessing step.
In the second step, the raw format of RGB images (Figure 2d) was converted to grayscale (Figure 2f) to apply various image filtering methods and to perform image segmentation. The effect of the filters applied to the images on the evaluation of image quality during the preprocessing stage is crucial for the segmentation step. Because the rate of distinguishing the tumoroid from the image background at the image segmentation stage is directly related to the processes to be performed for noise removal at the preprocessing stage before segmentation.
There were some disorders at the boundaries of tumoroid and noises on image sets with grayscales. By applying filtering operation on the images to obtain enhanced images, the disorders were smoothed, and the noises were removed. To increase the appearance details of the tumoroid mass, we applied to mean, median, bilateral, and Gaussian filters, respectively. Additionally, we applied different sizes of core matrices (kernel) such as 5 × 5 for the median filter and 3 × 3 for the bilateral filter to the input images.
In order to explain the filtering concept in general and the mathematical operation behind it, bilateral filtering, one of the filtering methods applied in the study, is discussed in this section. The bilateral filter introduced by Tomasi and Manduchi in 1988 is a nonlinear technique that uses the Gaussian kernel in spatial space and density.
25
The bilateral filter is one of the most effective filters for removing noise while protecting edges. In this method, geometrical distances and gray-level similarities of the surrounding pixels are taken into consideration. The bilateral filter takes the sum of the weights of the pixel values in a local neighborhood. This weight can vary depending on both the spatial distance and the density distance of the pixel value.
26
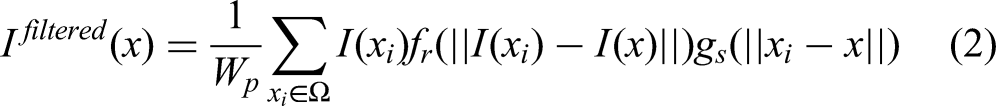
The bilateral filter is expressed as follows:27,28

We applied individually these 4 filtering methods to each 9 imaging time points of 3 image sets for comparing the result performances. Figure 3 shows an example of the comparison of mean-filtered, median-filtered, bilateral-filtered, and Gaussian-filtered images (Figure 3a-e) for the imaging time point-9 in the image set-1. We utilized a Sobel edge detector to highlight sharp changes in intensity in the images using the ImageJ program. The Sobel edge detector 29 provided the borders of the tumoroids in original grayscale, mean-filtered, median-filtered, bilateral-filtered, and Gaussian-filtered images (Figure 3f-j). The borders were masked onto the images to compare the effects of the various filter types (Figure 3k-o). We converted the original and filtered images to the binary format to observe the dissimilarities of tumoroid borders (details are explained in Image Segmentation section) in each image (Figure 3p-t). We created a reference circle (in red color in Figure 3p-t) that has a minimum radius fully covering the tumoroid binary image obtained by the bilateral filter which has a maximum area to compare the areas calculated by a variety of filter applications. We calculated the areas of tumoroid (details are explained in Feature Extraction section) as 21.05 mm2, 21.33 mm2, 19.08 mm2, 28.94 mm2, and 18.37 mm2 for original grayscale, mean-filtered, median-filtered, bilateral-filtered, and Gaussian-filtered images, respectively (Figure 3p-t). The maximum area of the tumoroid was obtained in the bilateral filter application (Figure 3d, i, n, s). Referring to this assessment, in Results and Discussion section, we comprehensively presented Table 2, which shows the total areas of tumoroids (details are explained below), and Figure 7, which includes the tumoroid borders of binary images at a total of 27 imaging time points of the 3 image sets.

Preprocessing of images. (a) Original grayscale image. (b–e) Filtered images were obtained after applying mean, median, bilateral, and Gaussian filters to the grayscale image. (f–j) Obtaining the borders of filtered images with Sobel edge detection. (k–o) Blended images combined with grayscale-filtered images and bordered images. (p–t) After thresholding to the grayscale-filtered images, tumoroid areas of grayscale-filtered images and area of the minimum surrounding circle of the tumoroid.
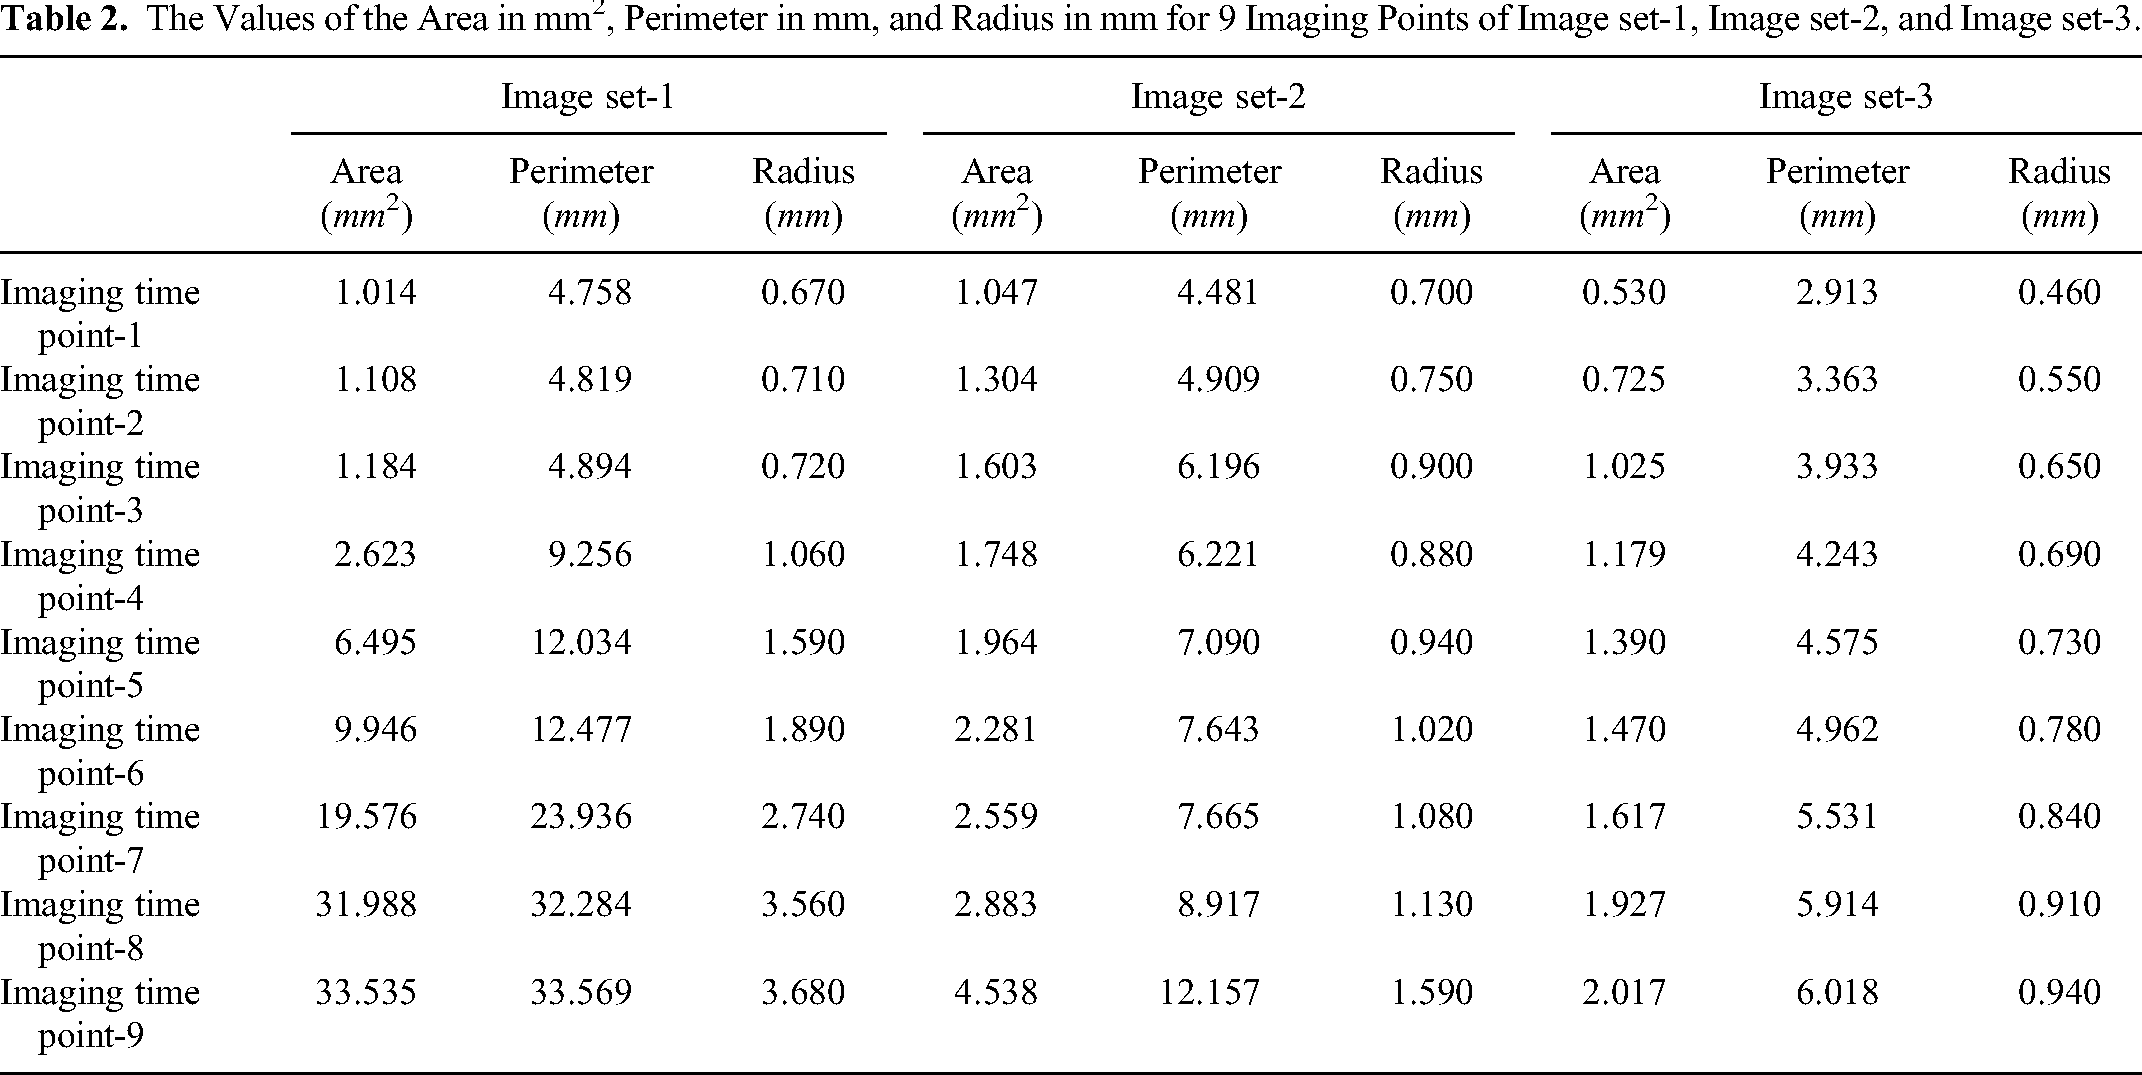
The Values of the Area in mm2, Perimeter in mm, and Radius in mm for 9 Imaging Points of Image set-1, Image set-2, and Image set-3.
Since the raw and filtered images appear close to each other to the naked eye as seen in Figure 3, we evaluated the performance of the filter methods quantitatively. To distinguish the tumoroid mass from its surrounding, various metrics such as the contrast-to-noise ratio (CNR), peak-to-signal noise ratio (PSNR), and mean squared error (MSE) were calculated for the images to be able to measure the efficiency of filters and to evaluate the quantitative analysis.
We used the CNR metric to determine which filter was more effective in separating the tumoroid mass in the images. CNR is a quantitative measure used to determine how clearly the object of interest in an image can be distinguished from the image background. The 
Another metric used to measure the performance of the filters was 
MSE is a metric that is usually used to measure the similarities of 2 images, and a low result of MSE means that the similarity in the image is high.
34
MSE value is calculated as follows:
Image segmentation
In the segmentation section of the image processing technique, the desired and/or target region in an image is separated from its surrounding area by applying various operations. In our study, the main goal of the segmentation process is to distinguish the main structure of the tumoroid in the growth medium by eliminating artifacts outside of the tumoroid. The tumoroid was initially separated from the background by applying segmentation steps consisting of thresholding, morphological, and contouring operations. In the thresholding method, which is an important step in image processing, in order to separate the target object from the image in its environment, a segmentation is made between the target region and the background by selecting the appropriate threshold values. 24 In this study, threshold operation was performed on the filtered images and the area of tumoroid was detected by sharpening boundaries in the culture environment where the MIA PaCa-2 cells were grown.
For performing the segmentation between the tumoroid mass and its background, the binary threshold function returns to 0 or 1 and that is expressed in equation (7). Since the difference between the object and the background is obvious, the global thresholding method, which is one of the thresholding methods,
36
was used in our study to separate the tumoroid (object) from the background. The binary threshold function that is used for the global thresholding method has 4 parameters which are the grayscale source image, the threshold value classifying pixel values, the maximum value, and the threshold type, respectively.
In the Image Segmentation section, another important step is the morphological operation which is used to reduce structural distortions in certain parts of an image 37 and explained next part of the article. With this operation, it was eliminated the regions that are the nontumoroid and artifacts to obtain ROI, which is tumoroid in all image sets.
As morphological operations on an image, dilation, erosion, opening and closing methods are performed for various purposes. Using morphological image processing, the elimination of unwanted objects is possible with different combinations of dilation and erosion. 38 In our study, we preferred dilation which provides the objects in the images to expand and erosion which provides thinning of the objects in the image 39 to apply to the binary image.
For the whole imaging time points of the 3 image sets we used in our study, morphological processes with different kernel sizes were applied to distinguish the tumoroid structures in the images clearly. In the OpenCV environment, the dilate function (

It is recommended to create the opening and closing morphological operations by combining dilation and erosion operations in case dilation and erosion are not sufficient separately to evaluate the ROI region in accordance with its purpose. Opening and closing operations are used for implementations such as noise removal, object simplification, and hole filling
41
to obtain the main structure by filling and/or removing related but disconnected areas. In the opening process, first erosion is performed followed by dilation whereas the opposite of the opening process is done in the closing process. The opening (

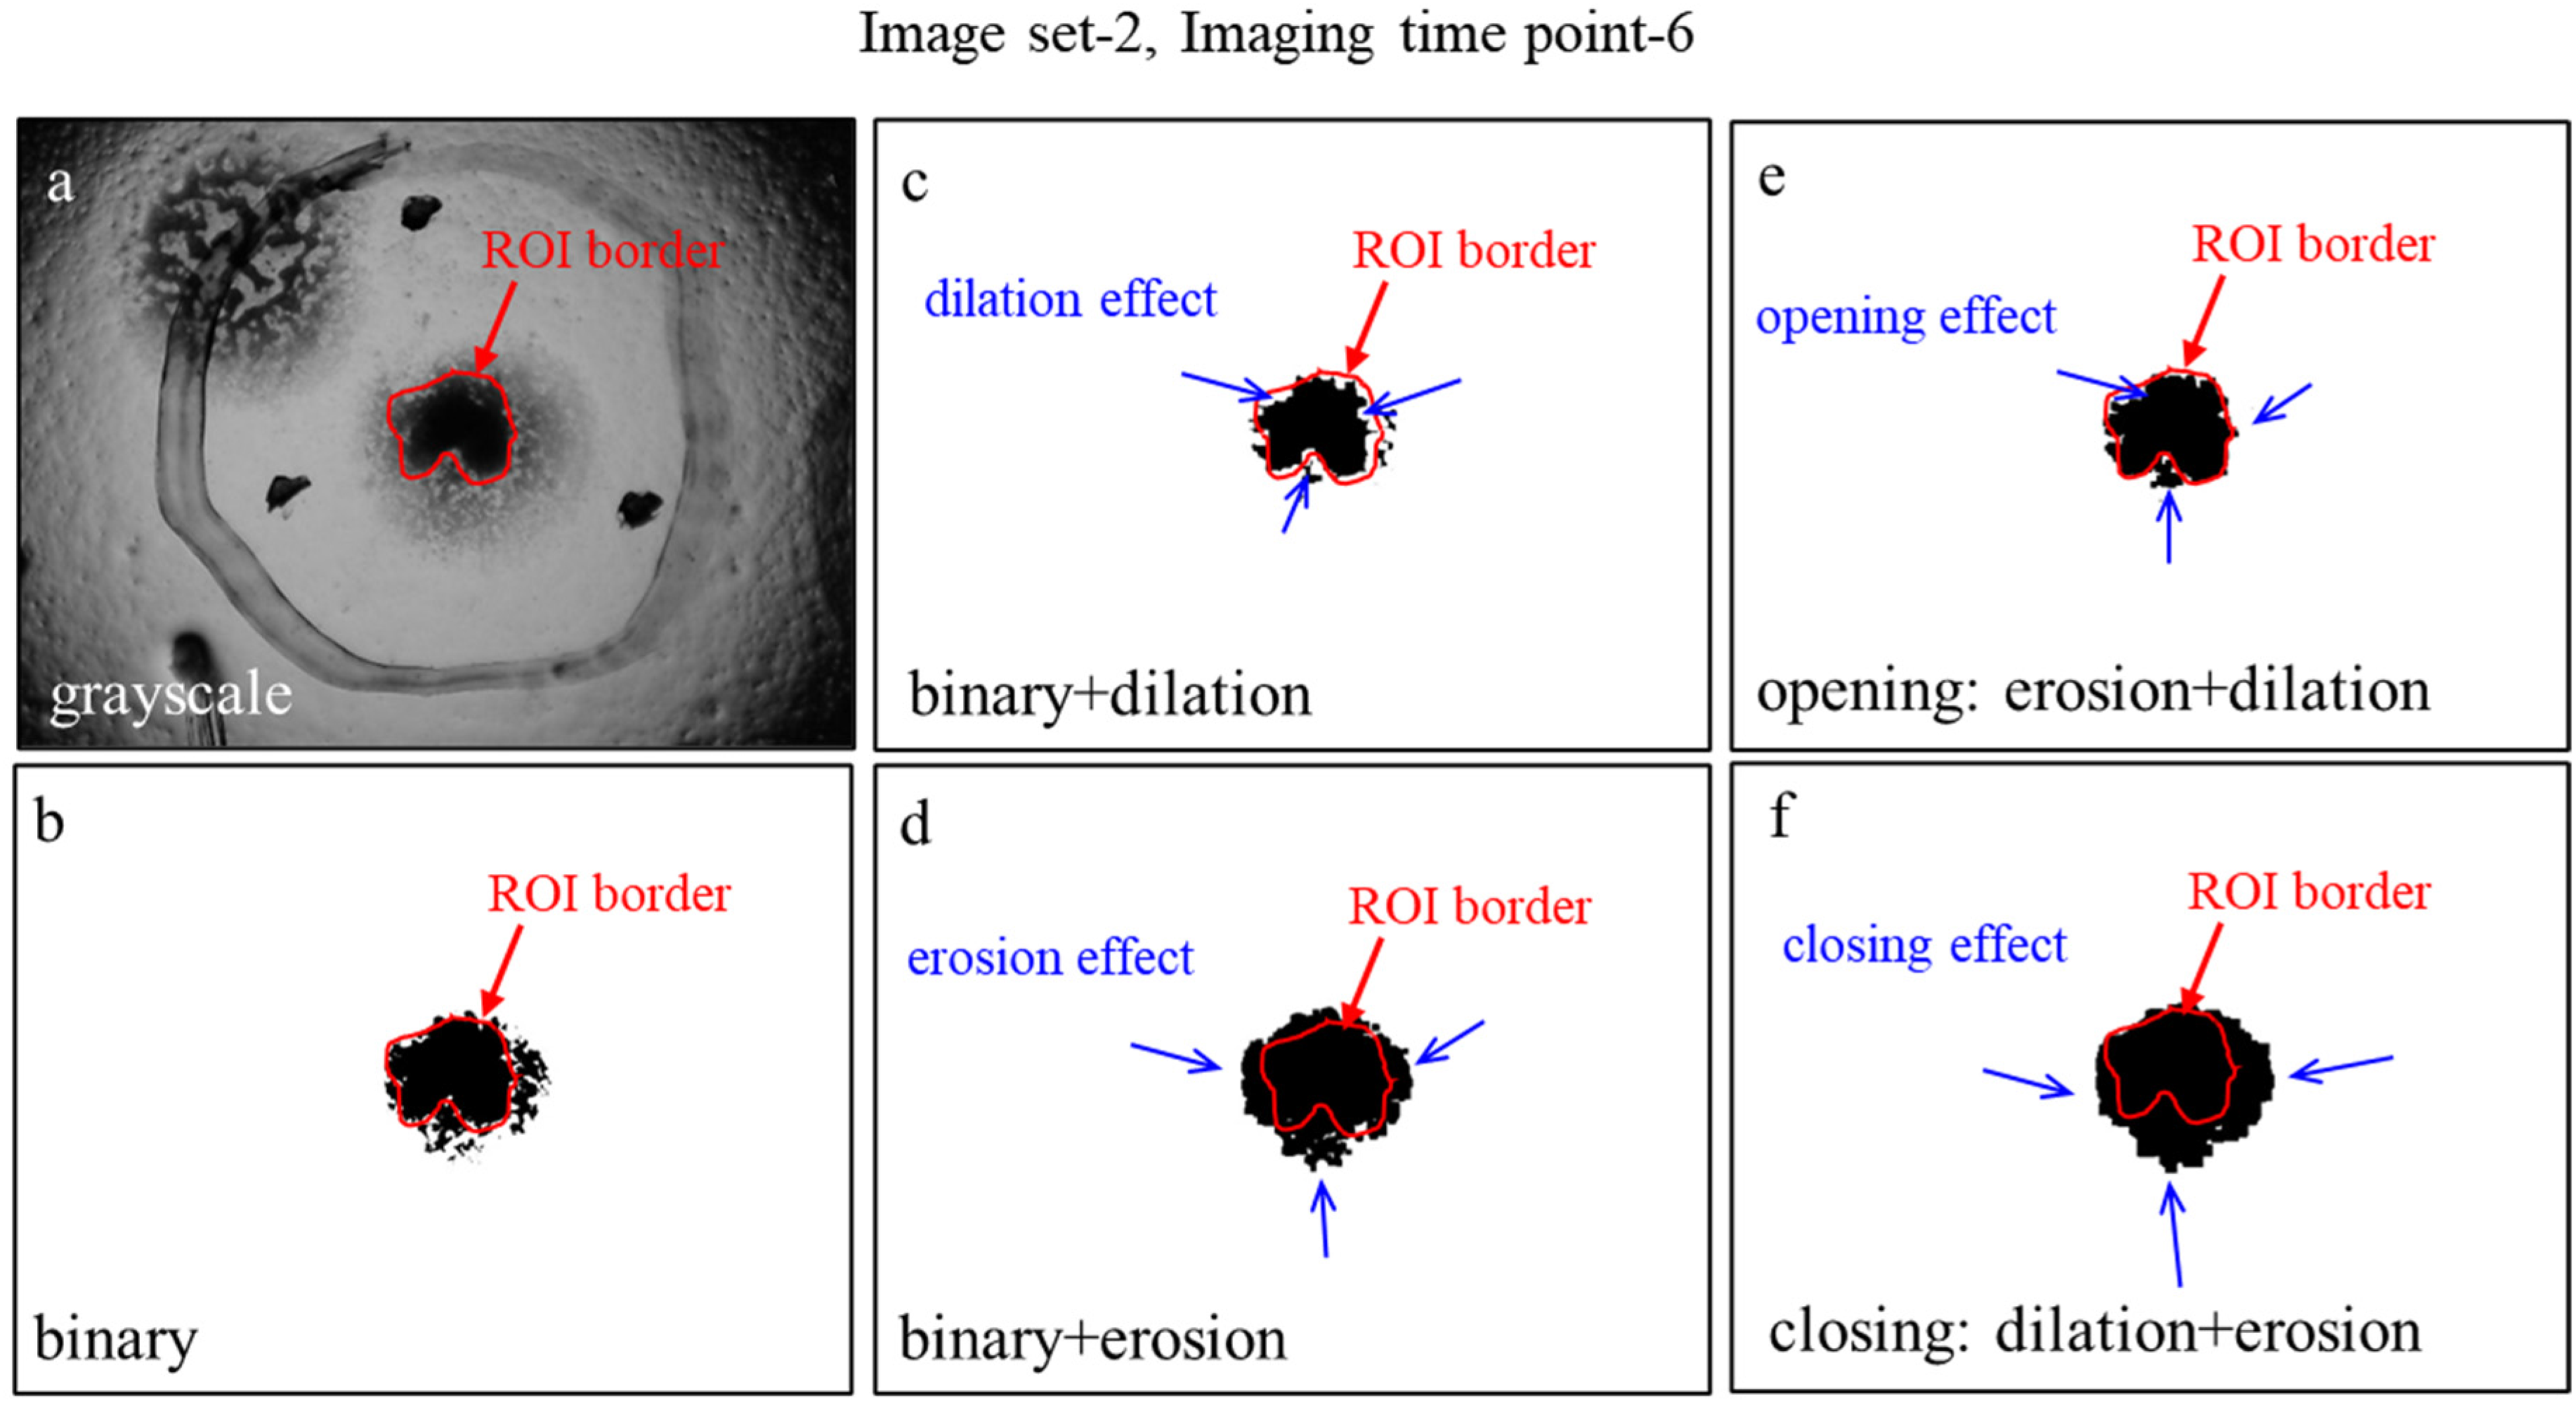
Morphological operations. (a) Region of interest (ROI) border of the tumoroid in the grayscale image. (b) Applying binarization to the grayscale image. (c–f) Effects of dilation, erosion, opening and closing operations on the binary image, respectively.
Another important step in the segmentation stage is contour drawing which is the joint of pixels along the boundaries of the ROI 42 to obtain a specified object that is a tumoroid in our study. In our study, the x and y coordinates of the relevant tumoroid structures were calculated and the contours surrounding the tumoroid were drawn on the original images by combining continuous points with the same density. The pseudocode of the contouring process in segmentation is presented below.
-Segmentation
-Thresholding
-Morphological operations
-Contouring
-finding contours of each eroded/dilated images
>>for i = each image, importing images[i]
>>find all contours* of image[i]
Parameters (source image, contour retrieval mode, contour approximation method)
>>draw all contours** of image[i]
Parameters (source image, contour retrieval mode, contour approximation method)
>>delete of the contours except tumoroid's contour
>>overlay the contours on the original RGB image.
>>end
* Each individual contour is a Numpy array of (x, y) coordinates of boundary pixels that have the same color and intensity of the tumoroid.
** Select the coordinate points of the contour to draw the contour lines of the tumoroid.
In the study, filtered-binary images were used, and the contours of the ROIs were automatically and successfully detected for distinguishing the largest borders of the tumoroid in the 3 image sets.
Feature extraction
Feature extraction is one of the most important phases in detecting cancer at an early stage. 43 We extracted various image features from pancreatic cancer (MIA PaCa-2 cells) images by applying preprocessing and segmentation steps for 3 image sets. We calculated the area, perimeter, and radius features at each of 9 different imaging time points of 3 image sets to observe the development of tumoroid growth.
We presented Figure 5 to illustrate how we determined the contour, area, perimeter, and diameter of the tumoroid for 3 sets of images, citing the imaging time point-9 in image set-3 as an example. In the contouring operation, tumoroid contour (in green color in Figure 5a) was drawn automatically surrounding the tumoroid in the original images (Figure 5a). A reference circle (in blue color in Figure 5b and c) that has a minimum diameter fully covering the tumoroid was created (Figure 5b and c). We calculated the area, perimeter, and diameter of tumoroid as 1.984 mm2, 6.018 mm, and 1.880 mm, respectively (Figure 5a–c). We illustrated the binarization formats of tumoroid border, contoured tumoroid border, and minimum diameter surrounding the tumoroid border in Figure 5d–f, respectively. To emphasize the effects of filtering methods, binarization, morphological operations, and contouring we presented some results in Figure 3, Figure 4, and Figure 5 just to make it clear how material and methods work in this concept.

Feature extractions of the 3 image sets, that is, Image set-3, Imaging time point-9. (a) Contouring and calculating the area of tumoroid, that is, tumoroid area of image set-3 at imaging time point-9 was 1.984 mm2. (b) The perimeter of tumoroid was 6.018 mm. (c) The diameter of tumoroid was 1.880 mm. (d–f) Binary formats of tumoroid border, contoured tumoroid border, and minimum diameter surrounding the tumoroid border.
Results
The 3 sets of images used for the proposed image processing techniques were obtained with zero angles from the mini-Opto tomography device at 9 different imaging time points. We analyzed the results by applying the stages of preprocessing and segmentation such as filtering, binarization, morphological process, contouring, and feature extraction for each imaging time point of the 3 image sets. We evaluated the outcomes of all processing for all data qualitatively and quantitatively.
In quantitative evaluation (Table 1), the median filter gave the highest values in PSNR measurement in the range of 46.656 to 57.675, 43.108 to 47.904, and 43.989 to 50.316, and gave the lowest values in MSE measurement in the range of 0.111 to 1.404, 1.053 to 3.178, and 0.604 to 2.599 for image sets-1, 2, and 3, respectively. Additionally, the CNR values of median filtered images were in the range of 1.714 to 14.120, 10.750 to 41.058, and 11.886 to 44.742, for image sets-1, 2, and 3, respectively. However, although the PSNR and MSE values of median filtered images were the highest and lowest among the filter methods, the CNR values of median filtered images were not superior results as expected. The bilateral and Gaussian filters gave the highest CNR values compared to the CNR values of median-filtered images because the median filter caused smoother images and smoothing produced lower CNR values. For instance, the CNR values of bilateral filtered images were in the range of 1.715 to 15.216, 10.788 to 41.947, and 16.642 to 45.460 for image sets-1, 2, and 3, respectively.
PSNR, MSE, and CNR Values of the Mean-, Median-, Bilateral-, and Gaussian-Filtered Images for 3 Image Sets, Each of 9 Imaging Time Points.
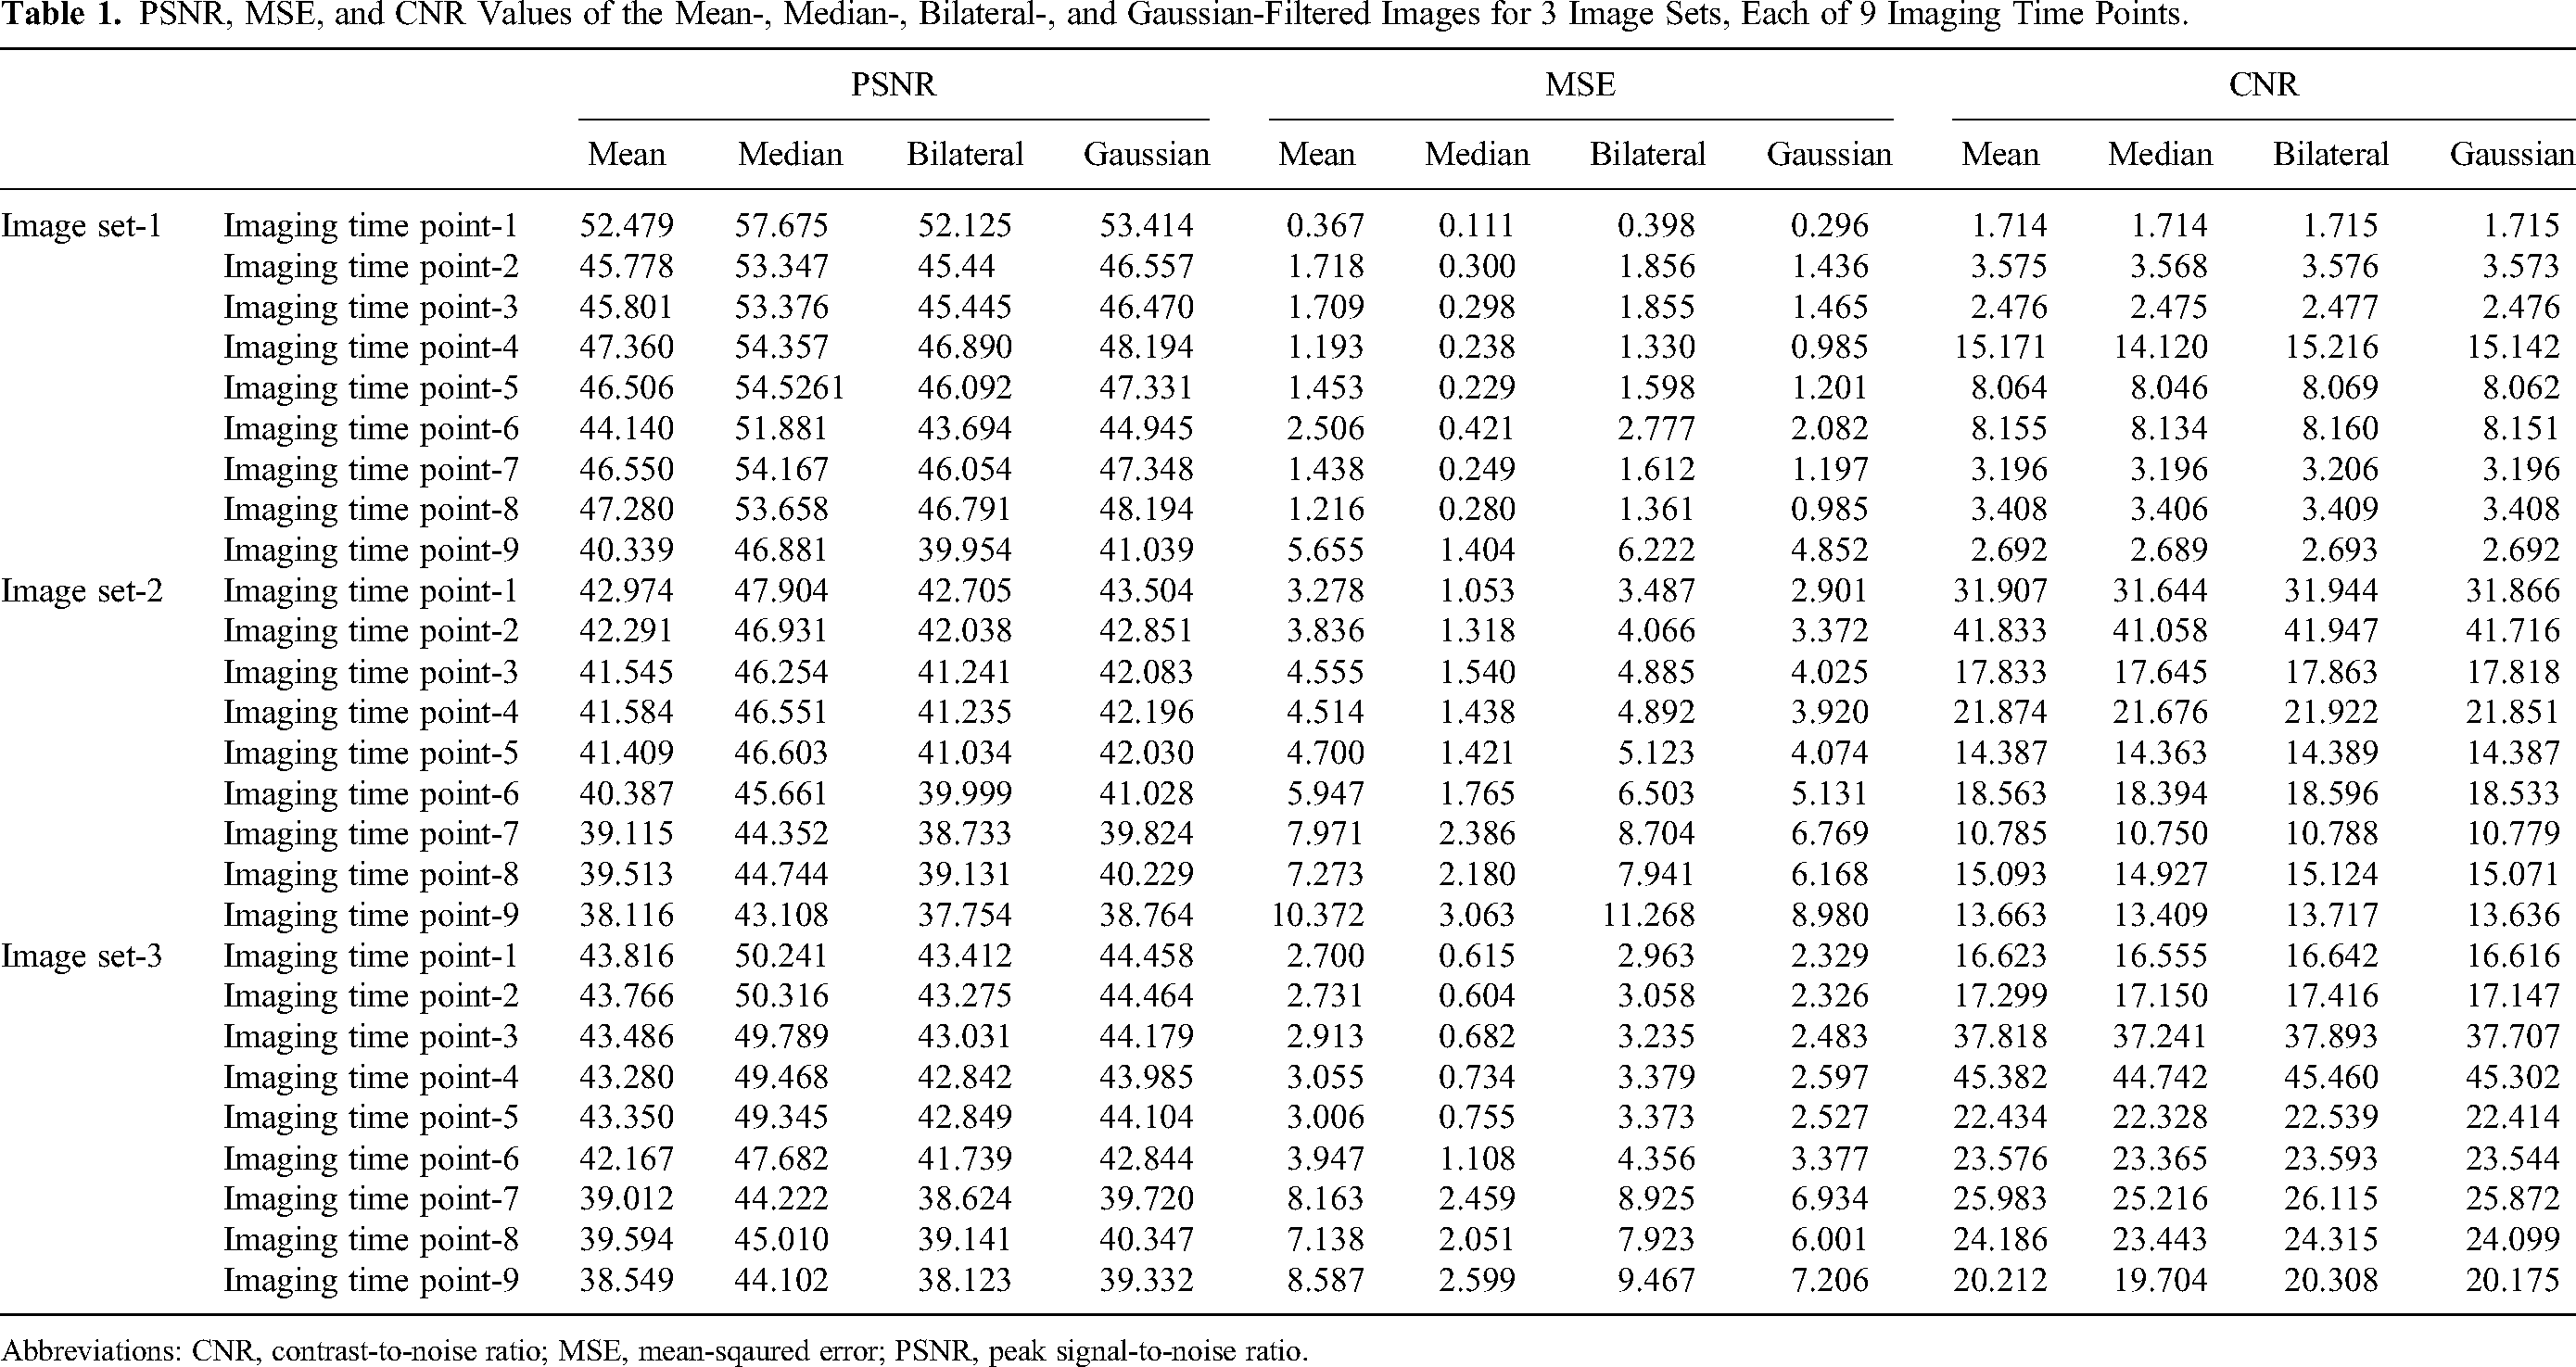
Abbreviations: CNR, contrast-to-noise ratio; MSE, mean-sqaured error; PSNR, peak signal-to-noise ratio.
Figure 6 shows the compared outcomes of the binarization, morphological operations, contouring, and feature extraction for image sets-1, 2, and 3 at imaging time point-5 as an example.

Binarization, morphological operations, contouring, and feature extraction at imaging time point for image sets-1 (0.5 agarose), 2 (0.8 agarose), and 3 (1.5 agarose) at the first, second, and third rows, respectively. To illustrate that these calculations were made for all 27 imaging time points for 3 image sets, area, perimeter, and radius values for imaging time point-5 were given here.
After binarization, morphological operations were applied to fill the intra-tumoroid spaces and eliminate nontumoroid structures, and the contours of the tumoroids borders were drawn. Finally, the radius, the perimeter, and the area calculations, which are the image features, were made by drawing the reference circles fully surrounding the tumoroids. According to these results, at imaging time point-5 for image sets-1, 2, 3; the radius of 1.590 mm, 0.940 mm, 0.730 mm; the perimeter of 12.035 mm, 7.090 mm, 4.575 mm; and the area of 6.497 mm2, 1.964 mm2, 1.390 mm2, respectively. These results showed that the area of tumoroid produced by agarose gel 0.5% (image set-1) was approximately 3.3 times the one produced by agarose gel 0.8% (image set-2) and 4.67 times the one produced by agarose gel 1.5% (image set-3). This showed the importance of the effect of agarose concentration on tumoroid growth.
To trace the evolution of tumoroid produced with MIA PaCa-2 cells at various stages of 2D growth, for image sets-1, 2, and 3 with 0.5%, 0.8%, and 1.5% agarose concentration, respectively; in Figure 7, we presented the original, contoured, binary-bordered versions of the tumoroid images acquired at 9 imaging time points.

Original, contoured, and binary images for 9 imaging time points of image sets-1, 2, and 3. In binary images, tumoroid borders and minimum enclosing circles tumoroid were drawn automatically. The tumoroids produced with 0.5% agarose concentration (image set-1), 0.8% agarose concentration (image set-2), and 1.5% agarose concentration (image set-3) showed a 33.07-, 4.33-, and 3.80 times growth increase from imaging time point-1 to imaging time point-9, respectively.
As can be seen from Figure 7, in qualitative assessment, the tumoroid with 0.5% agarose concentration given 2D images with image set-1 showed a much faster growth trend in the same time period than tumoroid with 0.8% and 1.5% agarose concentration. In the quantitative assessment as shown in Table 2, the tumoroid with 0.5% agarose concentration (image set-1) showed a 33.07 times growth increasing from 1.014 mm2 at imaging time point-1 to 33.535 mm2 at imaging time point-9. Likewise, the tumoroid with 0.8% agarose concentration (image set-2) grew up 4.33 times increasing from 1.047 mm2 at imaging time point-1 to 4.538 mm2 at imaging time point-9; the tumoroid with 1.5% agarose concentration (image set-3) showed a 3.80 times growth, increasing from 0.530 mm2 at imaging time point-1 to 2.017 mm2 at imaging time point-9. This shows that the tumoroid prepared with low-concentrated agarose gel grows much faster and the rate of tumor growth and development decreases as the agarose concentration is increased. Similarly, the perimeter and the radius of the tumoroid with 0.5% agarose concentration (image set-1) increased rapidly from 4.758 mm to 33.569 mm (7.05 times) and from 0.670 mm to 3.680 mm (5.49 times), respectively. The perimeter and the radius of the tumoroid with 0.8% agarose concentration (image set-2) increased from 4.481 mm to 12.157 mm (2.71 times) and from 0.670 mm to 3.720 mm (2.27 times), respectively. The perimeter and the radius of the tumoroid with 1.5% agarose concentration (image set-3) increased from 2.913 mm to 6.018 mm (2.06 times) and from 0.670 mm to 3.720 (2.04 times) mm, respectively.
In Figure 8, we presented the growth trend of 3 tumoroids with 0.5%, 0.8%, and 1.5% agarose concentrations over time for easy comparison by visualizing the value changes of the area, perimeter, and radius.

Growth trend of 3 tumoroids with 0.5%, 0.8%, and 1.5% agarose concentrations over time.
Discussion
When the results of the study were evaluated and compared with similar studies in the literature, it was seen that there were some similarities and differences. In a study by Alhadidi et al., 19 although the threshold method was applied to mammogram breast cancer images at the segmentation stage, the image was not clearly segmented. In our study, we applied the global thresholding method to the MIA PaCa-2 pancreatic cancer images obtained by mini-Opto tomography platform in the segmentation stage and achieved successful results in highlighting the tumoroid masses. In a study by Xie and Lu, 24 only the median filter method, which is a nonlinear smoothing technique, was used as a filter in the preprocessing stage to separate copper cores in the tiny wire. However, in our study, in the preprocessing stage, we used the mean, median, bilateral, and Gaussian filter methods comparing their performance in eliminating the noises on the images of tumoroid. In a study by Joseph et al., 39 a K-means clustering algorithm has been proposed for the segmentation of brain MRI images to extract suspicious regions. In our study, we applied the thresholding method including a variety of filtering methods as the segmentation process since we needed to separate 2 main regions, the tumoroid mass and its background.
In a study by Yang et al., 42 in addition to the importance of the partial clustering method to classify data in a certain group, it is emphasized that as the number of features in the data set increases, more clusters are needed. In our study, we used the global thresholding method in the segmentation stage to classify the pixels containing the tumoroid structure in the images. In the morphological operations that we use to obtain the closest image to the tumoroid structures after the classification process, the size selection of the core matrices (kernels) was of great importance as the importance of the cluster number in the partial clustering method. As stated in a study by Kutbay et al., 44 adjustable distant fuzzy c-means segmentation and quaternion-based convolution filters and saliency mapping procedures were applied separately to measure carotid artery intima-media thickness on 25 carotid Doppler images, and then the results were evaluated with MSE. In our study, we applied the mean, median, bilateral, and Gaussian filters for improving the quality of images and tested the performance of results by implementing the metrics of MSE, PSNR, and CNR. These are quantitative metrics that measure the target object sharpening performance of various filters applied to images with different noise levels. The high PSNR means high image quality and low image degradation, while MSE value on the same image is expected to be low and having a high CNR means achieving the high distinguishability power of the target object as well.
Cell culture platforms provide excellent preclinical research tools to study diseases such as pancreatic cancer. The computer-aided systems play an important role in the imaging of cell cultures. In this study, we comprehensively investigated the growth characteristic of pancreatic tumoroid produced with MIA PaCa-2 cancer cells by the mini-Opto tomography imaging system that has the ability to image the full size of tumoroids with up to a few cm in size. The 3 tumoroids were cultured in 0.5%, 0.8%, and 1.5% agarose gel, imaged enlarging borders of, and analyzed the growth rate of each at 9 different imaging time points. The image processing techniques such as color transformation, filtering, morphological process, thresholding, contouring, and feature extraction were applied to a total of 27 images of 3 tumoroids (image sets-1, 2, and 3), each with 9 imaging time points. In quantitative evaluation, the median filtering method provided the superior results with the values of PSNR (at each of 9 imaging time points in the range of 46.656 to 57.675 for image set-1, 43.108 to 47.904 for image set-2, and 43.981 to 50.316 for image set-3) and MSE (at each of 9 imaging time points in the range of 0.111 to 1.404 for image set-1, 1.053 to 3.178 for image set-2, and 0.604 to 2.599 for image set-3). In the CNR metric assessment, the bilateral and Gaussian filters gave the highest CNR values (i.e., Gaussian filter: at each of 9 imaging time points in the range of 1.715 to 15.142 for image set-1, 10.779 to 41.716 for image set-2, and 11.974 to 45.302 for image set-3) compared to the CNR values of median-filtered images because the median filter caused smoother images and smoothing produced lower CNR values. As image features of 3 tumoroids, the radius, perimeter, and area of tumoroid with 0.5% agarose concentration were 0.670 mm, 4.758 mm, and 1.014 mm2 at the imaging time point-1; 3.680 mm, 33.569 mm, and 33.535 mm2 at the imaging time point-9, which means the tumoroid grew up to 33.07 times in area-size over this period. Similarly, the area of tumoroid with 0.8% agarose concentration was 1.047 mm2 at the imaging time point-1; 4.538 mm2 at the imaging time point-9 (indicates 4.33 times growth), the area of tumoroid with 1.5% agarose concentration was 0.530 mm2 at the imaging time point-1; 2.017 mm2 at the imaging time point-9 (indicates 3.80 times growth).
The results showed that using the combination of the image processing techniques (with OpenCV tools in Phyton) and the mini-Opto tomography imaging system was useful for observing the changes and growth of a biological sample such as a tumor in the manner of automatically drawing the contours of it and calculating the contour areas of its boundaries. To propose the observation of the tumoroid characterization could assist cancer researchers is one of the critical key points of this study. This study encouraged us to create a mathematical model of the tumor-growing behavior at a time point of imaging and interpreting the growth of the various cancer structures at certain time intervals for our next studies.
Conclusion
The tumoroid cultured with low-concentrated agarose gel grew much faster and the tumoroid growth trend decreased as the agarose concentration was increased in the same time period. A reference circle generated automatically that has a minimum diameter fully surrounding the tumoroid was recommended to predict the future potential borders of the tumoroid. Calculations of area, perimeter, and radius parameters for image sets of 3 different tumoroids gave insight into the growth of the respective tumoroid. Thus, we suggested that these parameters could be used to trace such tumoroids in similar studies. In conclusion, we proposed a system that combines image processing techniques and the mini-Opto tomography imaging platform to trace the 2D growth of tumoroids in a limited time interval and estimate the area these tumoroids would occupy over time.
Footnotes
Abbreviations
Declaration of Conflicting Interests
The authors declared no potential conflicts of interest with respect to the research, authorship, and/or publication of this article.
Ethical Approval
Not required.
Funding
The authors received no financial support for the research, authorship, and/or publication of this article.
Correction (July 2023):
The article type has been updated.