
Abstract
Keywords
Introduction
The use of computerized tomography (CT) has increased the frequency of incidentally found peripheral pulmonary nodules (PPNs). 1 Most suspected malignant nodules found by chest CT were more frequently diagnosed by nonsurgical biopsy over surgical diagnosis. 2 The bronchoscopic sampling of PPNs has been common, but it still is considered difficult.
The first and key challenge is to navigate the radial endobronchial ultrasound (rEBUS) to visualize the PPNs. It is accepted that the diagnostic yield of rEBUS-visible lesions is significantly higher than that of invisible lesions. So, various methods have attempted to optimize the rEBUS-visualization yield of PPNs, such as virtual bronchoscopic navigation (VBN), electromagnetic navigational bronchoscopy, x-ray fluoroscopy, etc.3,4,5 However, some nodules still can’t be visualized by rEBUS, even with the assistance of these technologies, which would lead to a lower diagnostic yield of bronchoscopy. Therefore, it is necessary to identify which nodules are likely to be successfully visualized by rEBUS before the examination.
The traditional method of predicting the rEBUS-visibility of nodules is according to the CT-bronchus sign, which is the presence of an air-filled bronchus either passing through or immediately adjacent to a PPN as seen on CT, but its effectiveness may be unsatisfactory. In order to solve this problem, this study developed an innovative predictive method based on VBN. It has been proven that the lesion's size (S) and distance from the hilum to the lesion are significant factors of rEBUS visualization yield.6,7 Due to the complexity of measuring the distance from the hilum to the lesion, this study replaced it with the shortest straight-line distance (D) from the terminal point of the virtual navigation path to the localization point of the lesion (shown in Figure 1). The D value will be automatically and accurately shown after the target nodule is located in the VBN system. Therefore, this study establishes an innovative model—the S/D ratio—to predict the visibility of PPNs.

The simulation diagram of the meaning and source of the D value. (a) The lesion with the CT-bronchus sign; (b) the lesion without the CT-bronchus sign.
Up to now, there is no article reporting an adequately quantified standard to distinguish the rEBUS-visibility of nodules beforehand. This study is the first report to propose a new method to identify beforehand which nodules are likely to be successfully visualized by rEBUS. It will help doctors choose an appropriate strategy for diagnosing PPNs.
Materials and Methods
A retrospective study was conducted from January 1, 2017, to December 31, 2021. Patients with unexplained PPNs were enrolled, between 8 and 30 mm, in the pulmonary and critical care medicine of the Affiliated Hospital of Ningbo University. Patients from January 1, 2017, to December 31, 2020, were enrolled in a training dataset to build a predictive model. From January 1, 2021, to December 31, 2021, patients were then enrolled to validate the external predictive accuracy of the predictor. The subjects without the standard CT format of the navigation system were excluded. Due to the defects of CT quality, subjects who failed in the 3-dimensional reconstruction of the bronchial tree by navigation software were also excluded (shown in Figure 2). The biopsy for PPNs followed the widely accepted Fleischner Society guidelines. 8 This retrospective study was approved by the Ethics Committee of a tertiary public hospital (Ningbo, China; KS20228015; 26 August, 2022), and the need for informed consent was waived. Clinical information regarding patient characteristics was based on patient records and registries.

Training dataset and validation dataset screening flowchart.
All subjects underwent multiplanar reconstruction (cross-section, sagittal plane, and coronal plane) based on thin sliced CT. All pulmonary nodules were diagnosed by 2 experienced radiologists. And the CT-bronchus sign is independently judged by 2 experienced pulmonologists who were blind to the final rEBUS-visibility of nodules. VBN pre-procedure planning was performed using multiplanar formatting of Digital Imaging and Communications in Medicine (DICOM) data from CT (slice thickness 1.0 mm with Standard B type). Navigation software performed the 3-dimensional reconstruction of the bronchial tree from DICOM images. We manually located the nodule in the VBN system (DirectPath, Olympus Ltd), and the anchor point was located where the nodule's edge is closest to the target bronchi (shown in Figure 1). The localization points of all nodules were selected according to this standard in this research. Subsequently, the platform developed a best fit pathway from the trachea to the target lesion. If more than one bronchus leads to the lesion, we chose the bronchus whose terminal is closest to the target lesion, that is, the path with the smallest D value. This pathway was independently verified by more than 2 research investigators to ensure that it was recognized as the closest to the target lesion. Pathways/airway maps generated were not manually edited after creation by the software platform. The shortest straight-line distance (D) will be shown directly after the lesion is located in the navigation system (shown in Figure 3). Moreover, the maximum diameter of lesions was measured and defined as the size of the lesion (S).
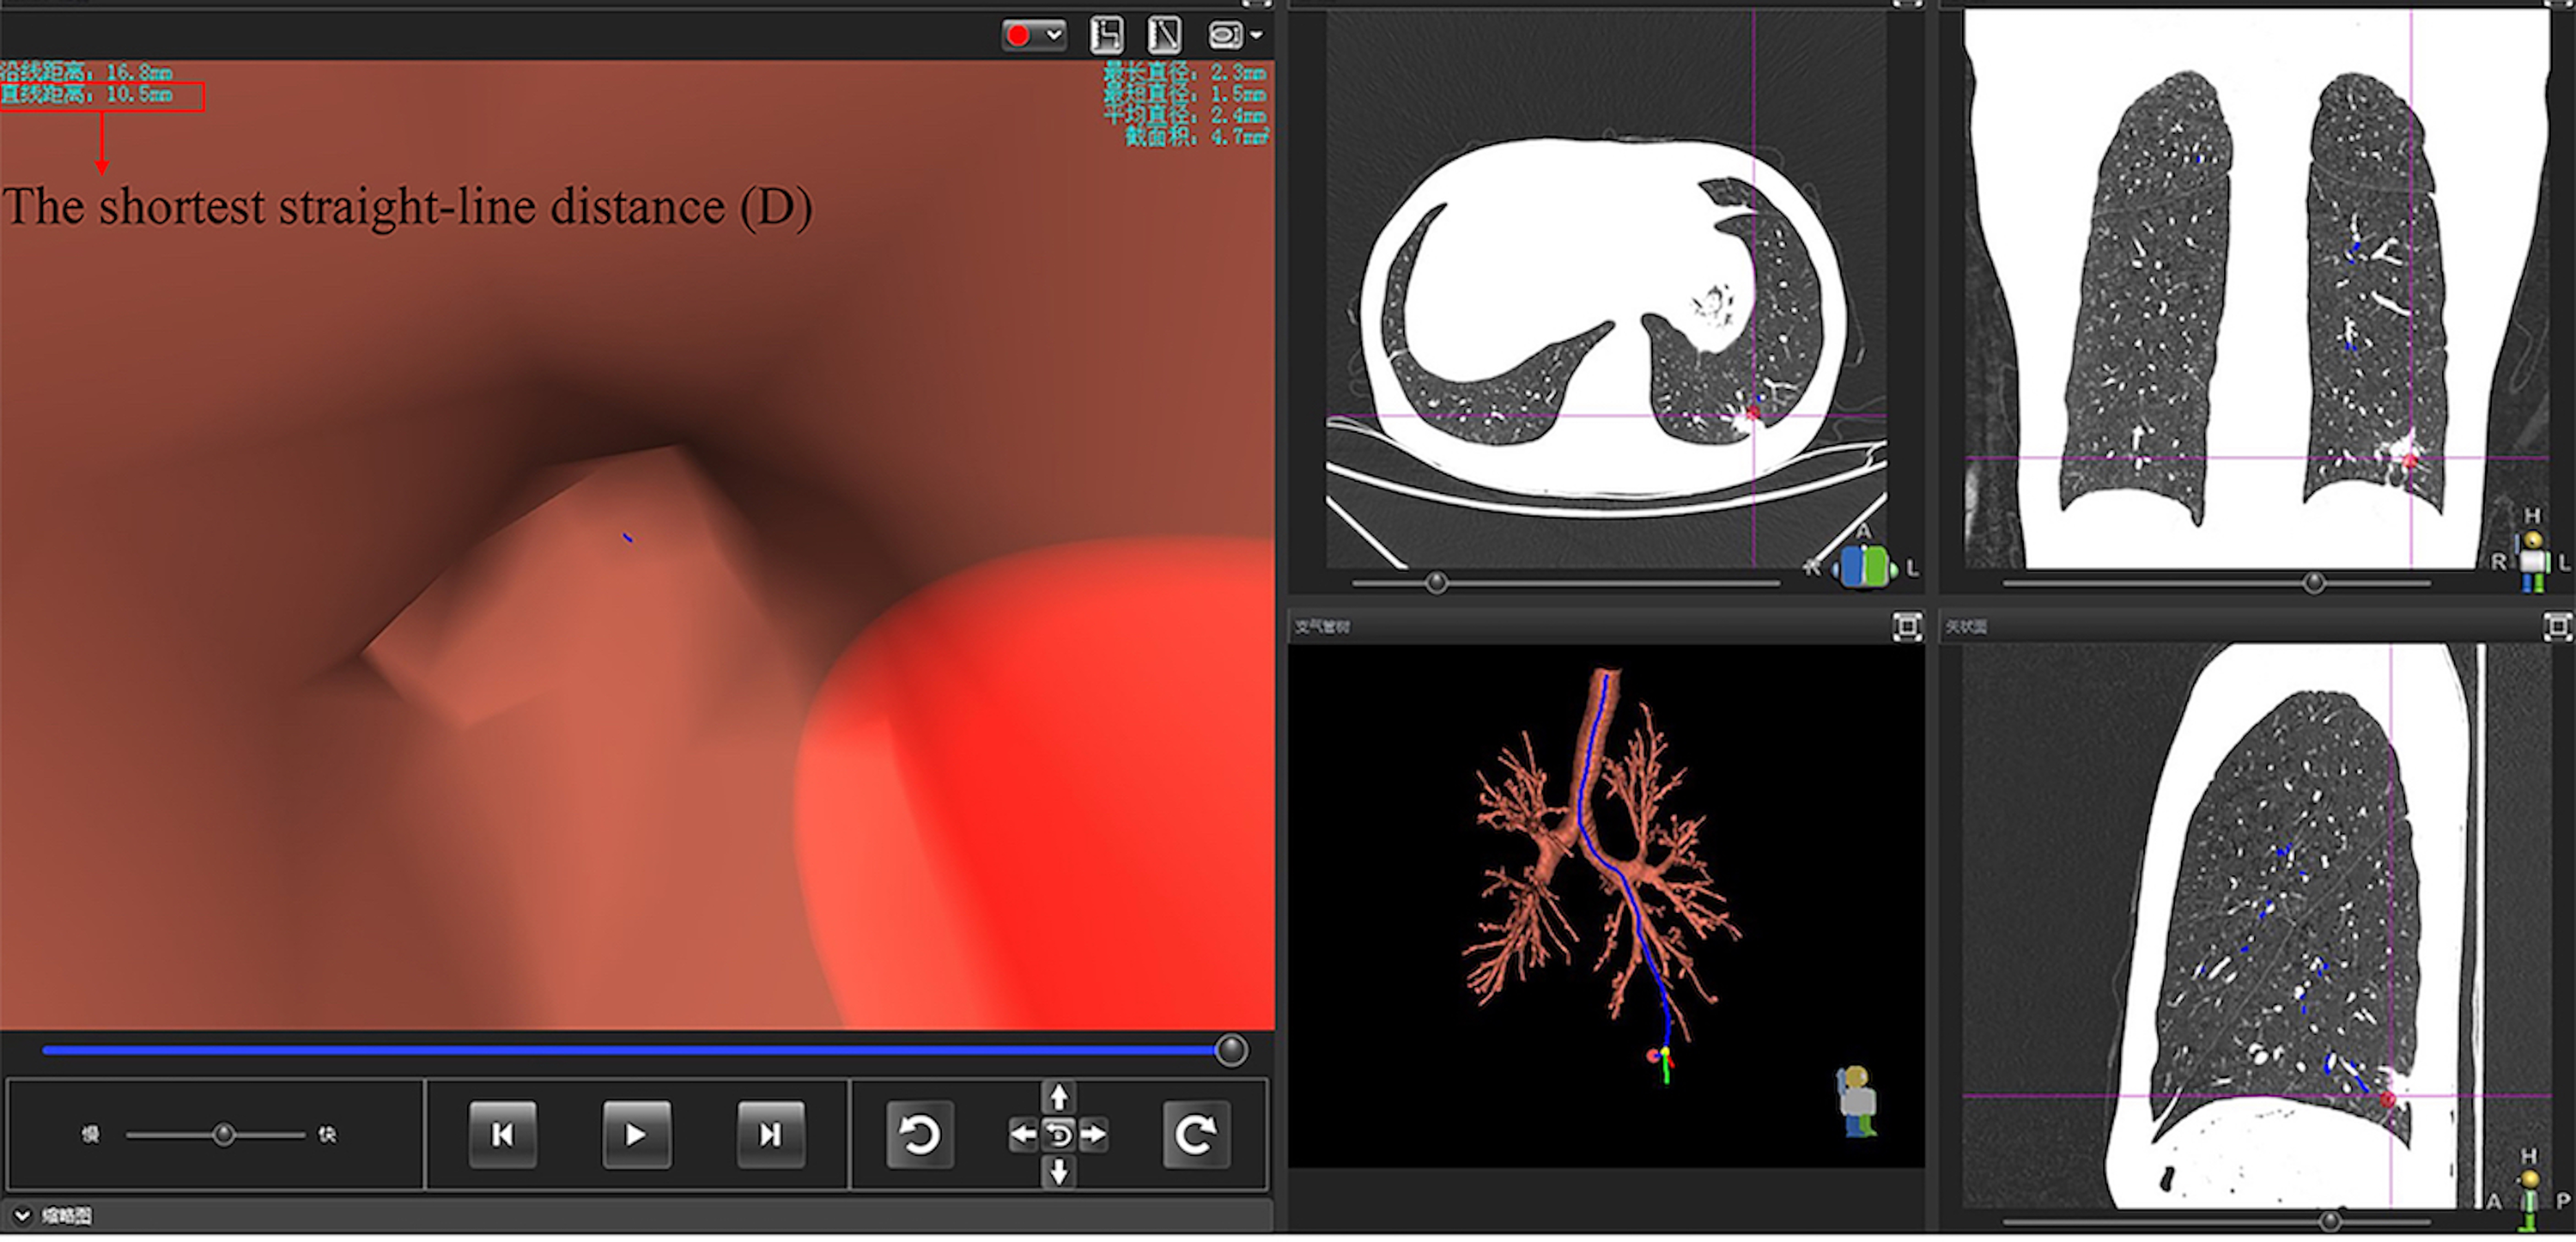
The shortest straight-line distance shown in the virtual bronchoscopic navigation system.
Bronchoscopy procedures were carried out using VBN system and bronchoscope (BF-1T260 or BF-P-260F, Olympus Ltd). The guide-sheath kit (K201, Olympus Ltd) was combined with the rEBUS probe (UM-S20-17S, Olympus Ltd).The bronchoscope was advanced to the target bronchus following the navigation of VBN system. The radial probe with the guide sheath (GS) was inserted into the working channel of the bronchoscope and advanced without fluoroscopic guidance. After detecting the low echo area, the position of the ultrasound probe needs to be adjusted until the area of the abnormal echo area reaches the maximum size. If the rEBUS probe is “within” or “adjacent to” the lesion, it means the lesion was visualized by rEBUS. Otherwise, it is invisible.
Descriptive statistics are presented as frequency, percentage, and median ± standard deviation (range). It comprised of the baseline clinical data of patients in the training and validation dataset. The measurement data between groups were performed using the student's T-test. The enumeration data is described in the form of frequency (percentage), and the χ2 test was used to perform the comparison between groups. Data of the D factor, the S factor, and rEBUS imaging were collected and analyzed. A receiver operating characteristic (ROC) curve was drawn to understand the S/D ratio predictive model. The Youden index and the area under the curve (AUC) are calculated to verify the discriminatory power of the predictor. The optimal cutoff value was determined at maximized sensitivity and specificity according to the commonly employed Youden-Index in ROC curve analysis. The sensitivity, specificity, positive predictive value (PPV), negative predictive value (NPV), and accuracy were used to evaluate the performance of the predictor at the optimal cut-off point in the validation dataset. They were also used to assess the predictive performance of the CT-bronchus signs. The visualization yield by rEBUS for PPNs and the diagnostic yield of bronchoscopy were reported using summary statistics. And statistical significance was set at P < .05. IBM SPSS Statistics 26 (IBM Corporation, New York, USA) was used for all statistical analyses.
Results
Subjects and Lesions
This study enrolled 306 subjects with PPN and underwent the VBN-rEBUS-guided biopsy. Two-hundred fourteen cases were enrolled in the training dataset, including 131 males (61%) and 83 females (39%). The mean size of PPNs was 20.9 ± 5.9 (8.6 to 29.8) mm. The validation dataset has 92 cases, including 60 males (35%) and 32 females (65%). The mean size of PPNs was 19.8 ± 6.5 (8.8 to 29.6) mm. The comparison of baseline characteristics of patients in the training dataset and the validation dataset is summarized in Table 1. There was no significant difference between these 2 groups.
Comparison of Baseline Characteristics of Subjects in the Training Dataset and Validation Dataset.

The CT-Bronchus Sign
All subjects were divided into 2 groups according to the status of CT-bronchus sign, the positive group of 220 (72%) cases and the negative group of 86 (28%) cases (Table 2). This study evaluated the performance of the CT-bronchus sign in distinguishing the lesions’ rEBUS visibility. The sensitivity, specificity, PPV, NPV, and accuracy were 81%, 79%, 95%, 43%, and 81%, respectively (Table 3).
The Cross-tabulation of the Status of CT-Bronchus Sign and the Visibility of rEBUS for PPNs.

Abbreviations: PPNs, peripheral pulmonary nodules; rEBUS, radial endobronchial ultrasound.
The Predictive Performance of the S/D Ratio Model and the CT-Bronchus Sign for the rEBUS-Visibility of Nodules.

Construction and Verification of Prediction Model
Between January 1, 2017, and December 31, 2020, a retrospective cohort of 214 patients with PPNs was used to construct the predictive model. This work has analyzed the relationship between the S/D value and the rEBUS-visibility of PPNs by drawing a ROC curve (shown in Figure 4). The optimal cut-off point of the S/D ratio model was 1.84 with the maximum Youden index of 0.65, and this threshold has a large AUC of 0.85 (95% CI: 0.76-0.95). A second retrospective cohort of 92 patients between January 1, 2021, and December 31, 2021 was used to test the model independently. The validation results show that this prediction model at the optimal cut-off point of 1.84 has a good performance, and its sensitivity, specificity, PPV, NPV, and accuracy are 81%, 100%, 100%, 71%, and 87%, respectively (Table 3).
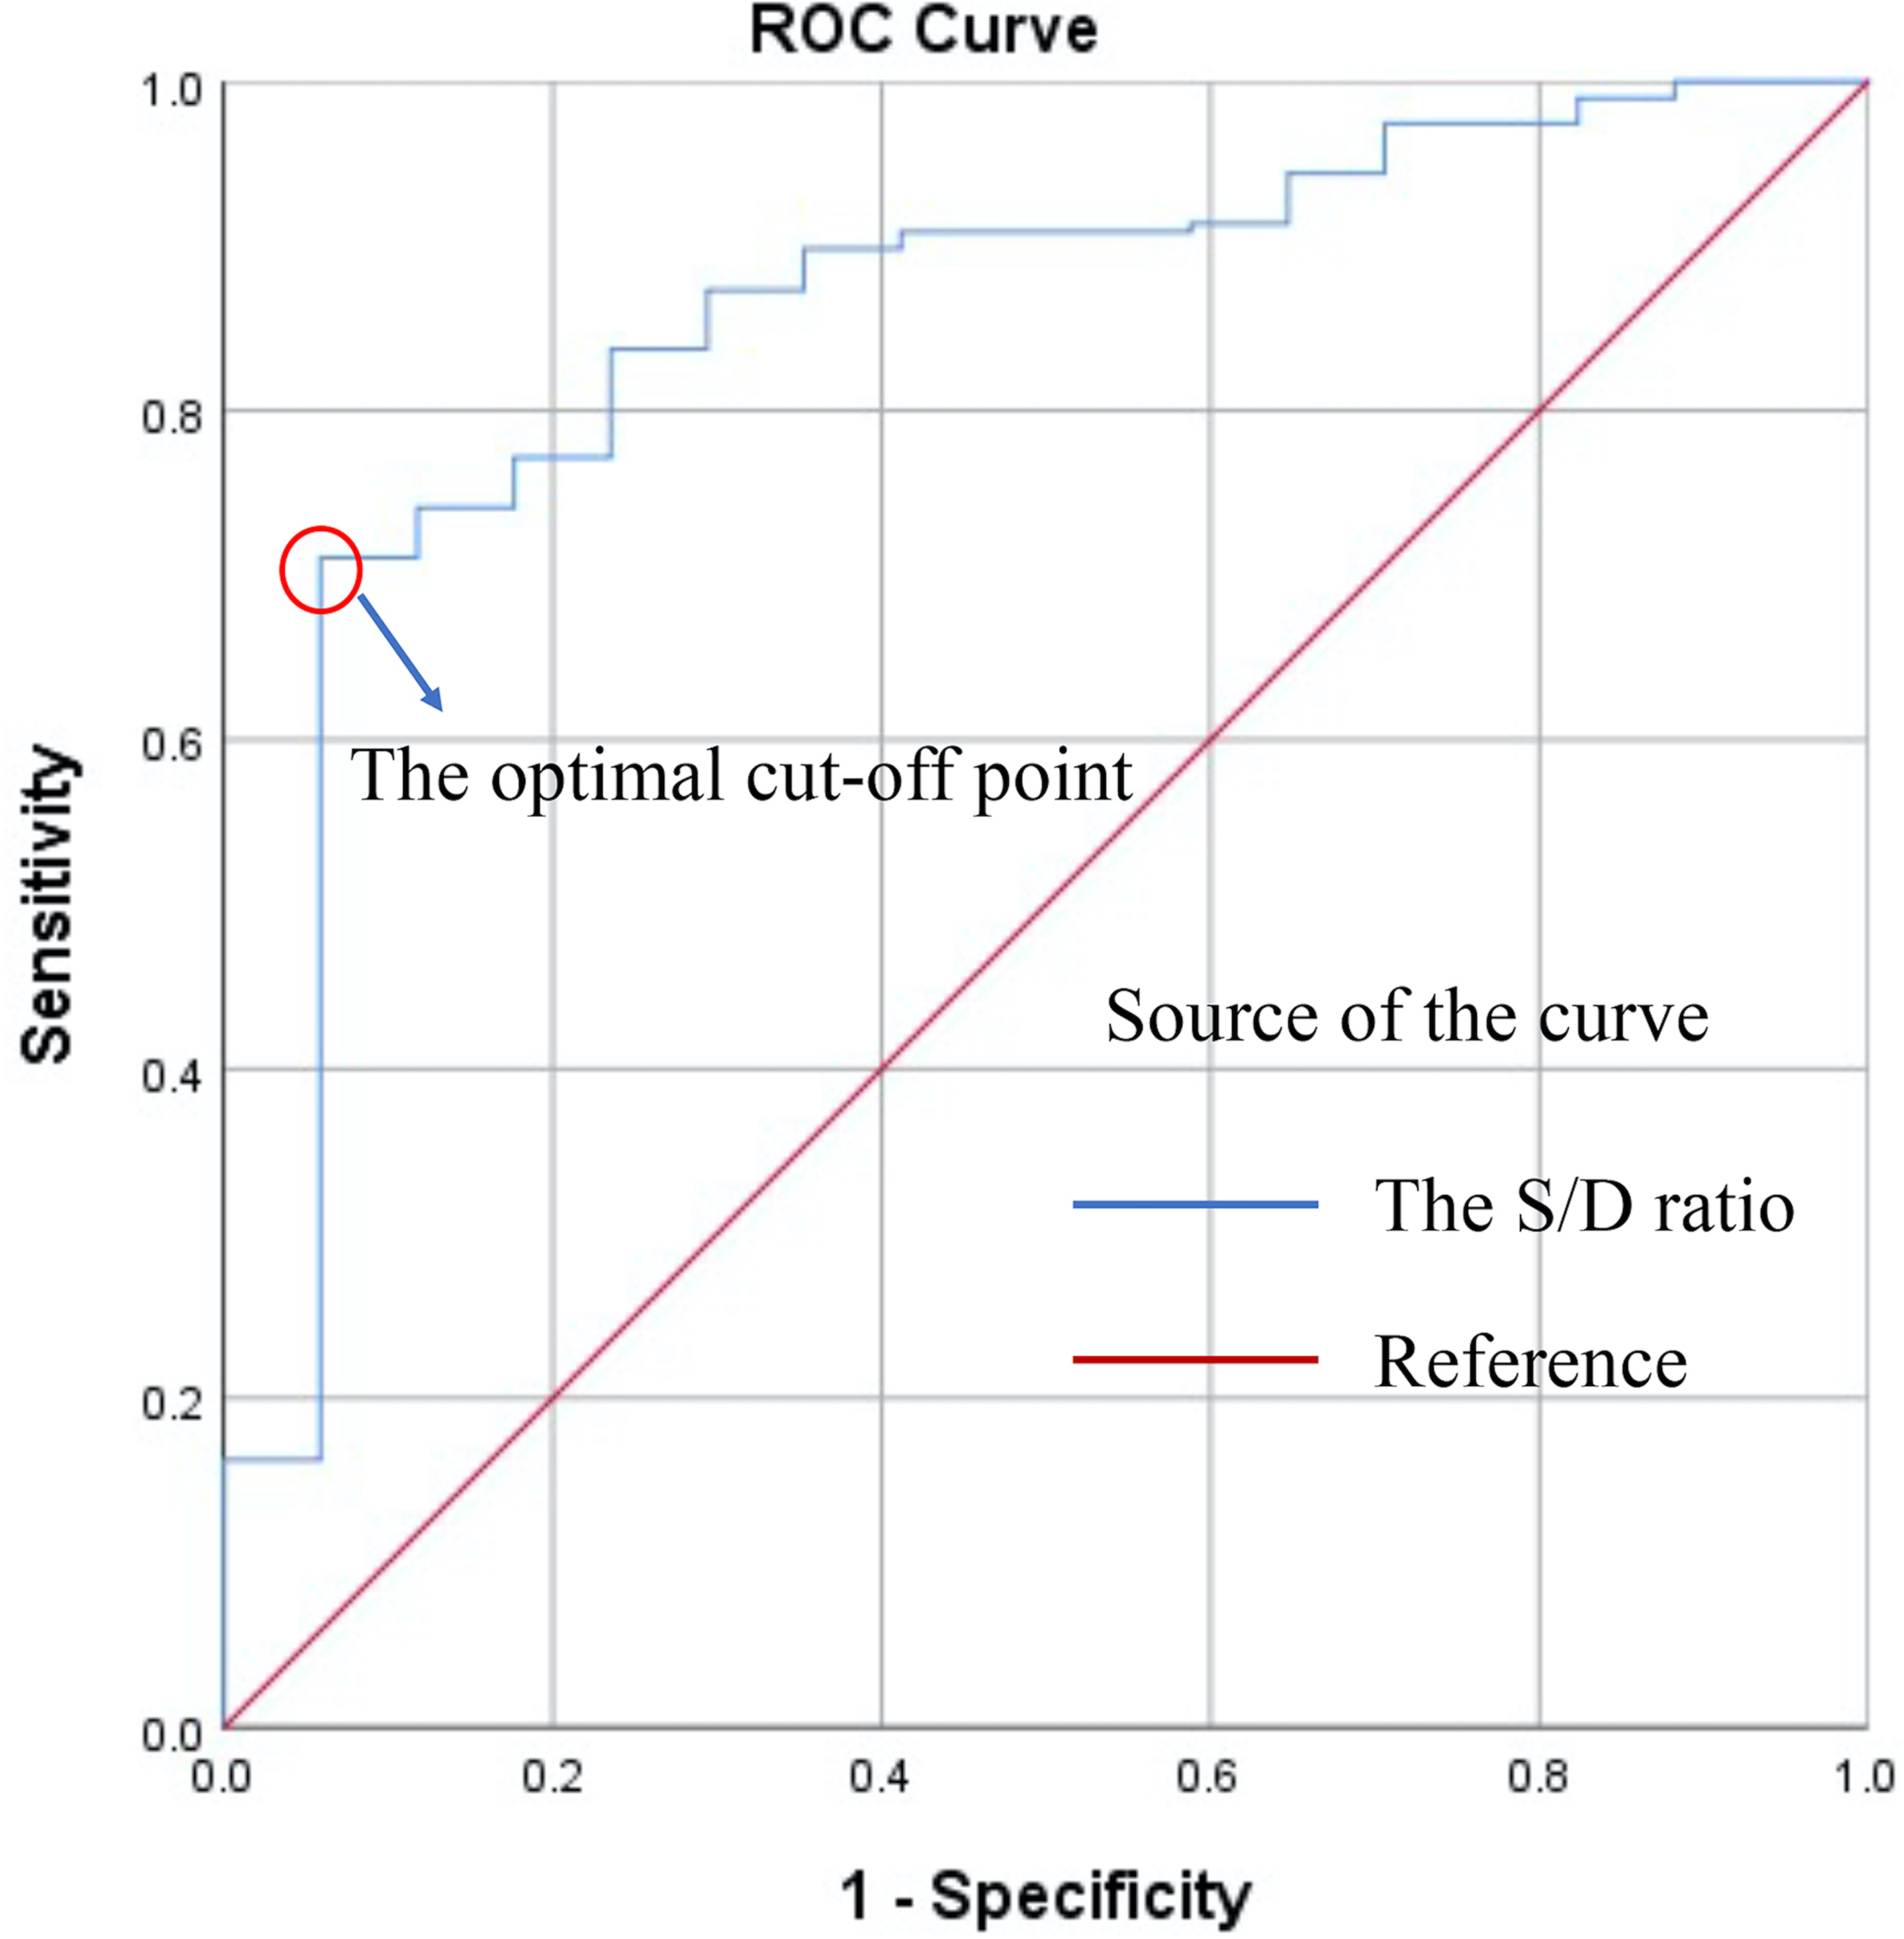
ROC curve for the S/D ratio predictive model.
Discussion
It has been demonstrated that rEBUS was significant for improving the diagnostic yield of PPNs.3,9 Therefore, many auxiliary means were used to improve the rEBUS-visualization yield of nodules. Fluoroscopic guidance is the most widespread but not yet popular in some centers concerned about radiation exposure. VBN is regarded as a relatively more economical and less harmful guidance method and is even equally effective with fluoroscopic guidance in diagnosing PPNs.10,11 However, in a few cases, the nodule could not be visualized by rEBUS, even if those techniques were used in combination. If transbronchial biopsy is performed on these rEBUS-invisible nodules, it will present a particular problem that it becomes a “blind” biopsy. Hence, it seems urgent to differentiate beforehand which nodules are likely to be successfully visualized by rEBUS to guide the clinical choosing a suitable diagnostic strategy. According to previous publications, lesion size, location, and bronchus sign status (present or absent) are all factors related to the rEBUS-visibility of nodules.4,12,13 Although these and other factors may contribute to the visualization yield, their effect on the success of visualization has yet to be adequately quantified. This highlights the need to develop a prediction model—the S/D ratio—to solve this problem. And this study has investigated the value of this innovative model based on VBN system automatic measurement in predicting the rEBUS-visibility of nodules.
In order to get the D value, the critical step is to select the localization point of target nodules in the VBN system. At present, there is no clear operational guideline for locating the target lesions in the VBN system. The CT-bronchus sign deserves our attention according to prevailing circumstances and our vast experience. Many reports have shown that the CT-bronchus sign is a significant factor in the diagnosis of PPNs.14,15 There is no doubt that the CT-bronchus will play an essential role in developing an appropriate navigation path. So, the preferred localization point was where the lesion's edge is closest to the target bronchus, both in lesions with and without the CT-bronchus sign (shown in Figure 1). After choosing an appropriate localization point, the virtual navigation path will be generated automatically by the VBN system. The shortest straight line distance (D) from the end of the chosen navigation path to the localization point will be accurately shown on the VBN system, and we only need to record it.
Two-hundred fourteen lesions in the training dataset were enrolled to construct the prediction model. A ROC curve was drawn to understand the S/D ratio predictive model. The optimal cut-off point of the curve was 1.84, at which point the AUC was 0.85 (95% CI: 0.76-0.95). It has demonstrated the excellent discriminatory ability of the S/D ratio model for the rEBUS visibility of PPNs. In addition, the S/D ratio model also proved to have a satisfactory discriminatory performance in the validation dataset. Compared to the traditional prediction method based on the CT-bronchus signs, the S/D ratio model has higher specificity, PPV, NPV, and accuracy, especially NPV (71% vs 43%). Thus, this shows that the S/D ratio model is more reliable than the conventional one based on the CT bronchial sign in identifying beforehand which nodules are likely to be successfully visualized by rEBUS.
An important conclusion was obtained that is if the S/D ratio of the lesion is greater than 1.84, it will be visualized by rEBUS. Therefore, it is reasonable to recommend the bronchoscopic sample collection of these nodules under VBN-rEBUS guidance, which is feasible and safe.16,17 For another part of nodules with the S/D ratio less than 1.84 may not be visualized by rEBUS, which may have a poor diagnostic yield by bronchoscopic biopsy. Even with the assistance of fluoroscopy, the diagnostic yield of those nodules may still be limited. Because the nodule is too small to be visualized by fluoroscopy frequently. 18 Thence they will not be recommended to undergo forceps biopsy under bronchoscopy. Transbronchial needle aspiration is an effective technique for the diagnosis of PPNs when the rEBUS probe cannot reach the lesion. 19 Because it can puncture the lesion directly through the bronchial wall and even establish an open channel for subsequent brushing and forceps biopsy, thus increasing the diagnostic yield. However, the premise is that the operation must be guided by fluoroscopy to control the needle insertion direction. In addition, the yield of CT-guided percutaneous lung biopsy has reached 93% (95%CI: 90-96),20,21 which may also be a suitable method for these rEBUS-invisible nodules.22,23 This finding will help physicians choose the appropriate strategy to maximize diagnostic yield prior to biopsy procedures, thereby reducing the probability of re-biopsy and saving the patient's medical expenditure.
Obtaining adequately cytological or histological specimens from visible nodules is the second challenge for bronchoscopy. As reported in previous articles, some factors could contribute to the deficit between the rEBUS visualization yield and the diagnostic yield of bronchoscopy. First, a suitable biopsy tool may help improve the diagnostic yield. For these rEBUS-visible nodules which do not invade the airway mucosal, forceps biopsy has a low diagnostic yield, whereas cryobiopsy will have good performance due to its greater penetrating power.24,25,26,27 Second, to avoid the low diagnostic yield caused by insufficient sampling, in this study, more than 5 biopsy specimens were taken from each nodule by using standard biopsy forceps. Third, the rapid on-site cytologic evaluation will be beneficial in improving the diagnostic yield of bronchoscopy.28,29,30,31 Therefore, operators should consider these factors, which may contribute to the failure of the rEBUS visualization yield entirely translated into the diagnostic yield of bronchoscopy, to narrow the difference between the two.
The following limitations were found in this study. First, this predictive model based on the DirectPath navigation system. Differences in measurements due to devices with different segmentation algorithms result in our results not being directly extrapolated to other navigation systems. Second, the number of rEBUS-invisible nodules is relatively limited. Third, although the optimal position of the radial probe was determined by combining navigation system, chest CT (cross-section, sagittal plane, and coronal plane) and GS exploration, it was not confirmed by fluoroscopy. Undeniably, this will result in a fraction of nodules that can actually be visualized by rEBUS being ignored. In addition, the user's ability to grow or extend the pathways generated is not utilized in this study. Although this method may limit the universality of the research results, we specifically avoid manually extending a bronchial route to the lesions, because it may bring human errors to the drawing process that already relying on software algorithms, and the error rates of software algorithms has not been reported yet. Finally, all candidates were enrolled from this single center, which will result in that the results of S/D ratio cannot be directly reproduced to other institutions. We can do multi-center research to verify this predictive model in the future.
Conclusion
We established and validated a valuable model for identifying beforehand which nodules are likely to be successfully visualized by rEBUS. If the S/D ratio of the nodule is greater than 1.84, it will be visualized by rEBUS. The finding will help the clinician choose a suitable diagnostic strategy in pre-operation to improve the diagnostic yield of bronchoscopy.
Footnotes
Abbreviations
Acknowledgments
We thank all the patients and all members’ contributions to this study.
Declaration of Conflicting Interests
The authors declared no potential conflicts of interest with respect to the research, authorship, and/or publication of this article.
Ethical Statement
This study was performed in line with the principles of the Declaration of Helsinki. Approval was granted by the Ethics Committee of the Affiliated Hospital of Medical School of Ningbo University (Ningbo, China; KS20228015; 26 August, 2022), and the need for informed consent was waived. The authors are accountable for all aspects of the work in ensuring that questions related to the accuracy or integrity of any part of the work are appropriately investigated and resolved.
Funding
The authors disclosed receipt of the following financial support for the research of this article: This work was supported by the Affiliated Hospital of Medical School of Ningbo University Youth Talent Cultivation Program (FYQM-LC-202003), Ningbo Social and Scientific Development Fund (2015C50012), Ningbo Health Youth Technical Key Talents Training Special Project (2020SWSQNGG-05), the Natural Science Foundation of Ningbo (2018A610271, 2017A610250), Ningbo Medical Science and Technology Plan Project (2021Y13), Zhejiang Provincial Health Science and Technology Plan (2022RC247), and Medical Health Science and Technology Project of Zhejiang Provincial Health Commission (2016KYB268).