
Abstract
Keywords
Introduction
Laryngeal squamous cell carcinoma (LSCC) is strongly associated with tobacco smoking and alcohol consumption, with a multiplicative effect between the two.1–3 During the past 2 decades, with the rising awareness of tobacco smoking and alcohol consumption's adverse health effects, along with the achievements of tobacco and alcohol-control programs, we have witnessed a global decrease in tobacco and alcohol use.3,4 The reported smoking rate among adults decreased by 25.8% from 20.9% in 2005 to 15.5% in 2016. 5 Moreover, the age-standardized mortality rate of alcohol-related LSCC decreased by 1.78% per year, whereas the death number has increased by 29.2% during the study period. 4 Overall, the 5-year relative survival rate improved from 52.7% to 65.9% for patients with head and neck cancers in recent years. However, no change in survival was observed for patients with LSCC. 6 This suggests that smoking and drinking are not the only potential risk factors affecting patient outcomes.
It has been reported that non-smoking, non-alcohol drinking (NSNA) patients are 2 distinct subpopulations from smoking and alcohol drinking (SA) patients.7–9 Results from the current few studies have been controversial whether smoking and alcohol consumption have negative effects on the prognosis of patients, and whether the clinicopathological features of NSNA and SA patients are consistent, with some studies pointing out both smoking and drinking were linked to a higher risk of death,7,10 while other studies showed that the prognosis of NSNA patients is no different from that of SA patients.11–13 Therefore, it is imperative to recruit a large cohort of LSCC patients with or without traditional risk factors of smoking and alcohol consumption to confirm this prognostic role.
For the analysis of the effects of smoking and drinking on LSCC patients, there are often a variety of interferences brought by clinicopathological features and sociodemographic characteristics that affect the prognosis of patients. There were few reports in the past and the sample size was inadequate. Therefore, survival outcomes remain controversial and independent prognostic factors are rarely revealed. Herein, we retrospectively collected data from 1224 patients with LSCC who underwent primary surgical treatment between January 2005 and December 2010. The study focused on demographic, clinical outcomes, and prognostic factors associated with or without smoking and alcohol consumption.
Materials and Methods
Study Population
The clinical data of 1735 consecutive LSCC patients confirmed by postoperative pathological analysis in the Department of Otorhinolaryngology, Eye & ENT Hospital, Fudan University from January 2005 to December 2010 were retrospectively analyzed. All patients received primary surgical treatment with or without adjuvant therapy. Multidisciplinary teams discuss diagnosis and alternative treatment options with patients and their families to help them make treatment decisions. All patients provided written informed consent to participate in the analysis of clinical data. All patients were followed up and their vital status at the last follow-up was recorded. This study is a retrospective study. Only the clinical data of the patients was collected, and the treatment plan of the patients was not intervened. The researchers will try their best to protect the information provided by patients from disclosing their personal privacy. The researchers have de-identified all patient details. The Ethics Committee of Eye & ENT Hospital deemed this study exempt from review.
Definition of Variables and Data Collection
All variables based on sociodemographic, clinical, and histopathological data and surgical treatment were recorded. Demographic characteristics (ie, age, gender, etc.) and lifestyle habits (including SA status) data were collected via self-reported questionnaires distributed at admission. Patients were asked to report the total number of years of smoking and the average level of cigarette consumption per day. In the area of alcohol consumption, information was collected on the average number of drinks per week and the total number of years of drinking. Smokers were defined as those who had smoked at least 10 pack-years cigarettes in their lives. Patients were considered to be drinkers if they drank at least one drink per week continuously for at least 6 months. Patients were then categorized into 4 groups, NSNA group, smoking only group, alcohol-drinking only group, and SA group. TNM staging was determined according to the AJCC staging classification (seventh edition, 2010). Clinical follow-up of patients after treatment was performed termly. Three pathological parameters, tumor length (L), tumor width (W), and tumor height (H), were used to determine the tumor size. The following formulas have been widely used and confirmed previously.14,15 The formula for tumor diameter was determined using the maximum dimension of the tumor mass: tumor diameter = L. The formula for tumor area was determined by multiplying the tumor length by the tumor width: tumor area = L × W. The formula for tumor volume was determined using the ellipsoid volume calculation: tumor volume = π/6 × L × W × H. Postoperative complications were defined as the occurrence of one or more of the following: laryngostenosis, granulation tissue, infection of incisional wound, incision bleeding, aspiration pneumonia, pharyngeal fistula, and tracheostomal stenosis.
Follow-up Time and Protocol
All time-to-events were calculated from the date of initial surgical treatment, and the overall survival (OS) and disease-free survival (DFS) were the endpoints of the survival outcome analyses. Clinic or telephone follow-ups were the main methods for follow-up. The rate of lost to follow-up is 8.4%. The follow-up period is 12 months. Follow-up continued until death, loss to follow-up, or the last follow-up date of November 2017.
Statistical Analysis
Ten-year OS and DFS were calculated using the Kaplan–Meier method and log-rank (Mantel–Cox) test and were selected for the evaluation of the oncologic results. The univariate and multivariate Cox proportional hazard regression models were used to determine the effect of the variables on oncologic outcomes. The chi-square test was used to compare demographic characteristics between NSNA patients and SD patients. A propensity score matching (PSM) applying the method of nearest neighbor matching within a specified caliper distance (calipers of width equal to 0.02) without replacement was used to assess the effects of smoking and drinking, in order to minimize the potential confounding bias which could influence the results. The NSNA patients were 1:1 matched on age, gender, primary tumor site, pT stage, clinical stage, maximum diameter of tumor, tumor volume, tumor area, resection margin, postoperative complications, and treatment option with SA patients. The predicted values of the parameters were determined by means of the receiver operating characteristic (ROC) curve analysis. Statistical analysis was performed using IBM SPSS Statistics (version 22.0; IBM). Differences were considered significant if the P value was <.05. The reporting of this study conforms to strengthening the reporting of observational studies in epidemiology guidelines. 16
Nomogram Building and Calibration Curve
Based on the results of independent prognosis analysis, we built a nomogram by “rms” package to facilitate the application of the prognosis signature. Calibration curves and ROC curves were used to verify the validity of the signature.
Results
Study Population
Patients were classified into different groups based on the presence of alcohol or tobacco consumption. A total of 415 patients (23.92%) were identified as NSNA from 1735 patients with LSCC, while SA patients represent approximately 46.63% (809/1735) of the LSCC population. Moreover, 28.01% of the patients had a history of smoking but no history of alcohol drinking, and only 1.44% of the patients had a history of alcohol drinking but no history of smoking (Table 1). We found significant differences between the NSNA patients and SA patients. The SA patients were predominantly patients ≤60 years old (57.73%), while the NSNA patients was dominated by patients over 60 years old (58.07%). Moreover, NSNA patients have higher proportion of female patients (6.99%) than SA patients (1.24%). In addition, primary tumor site of NSNA patients was more likely to present at glottic region (79.76%) than SA patients. NSNA patients were more likely to present at earlier disease stage, with 61.68% in I and II stages, 65.54% at T1 and T2 classifications.
Demographics of all Patients Based on 4 Subgroups Before Propensity Score Matching (PSM) (N = 1735).

P value-1, statistical differences among the 4 subgroups; P value-2, statistical differences in the NSNA group versus the SA group.
Abbreviations: CHP, cricohyoidopexy; CHEP, cricohyoidoepiglottopexy; NSNA, non-smoking and non-alcohol drinking; SA, smoking and alcohol drinking.
Profile in Clinicopathological and Prognostic Features
Before PSM, log-rank test showed that all-cause mortality OS (P = .79) and LSCC-specific mortality DFS (P = .34) were not significantly higher in SA patients than in NSNA patients. Further grouping of alcohol and tobacco consumption found no differences among the 4 groups (Figure 1A and B). To adjust the potential confounding effect, the NSNA patients was 1:1 matched on age, gender, primary tumor site, pT stage, clinical stage, maximum diameter of tumor, tumor volume, tumor area, resection margin, postoperative complications, and treatment option with SA patients. Out of 1224 patients, 333 NSNA and 333 SA patients were selected, and details of demographics and clinical characteristics of all patients were listed in Table 2.
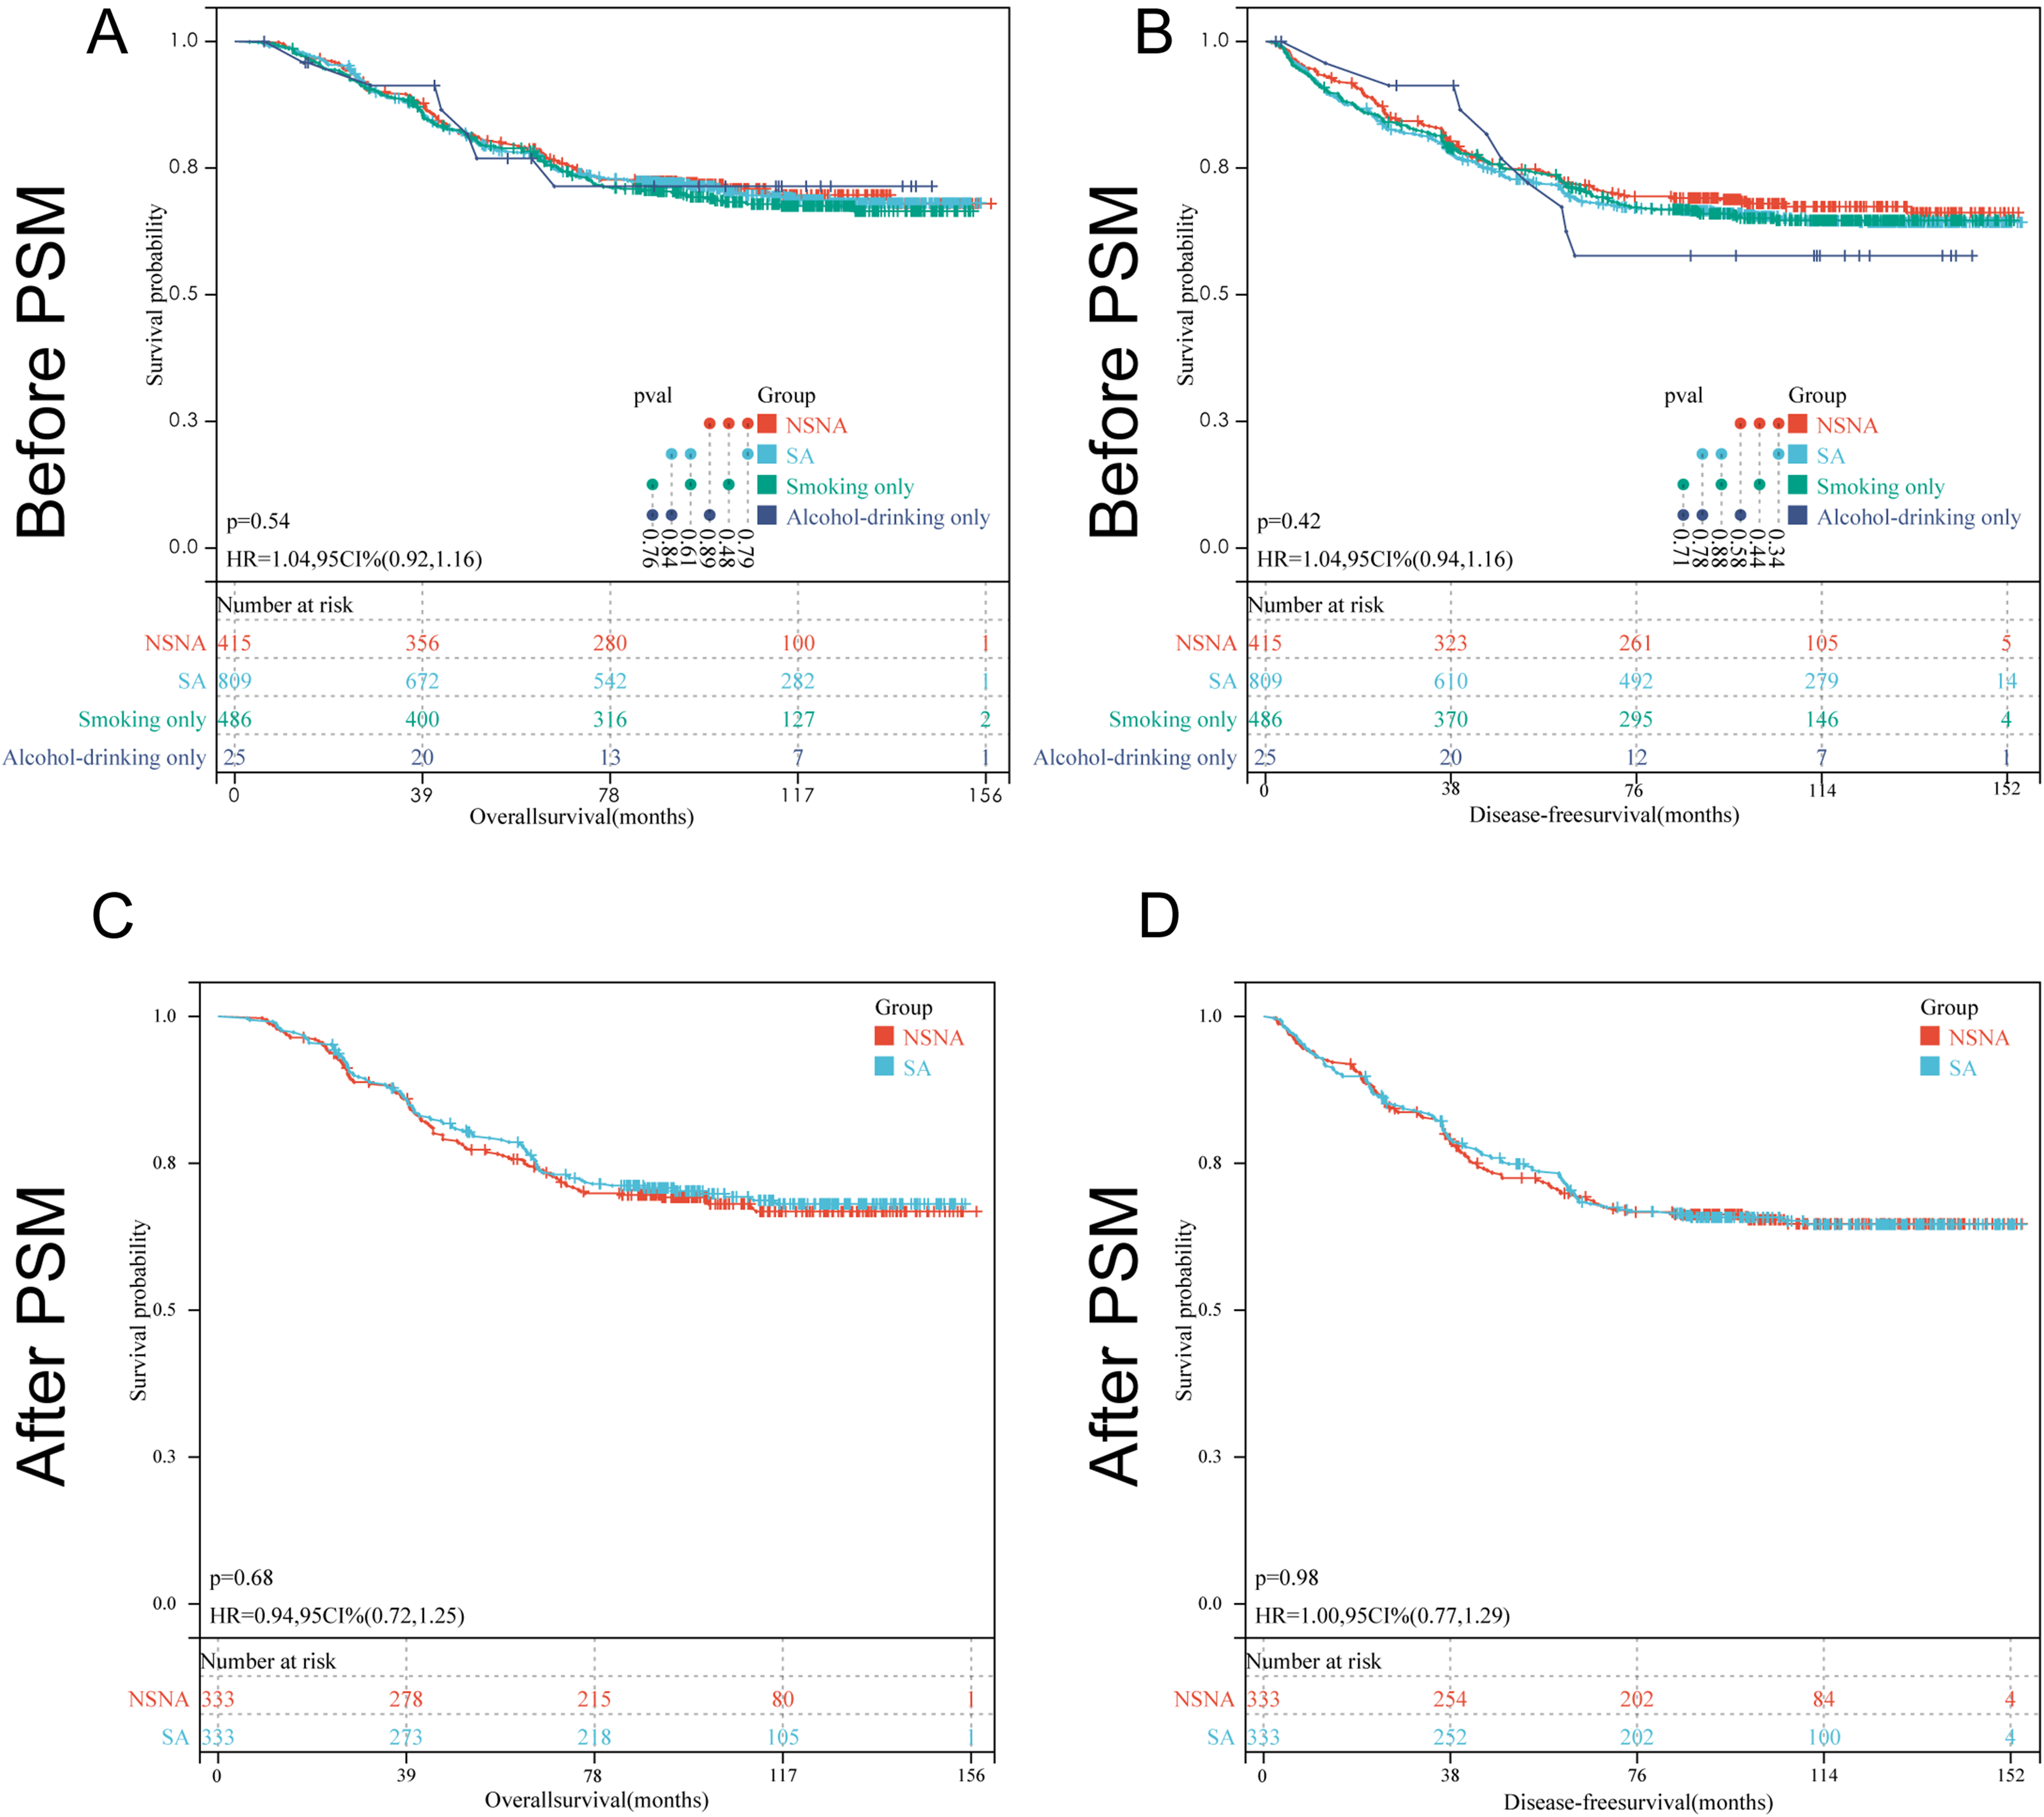
Kaplan–Meier curves pertaining to the overall survival (OS) and disease-free survival (DFS) in laryngeal squamous cell carcinoma (LSCC) patients grouped based on alcohol and tobacco consumption. (A-B) OS rates and DFS rates of 4 groups of patients before propensity score matching (PSM). (C-D) OS rates and DFS rates of SA patients and NSNA patients after PSM. The survival curves were defined by the Kaplan–Meier method and the tests of survival rates between any 2 groups were performed by log-rank (Mantel–Cox) test.
Demographics of the Patients in the NSNA Group Versus the SA Group After Propensity Score Matching (PSM) (N = 666).
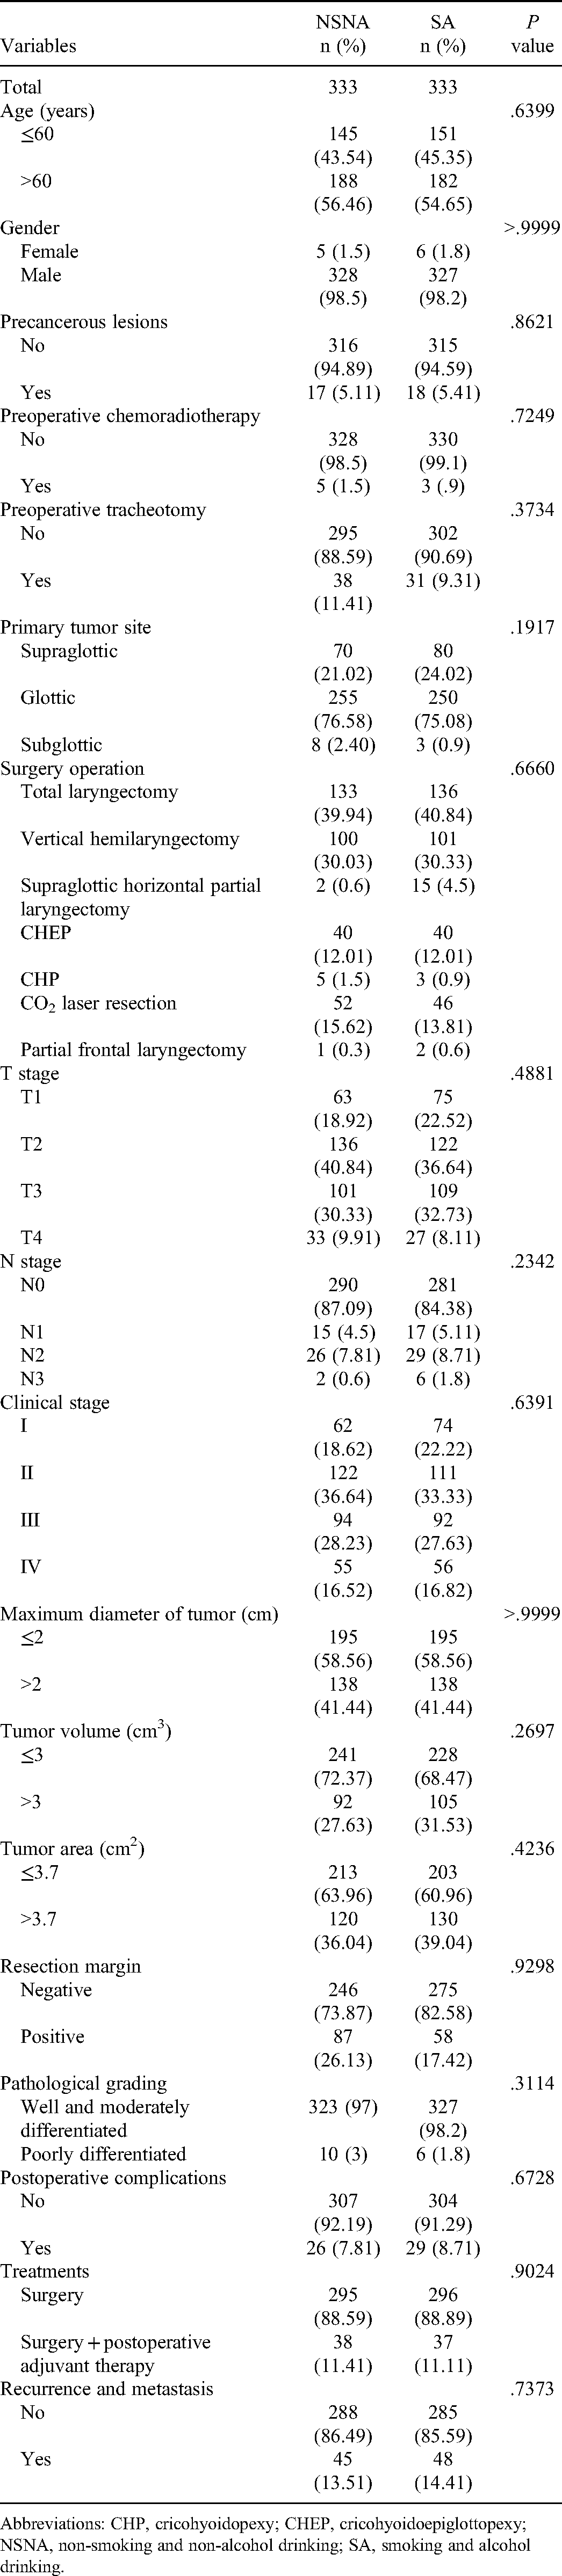
Abbreviations: CHP, cricohyoidopexy; CHEP, cricohyoidoepiglottopexy; NSNA, non-smoking and non-alcohol drinking; SA, smoking and alcohol drinking.
After PSM, there was still no significant difference in OS (P = .685, Figure 1C) and DFS (P = .976, Figure 1D) between SA patients and NSNA patients. However, through univariate and multivariate Cox proportional hazard regression models, we found that NSNA patients show a distinct profile from that found in SA patients in clinicopathological and prognostic features. For NSNA patients, 12 variables including age, preoperative chemoradiotherapy, and preoperative tracheotomy were used for Cox multivariate analysis of OS, and 11 variables including age, preoperative chemoradiotherapy, and preoperative tracheotomy were used for Cox multivariate analysis of DFS. For SA patients, 11 variables including age, preoperative chemoradiotherapy, and primary tumor site were used for Cox multivariate analysis of OS, and 11 variables including age, preoperative chemoradiotherapy, and primary tumor site were used for Cox multivariate analysis of DFS. We found that a total of 4 variables (age, tumor area, resection margin, and recurrence and metastasis) were proven to be independent prognostic factors of OS for NSNA patients in the multivariate Cox regression model, while N stage, tumor area, resection margin and recurrence and metastasis were proved to be independent prognostic factors for DFS in NSNA patients (Table 3). For SA patients, 3 variables (age, N stage, and recurrence and metastasis) were proven to be independent prognostic factors of OS, while 2 variables (age and recurrence and metastasis) were proved to be independent prognostic factors for DFS in SA patients (Table 4).
Univariate and Multivariate Analysis of Various Prognostic Factors of the Patients in the non-Smoking and non-Alcohol Drinking (NSNA) Group After Propensity Score Matching (PSM) (N = 333).
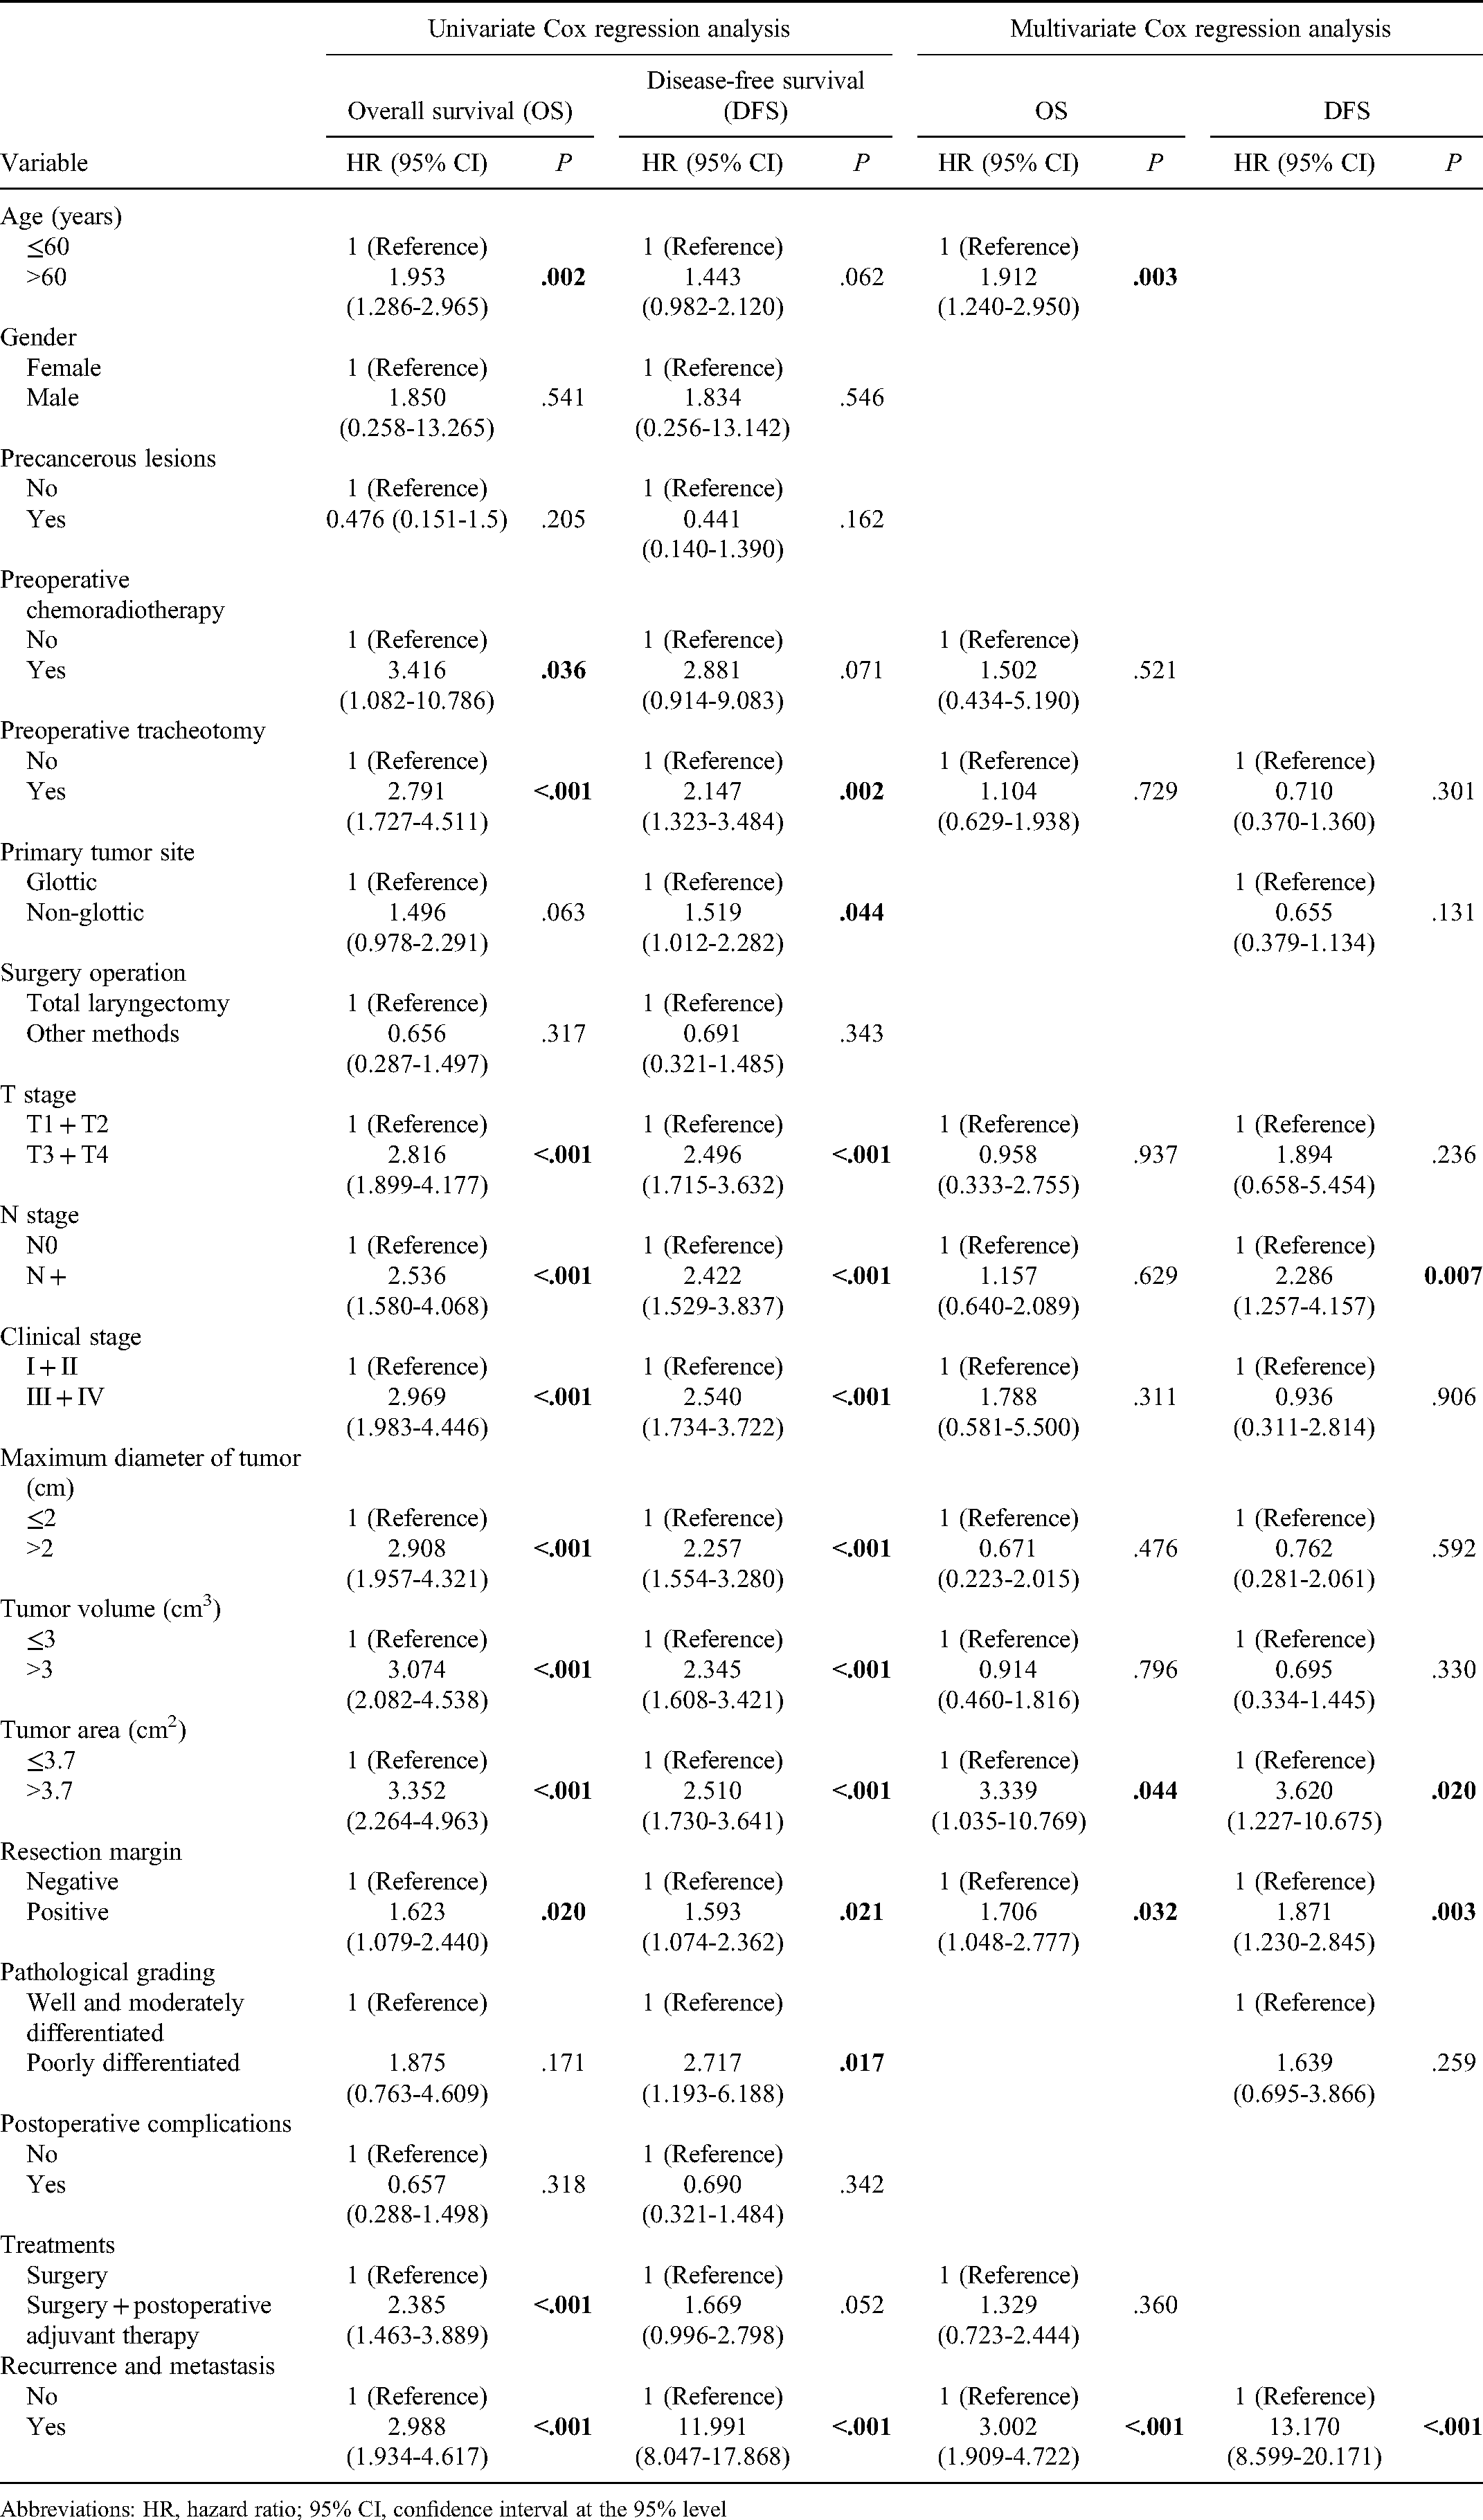
Abbreviations: HR, hazard ratio; 95% CI, confidence interval at the 95% level
Univariate and Multivariate Analysis of Various Prognostic Factors of the Patients in the Smoking and Alcohol Drinking (SA) Group After Propensity Score Matching (PSM) (N = 333).

Abbreviations: HR, hazard ratio; 95% CI, confidence interval at the 95% level.
Prognostic Analysis Between NSNA and SA Patients
Age >60 years, tumor area >3.7 cm2, positive resection margin and recurrence and metastasis were associated with a poor prognosis of OS for NSNA patients, while N + stage, tumor area >3.7 cm2, positive resection margin, and recurrence and metastasis were associated with a poor prognosis of DFS (Figure 2A and B). In addition, for SA patients, age >60 years, N + stage, and recurrence and metastasis were found to be significantly associated with worse OS, and age >60 years and recurrence and metastasis were significantly associated with worse DFS (Figure 2C and D).

Kaplan–Meier curves pertaining to the overall survival (OS) and disease-free survival (DFS) based on the factors affecting OS and DFS in laryngeal squamous cell carcinoma patients with and without smoking and alcohol drinking. (A-B) OS and DFS for NSNA patients. (C-D) OS and DFS for SA patients. Age: ≤60 versus >60; tumor area: ≤3.7 cm2 versus >3.7 cm2; resection margin: positive versus negative; recurrence and metastasis: yes versus no; N stage: N0 versus N + . The survival curves were defined by the Kaplan–Meier method, the tests of survival rates were performed by log-rank (Mantel–Cox) test.
Moreover, based on the factors affecting OS and DFS, the predictive values were analyzed by means of the ROC analysis, which revealed that the tumor area was the best predictor of OS for NSNA patients. The area under the curve (AUC) for tumor area regarding the OS was 0.654 (95% CI: 0.589-0.719, P < .001, Figure 3A). Recurrence and metastasis was the best predictor of DFS for NSNA patients, with AUC was 0.615 (95% CI: 0.544-0.685, P = .001, Figure 3B). The prognostic values for SA patients pertaining to the other factors are shown in Figure 3C and D.

Receiver operating characteristic analysis regarding to best predictor for overall survival (OS) and disease-free survival (DFS). (A) the area under the curve (AUC) for tumor area regarding the OS of NSNA patients was 0.654 (95% CI: 0.589-0.719, P < .001). (B) Recurrence and metastasis was the best predictor of DFS for NSNA patients, with AUC was 0.615 (95% CI: 0.544-0.685, P = .001). (C) Recurrence and metastasis was the best predictor of OS for SA patients, with AUC was 0.701 (95% CI: 0.635-0.766, P < .001). (D) Recurrence and metastasis was the best predictor of DFS for SA patients, with AUC was 0.701 (95% CI: 0.635-0.766, P = .001).
Nomogram Based on the Prognostic Signature
Then, we built the nomogram to make the prognostic signature more convenient for clinical application (Figure 4). Based on the score of significant independent risk factors, the 3-, 5-, and 10-year OS of NSNA patients and SA patients could be predicted. Calibration curves indicated that the predicted value of the risk score was closer to the actual observation value with the increase in number of years.

Independent prognostic analysis and construction of nomogram. (A, C) Nomogram based on the independent prognostic factors. (B, D) The calibration plot of the nomogram based on 3-, 5-, and 10-year. The y-axis represents actual survival and the x-axis represents nomogram-predicted survival.
Discussion
Smoking and alcohol consumption have traditionally been major risk factors for LSCC, which is uncontroversial, with clear evidence of synergy.3,4,17,18 However, for LSCC patients, whether SA have a negative effect on the prognosis of patients and whether the clinicopathological features of NSNA and SA patients are consistent remains controversial.19,20
Our results showed that NSNA patients accounted for 23.92% of LSCC patients, similar to 22% to 35% reported in the literature. 5 Compared with other studies in which 45%-75% of NSNA patients complicated with LSCC were female, a lower proportion of patients with NSNA were female in our study population (6.99%), which was similar to results reported by Hashibe et al. 3 (11.4%). In addition, the primary tumor site of NSNA patients was more likely to be located in the glottis than SA patients (79.76%).3,21 NSNA patients were more likely to present in early disease stages, similar to reports by others.10,21,22 Therefore, these findings suggest that there may be other important risk factors for LSCC in addition to smoking and alcohol consumption, and more attention should be paid to the increasing number of NSNA patients.23–26
Due to the differed distribution of important social and clinically relevant variables between the SA and NSNA patients, the prognosis regarding NSNA has been controversial. Hence, we applied 1:1 PSM, which is a matching method that could equalize the initial differences thus substantially decrease the bias in order to make a more reasonable comparison between groups. 8 However, the survival outcomes of SA patients were not significantly different from NSNA patients before and after matching analysis. Intriguingly, this result seems to contradict the common sense judgment, as Ramos Innocentini et al., 19 Agudelo et al. 10 and Bao et al. 8 all showed a trend for SA patients to have a higher risk of both all-cause and cancer-specific death. However, their results have also been challenged by consistent observation from other researchers that there was no difference in the relapse-free survival, disease-specific survival between both groups was found,11,12 suggesting that although tobacco and alcohol use are the main risk factors for the development of LSCC, disease outcome was comparable in patients who did or did not use these substances. Furthermore, the report from Pickering et al showed that gene-specific mutation and copy-number alteration frequencies were similar between patients with or without smoking, 27 indicating that the functional impact of risk factors such as smoking on carcinogenesis is still poorly understood. Smoking and alcohol consumption have a significant impact on overall survival in reports mentioned above,5,8,9 possibly due to the close relationship between these substances and other diseases, such as cardiovascular disease and chronic lung disease.
To our knowledge, few studies have analyzed and compared in detail the differences in clinicopathological and prognostic characteristics of NSNA and SA LSCC patients. NSNA patients are a unique subgroup in the LSCC population, which may have practical implications for guiding different treatment regimens clinically. The research in this article has some limitations. First, we did not perform calculation and justification of the sample size selected for this study, which may lead to biased research results. Second, we should have explored more information about the epidemiological characteristics of LSCC patients (such as gastroesophageal reflux and occupational and environmental exposure). However, due to incomplete data collection, we failed to include these variables in the analysis, which may lead to the omission of some important conclusions. Then, since smokers and alcohol drinkers are more likely to be malnourished, have cardiovascular disease, and use drugs, these conditions may have a significant impact on the prognosis of patients with LSCC. However, because of the lack of information about BMI, nutrition, etc., we were unable to conduct further research on this issue.
In conclusion, although tobacco and alcohol consumption are the most important risk factors for the development of LSCC, these NSNA patients not only seem to have the same rate of disease recurrence as SA patients, but they also have a comparable disease outcome. More importantly, NSNA patients show a distinct profile from that found in SA patients in clinicopathological and prognostic features. More research is needed to understand the pathogenesis of NSNA patients in this distinct LSCC population so that we can improve their survival.
Research Highlights
There were significant differences in the epidemiology of LSCC between NSNA patients and SA patients.
NSNA patients not only have the same rate of disease recurrence as SA patients, but they also have a comparable disease outcome.
NSNA patients show a distinct profile from that found in SA patients in clinicopathological and prognostic features.
Footnotes
Abbreviations
Declaration of Conflicting Interests
The authors declared no potential conflicts of interest with respect to the research, authorship, and/or publication of this article.
Ethics Statement
This study is a retrospective study. Only the clinical data of the patients were collected, and the treatment plan of the patients was not intervened. The researchers have tried their best to protect the information provided by patients from disclosing their personal privacy. The Ethics Committee of Eye & ENT Hospital of Fudan University deemed this study exempt from review.
Funding
The authors disclosed receipt of the following financial support for the research, authorship, and/or publication of this article: This work was supported by the Shanghai Sailing Program, Shanghai “Rising Stars of Medical Talent” Youth Development Program-Specialist Program, Science and Technology Commission of Shanghai Municipality, Shanghai Municipal Key Clinical Specialty, and National Natural Science Foundation of China (grant numbers 21YF1405600, 22YF1405700, 2019-72, 19411961300, 21Y11900100, shslczdzk00801, 81502343, and 81972529).