
Abstract
Aim:
Low grade glioma (LGG) is a lethal brain cancer with relatively poor prognosis in young adults. Thus, this study was performed to develop novel molecular biomarkers to effectively predict the prognosis of LGG patients and finally guide treatment decisions.
Methods:
survival-related genes were determined by Kaplan-Meier survival analysis and multivariate Cox regression analysis using the expression and clinical data of 506 LGG patients from The Cancer Genome Atlas (TCGA) database and independently validated in a Chinese Glioma Genome Atlas (CGGA) dataset. A prognostic risk score was established based on a linear combination of 10 gene expression levels using the regression coefficients of the multivariate Cox regression models. GSEA was performed to analyze the altered signaling pathways between the high and low risk groups stratified by median risk score.
Results:
We identified a total of 1489 genes significantly correlated with patients’ prognosis in LGG. The top 5 protective genes were DISP2, CKMT1B, AQP7, GPR162 and CHGB, the top 5 risk genes were SP1, EYA3, ZSCAN20, ITPRIPL1 and ZNF217 in LGG. The risk score was predictive of poor overall survival and relapse-free survival in LGG patients. Pathways of small cell lung cancer, pathways in cancer, chronic myeloid leukemia, colorectal cancer were the top 4 most enriched pathways in the high risk group. SP1, EYA3, ZSCAN20, ITPRIPL1, ZNF217 and GPR162 were significantly up-regulated, while DISP2, CKMT1B, AQP7 were down-regulated in 523 LGG tissues as compared to 1141 normal brain controls.
Conclusions:
The 10-gene signature may become novel prognostic and diagnostic biomarkers to considerably improve the prognostic prediction in LGG.
Introduction
Gliomas are malignant tumors that arise from glial cells and the most prevalent type of adult brain tumors. The incidence rate of the disease is 6.03 per 100,000 in USA. 1 The incidence of the tumor in the People’s Republic of China is 1-4/100,000. 2 Gliomas show high histological diversity, with astrocytoma the most prevalent histological subtype. 1 Gliomas are classified as Grades I to IV based on histology and clinical criteria. 3 Diffuse low-grade and intermediate-grade gliomas refer to World Health Organization grades II and III gliomas (hereafter referred to as lower-grade gliomas [LGG]) and include astrocytomas, oligodendrogliomas, and oligoastrocytomas. 1,3
Most patients initially receive resection at the time of diagnosis and then radiation therapy or treatment with temozolamide. 4 The mean survival time is approximately 7 years, the percentage of LGG patients who can survive for more than 2 decades is as low as 20%. 4 A number of studies have demonstrated the associations of genetic markers with overall survival of LGG patients. For instance, the 1p-19q deletion is a powerful predictor of chemotherapy response and survival and serves as a diagnostic marker for oligodendrogliomas which account for less than 5% of gliomas. 5 The isocitrate dehydrogenase 1 and 2 (IDH1 and IDH2) mutations were associated with prolonged overall survival and higher rate of response to temozolomide in LGG. 6 In addition to genetic markers, recent studies identified gene profiles which enabled to classify patients into high- and low-risk groups with different survival probabilities. 7,8 Thus, identifying key molecular biomarkers is critical to the improvement of survival of LGG patients.
In this study, we aimed to screen for survival-related genes with Kaplan-Meier survival analysis and multivariate Cox regression analysis using the expression and clinical data of 506 LGG patients from The Cancer Genome Atlas (TCGA). 9 We also established a prognostic risk score based on a linear combination of 10 gene expression levels to effectively predict the overall survival (OS) and relapse-free survival (RFS) of LGG patients. The prognosis-associated genes and risk score were validated in 2 independent datasets from the Chinese Glioma Genome Atlas (CGGA) database. 10 The completion of our study opens the avenue for developing molecular markers in prognostication and treatment decision making for LGG patients.
Methods and Materials
Data Acquisition
The gene expression and clinical data came from 2 different sources. The TCGA dataset consisted of normalized read counts of 20532 genes and clinical information of 506 LGG patients and was obtained from the TCGA database. The CGGA dataset of 444 LGG patients was downloaded from the CGGA database. In order to further validate the survival analysis and differentially expressed genes, we also obtained gene expression and clinical data of another independent 182 LGG patients and 20 normal brain controls from the CGGA database (hereinafter referred to as validation dataset). All patients provided written informed consent prior to enrollment in the study.
Bioinformatics Analysis of Prognosis-Associated Genes
To study the biological functions and possible signaling pathways of prognosis-associated genes, the enrichments of gene ontology (GO) terms 11 and Kyoto Encyclopedia of Genes and Genomes (KEGG) 12 pathways were analyzed with the online bioinformatics tool of gprofiler (version 6.8). 13 The raw P values were corrected by the g: SCS algorithm which is a tailor-made algorithm for computing multiple testing correction for p-values gained from GO and pathway enrichment analysis.
Survival Analyses
Student’s t test was utilized to examine the associations between OS, RFS and quantitative factors in LGG patients. Fisher exact test was used to investigate the associations between OS, RFS and categorical variables. The associations of gene expression or risk score with OS were investigated with various statistical methods. In brief, LGG patients were split into the high and low expression groups according to the median expression values or risk score. Risk score = expression of gene 1 × β1 + expression of gene 2 × β2 +⋯+ expression of gene n × βn. β values are the regression coefficients derived from the multivariate Cox regression analysis of the TCGA dataset. We used Kaplan-Meier survival analysis and log-rank methods to compare the difference of OS rates between the 2 groups using the survival package. 14,15 We performed multivariate Cox regression analysis to confirm whether gene expression or risk score was independent prognostic biomarkers after adjustment of the prognosis-related clinical factors using the survival package. ROC curve analysis was conducted by the R package of pROC to determine the predictive capabilities of prognosis-associated genes. 16 AUC values were computed accordingly. P < 0.05 was defined as statistically significant. The prognosis-associated genes were then further classified into protective genes (odd ratio [OR] <1) and risk genes (0< OR <1). We followed the same method to study the association between RFS and risk score. Linear regression model was used to study the association between risk score and each clinical factor in the TCGA and CGGA cohorts.
Gene Set Enrichment Analysis and Differential Gene Expression Analysis
Gene set enrichment analysis (GSEA) 17 was implemented using a java software by comparing the high-risk (higher than median) group with low-risk group (lower than median). The default parameters were used. Transcripts per million (TPM) expression data of 523 LGG patients were obtained from the TCGA database. TPM expression data of 1141 normal brain tissues were obtained from The Genotype-Tissue Expression (GTEx) project. 18 Gene expression differences of top 10 prognosis-associated genes were compared by student t test between LGG patients and normal brain tissues. ROC curve analysis was conducted by the R package of pROC to determine the diagnostic values of prognosis-associated genes. AUC values were computed accordingly.
Results
The Associations Between OS, RFS and Clinicopathologic Factors in LGG
Patient’s age, tumor weight, histological type, histologic grade, IDH1 mutation and targeted therapy were significantly associated with OS in the TCGA cohort (P < 0.05 for all cases, student’s t test or Fisher exact test, Table 1). Moreover, histologic grade, IDH1 mutation and 1p-19q codeletion exhibited significant associations with OS in the CGGA cohort (P < 0.05, Fisher exact test, supplementary Table 1). The remaining factors did not show significant associations with OS in LGG patients (P > 0.05 for all cases, student’s t test or Fisher exact test, Table 1).
Association Between the Clinicopathologic Characteristics and Patients’ OS as Well as RFS in the LGG Dataset.
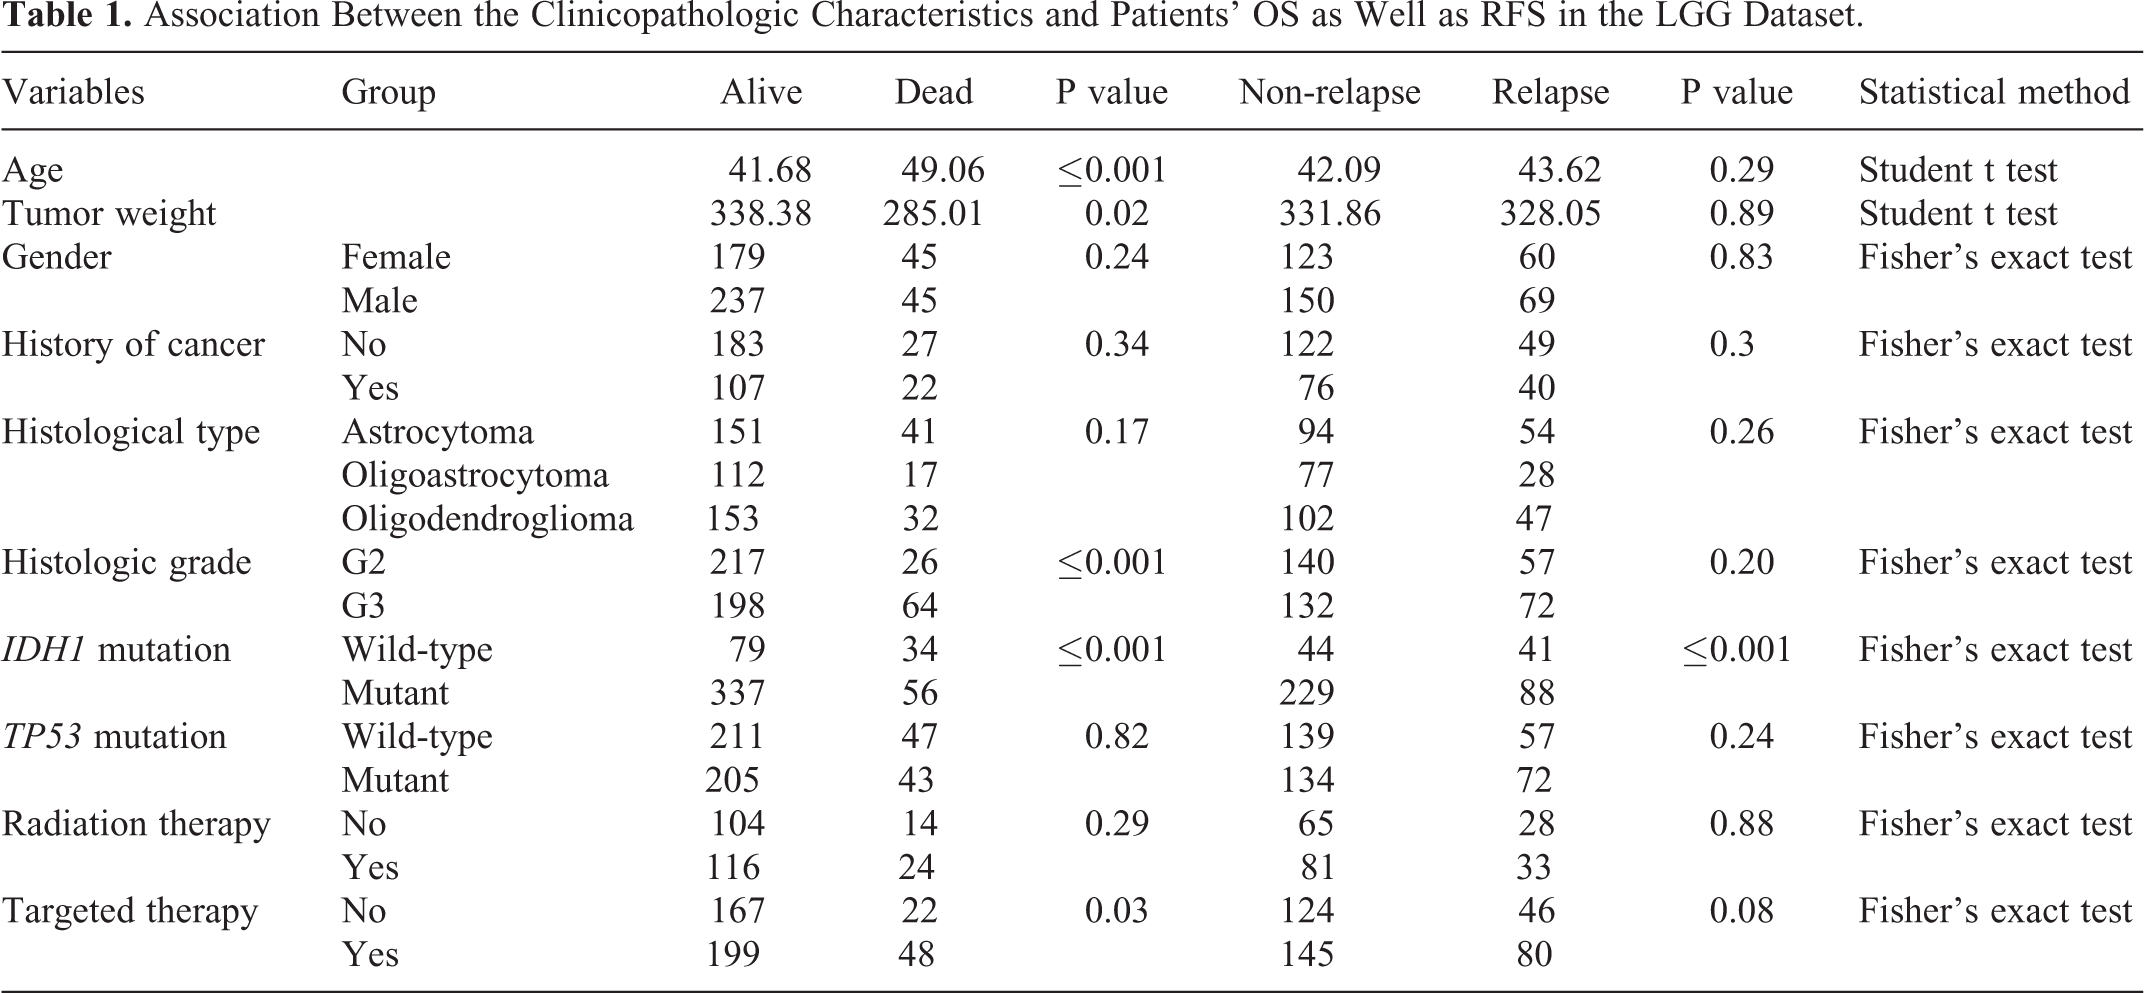
With respect to the associations of clinicopathologic factors with RFS, LGG patients with IDH1 mutation showed better RFS than those without IDH1 mutation (P < 0.05, Fisher exact test, Table 1). While, histologic grade and chemotherapy were significantly associated with RFS in the LGG dataset (P > 0.05 for all cases, Fisher exact test, student’s t test, supplementary Table 1). No significant association was found between RFS and the remaining clinical factors (P > 0.05 for all cases, student’s t test or Fisher exact test, Table 1).
Overall Survival Analysis
To evaluate the predictive capability of gene expression for patients’ OS, the 506 LGG patients in the TCGA dataset were divided into low and high expression groups according to median expression values. Kaplan-Meier survival analysis showed that high expression levels of 3494 genes and 4181 genes were associated with favorable or poor prognosis respectively, such as dispatched RND transporter family member 2 (DISP2), creatine kinase, mitochondrial 1B (CKMT1B), aquaporin 7 (AQP7) and G protein-coupled receptor 162 (GPR162), Sp1 transcription factor (SP1), EYA transcriptional coactivator and phosphatase 3 (EYA3), zinc finger and SCAN domain containing 20 (ZSCAN20), ITPRIP like 1 (ITPRIPL1) (P < 0.05 for all cases, log rank test, Figure 1, supplementary Figure 1). Then multivariate Cox regression analysis was performed between OS and the mortality-associated features, including patients’ age, tumor weight, histological type, histologic grade and IDH1 mutation and 7675 gene expression levels. Multivariate Cox regression analysis confirmed that high expression levels of 1561 genes were significantly associated with decreased mortality, such as DISP2, CKMT1B, AQP7, GPR162. The hazard ratios of the 4 genes ranged from 0.22 to 0.27, with a mean of 0.24 (P < 0.05 for all cases, supplementary Table 2). While high expression levels of 1812 genes were associated with increased mortality, such as SP1, EYA3, ZSCAN20, ITPRIPL1. The hazard ratio ranged from 4.77 to 5.73 for the 4 genes, with a mean of 5.12 (P < 0.05 for all cases, supplementary Table 2, supplementary Figure 1).

Kaplan-Meier survival analysis of patients’ OS with DISP2, CKMT1B, AQP7, GPR162, SP1, EYA3, ZSCAN20, ITPRIPL1 (A-G) expression levels in the TCGA cohort. The difference in overall survival was significantly different between high expression and low expression groups (P < 0.001 for all cases, log rank test).
Validation of Survival Analyses in the CGGA Dataset
In order to validate the findings above, the associations between 3373 gene expression levels and mortality were evaluated in 444 LGG samples of the CGGA dataset. Of 3373 prognosis-associated genes, Kaplan-Meier survival analysis confirmed that high expression levels of 666 genes were associated with favorable prognosis in LGG. In contrast, high expression levels of 1433 genes were associated with poor prognosis (P < 0.05 for all cases, log rank test, supplementary Figure 1). Then multivariate Cox regression analysis was performed between OS and the mortality-associated features, including histologic grade, IDH1 mutation and 1p19q codeletion and 2099 gene expression levels. Multivariate Cox regression analysis confirmed that high expression levels of 421 genes were associated with decreased mortality, while high expression levels of 1068 genes were associated with increased mortality. The top 4 protective genes DISP2, CKMT1B, AQP7, GPR162 and top 4 risk genes SP1, EYA3, ZSCAN20, ITPRIPL1 were confirmed to be significantly associated with OS in the CGGA dataset (P < 0.05 for all cases, supplementary Figure 1, supplementary Table 3).
Bioinformatics Analysis of Prognosis-Associated Genes
The survival-related genes were further analyzed for their involvement in pathways and possible biological roles. The GO term enrichment analysis indicated that the 1068 risk genes were mainly enriched in 236 GO terms, such as DNA replication, cell cycle, mitotic spindle checkpoint, extrinsic apoptotic signaling pathway via death domain receptors, regulation of cyclin-dependent protein serine/threonine kinase activity, integrin-mediated signaling pathway (Supplementary Table 4, adjusted P values < 0.05 for all cases). The 421 protective genes were significantly enriched in 11 GO terms, such as trans-synaptic signaling, chemical synaptic transmission, nervous system development, neurotransmitter transport. The KEGG pathway enrichment analysis suggested that 1068 risk genes were significantly enriched in the DNA replication, cell cycle and homologous recombination, while the 421 protective genes were significantly enriched in nicotine addiction, synaptic vesicle cycle, neuroactive ligand-receptor interaction (Supplementary Table 5, adjusted P values < 0.05 for all cases).
Risk Score is a Negative Predictor for Overall Survival in LGG
We developed a risk score formula by linear combination of expression values of top 5 protective and top 5 risk genes using the coefficients of the multivariate Cox regression models of the TCGA dataset. Risk score =0.25×expression of DISP2 + 0.22×expression of CKMT1B +0.23×expression of AQP7 + 0.27×expression of GPR162 + 0.26×expression of CHGB +4.99×expression of SP1 + 5.73×expression of EYA3 +4.77×expression of ZSCAN20 + 5.13×expression of ITPRIPL1 + 4.58×expression of ZNF217. Deceased LGG patients showed significantly higher risk scores than living LGG patients in both cohorts (P < 0.05 for all cases, student t test, Figure 2A). LGG patients could be divided into the low-risk group and high-risk group according to the median risk score. Kaplan-Meier survival analysis suggested that LGG patients with high risk scores showed lower survival probabilities than those with low risk scores in the TCGA dataset (P < 0.05 for all cases, Figure 2B). The multivariate Cox regression analysis further confirmed that risk score was a negative factor for predicting overall survival independently of prognosis-related clinical features in LGG. Using the same methods, the negative association between risk score and overall survival was also validated in the CGGA dataset (P < 0.05 for all cases, Table 2 and Figure 2C). ROC curves were plotted to further explore the predictive capabilities of the risk scores, the AUC values were 73.67% and 66% in the TCGA and CGGA cohorts respectively, suggesting the risk score is good predictor of OS in LGG (Figure 2D).

Risk score is negatively associated with OS in LGG. A. The difference of risk scores between the living and deceased LGG patients in the 2 cohorts (P < 0.05 for all cases, student t test). B. The comparison of Kaplan-Meier survival curves between high and low risk score groups in the TCGA cohort. C. The comparison of Kaplan-Meier survival curves between high and low risk score groups in the CGGA cohort. The difference in overall survival was significantly different between high and low risk score groups (P < 0.001 for all cases, log rank test). D. The ROC curves for the risk scores in the TCGA and CGGA cohorts.
Multivariate Analyses Between OS and the Risk Score in the TCGA and CGGA Datasets.
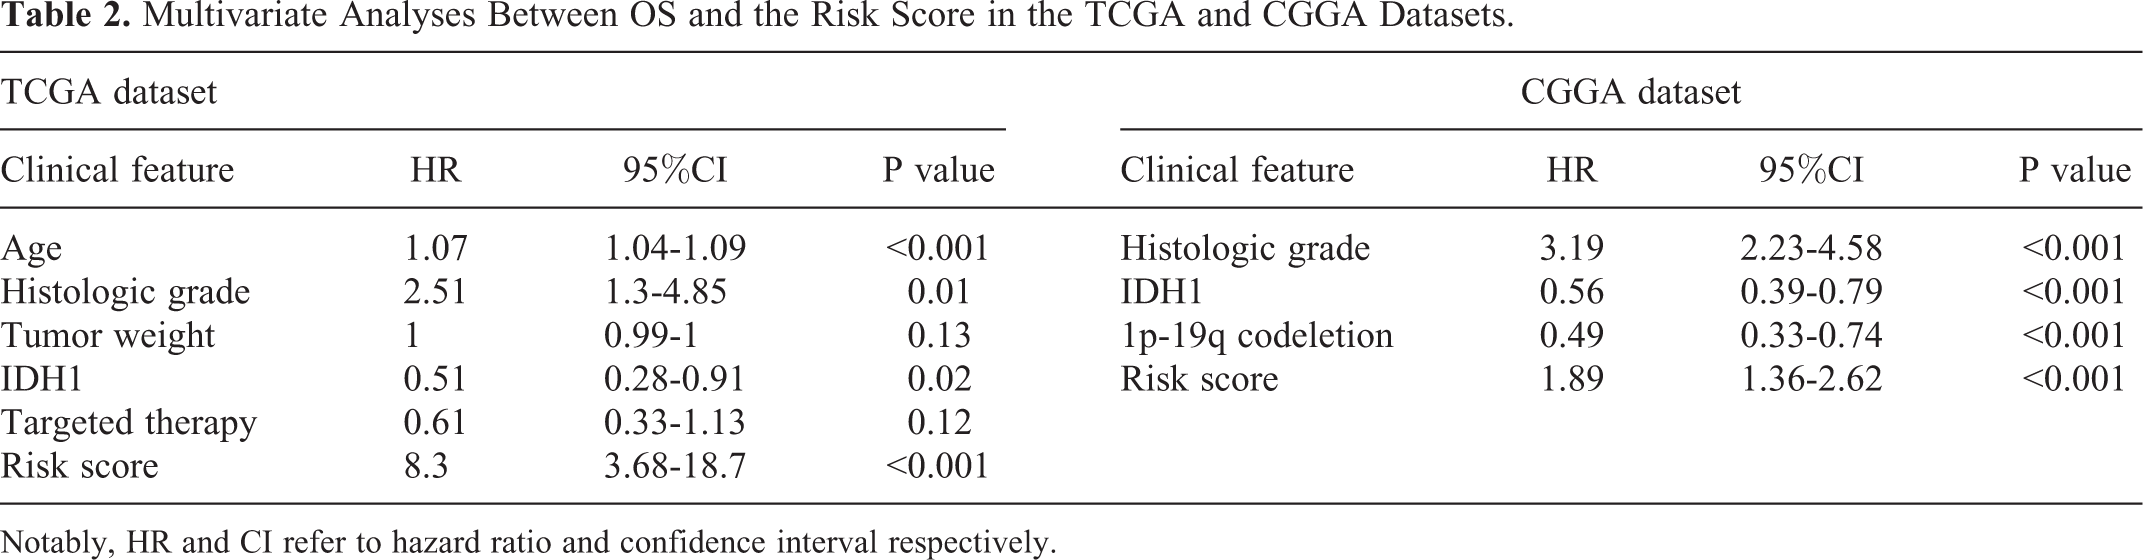
Notably, HR and CI refer to hazard ratio and confidence interval respectively.
Risk Score is a Negative Predictor for Relapse-Free Survival in LGG
In order to further characterize the associations of risk scores with RFS, we followed the overall survival analysis methods. Recurrent tumors showed significantly higher risk scores than non-recurrent tumors in both cohorts (P < 0.05 for all cases, student t test, Figure 3A). Kaplan-Meier RFS analysis showed that high risk score was associated with an inferior RFS (P < 0.05, log rank test, Figure 3B). Multivariate Cox regression analysis exhibited that increased risk score was associated with increased RFS after the adjustment of IDH mutation (P < 0.05, supplementary Table 6). In order to validate the findings above, we analyzed the associations between RFS and risk score in the CGGA dataset. The Kaplan-Meier analysis together with multivariate analysis confirmed that increased risk score was associated with increased RFS (P < 0.05, Figure 3C, supplementary Table 6). ROC curves were plotted to further explore the predictive capabilities of the risk scores, the AUC values were 61.52% and 53.9% in the TCGA and CGGA cohorts respectively, suggesting the risk score is an effective predictor for RFS in LGG (Figure 3D).

Risk score is negatively associated with RFS in LGG. A. The difference of risk scores between the LGG patients with relapse and non-relapse in the 2 cohorts (P < 0.05 for all cases, student t test). B. The comparison of Kaplan-Meier survival curves between high and low risk score groups in the TCGA cohort. C. The comparison of Kaplan-Meier survival curves between high and low risk score groups in the CGGA cohort. The difference in overall survival was significantly different between high and low risk score groups (P < 0.05 for all cases, log rank test). D. The ROC curves for the risk scores in the TCGA and CGGA cohorts.
Risk Score Is Associated With Clinical Factors in LGG
Linear regression model was used to analyze the association between risk score and each clinical factor in the TCGA and CGGA cohorts. In the TCGA cohort, risk score was significantly positively correlated with histologic grade, TP53 mutation, radiation therapy, targeted molecular therapy and negatively correlated with IDH1 mutation and histological type (p < 0.05 for all cases, supplementary Figure 2A). Furthermore, the risk score exhibited significantly negative correlation with IDH1 mutation and 1p19q codeletion (p < 0.05 for all cases, supplementary Figure 2B).
Risk Score Related Pathway Analysis
In order to understand why risk score is predictive of LGG patients’ survival, we partitioned the LGG samples into high and low risk groups according to the median risk score. GSEA was performed to analyze the altered signaling pathways between the 2 different risk groups. Nine signaling pathways were significantly enriched in the high risk group of both the TCGA and CGGA cohorts, with small cell lung cancer, pathways in cancer, chronic myeloid leukemia, colorectal cancer the top 4 pathways most significantly enriched in the high risk score group (Figure 4 and supplementary Figure 3, p < 0.05 for all cases). In contrast, genes in the pathways of cardiac muscle contraction, oxidative phosphorylation were significantly enriched in the low risk group of the 2 cohorts (Figure 4 and supplementary Figure 4, p < 0.05 for all cases). These results suggest that the survival of glioma patients can be accurately predicted by the risk score, perhaps the above-mentioned pathways might play a critical role in the association of risk score with survival.

KEGG pathways associated with risk score. GSEA based on the expression of TCGA dataset revealed significant pathways associated with risk score, including small cell lung cancer (A), pathways in cancer(B), chronic myeloid leukemia (C), colorectal cancer (D) (P < 0.05 for all cases, GSEA). For each gene set, vertical bars along the x-axis of the GSEA plot represent the positions of genes within the ranked list. Negative GSEA enrichment score curve indicates anti-enrichment (down-regulation), and positive curve denotes enrichment (up-regulation).
Independent Validation of Survival Analysis in the Validation Dataset
We also validated the prognostic importance of the 10 genes and risk score in the validation dataset from the CGGA database. The Kaplan-Meier analysis validated DISP2, CKMT1B, AQP7, GPR162 and CHGB expression levels were positively correlated with overall survival, while SP1, EYA3, ZSCAN20, ITPRIPL1 and ZNF217 expression levels were negatively correlated with OS in the validation dataset (p < 0.05 for all cases, log rank test, supplementary Table 7). Then multivariate analysis was carried out between OS and the mortality-associated features, including histologic grade, IDH1 mutation and 1p19q codeletion and 10 gene expression levels. Multivariate analysis confirmed DISP2, CKMT1B, AQP7 and CHGB expression levels were significantly associated with favorable OS after adjustment of survival-related features, while SP1, EYA3 expression levels were significantly associated with inferior OS (p < 0.05 for all cases, supplementary Table7 ). We also calculated the risk score for each LGG patient using the risk score formula as mentioned above and evaluated its relation with OS and RFS in the validation cohort. As expected, the risk score was significantly adversely associated with OS and RFS (P < 0.05 for all cases, log rank test, supplementary Figure 5). Moreover, the negative association was further verified in the multivariate analysis in the validation dataset (P < 0.05 for all cases, supplementary Table 8).
Assessment of Diagnostic Value
Of the top 10 prognosis-associated genes, SP1, EYA3, ZSCAN20, ITPRIPL1, ZNF217 and GPR162 were significantly up-regulated, while DISP2, CKMT1B, AQP7 were down-regulated in 523 LGG tissues as compared to 1141 normal brain controls (P values < 0.001 for all cases, student t test, Figure 5A). ROC curves were plotted to further explore the diagnostic values of the 10 genes. Three genes, SP1, ZSCAN20, ZNF217, exhibited high accuracy in differentiating LGG tissues from brain normal tissues (P values < 0.05, AUC >0.8 for all cases, Figure 5B). We also validated the gene expression difference of the 10 genes between 182 LGG patients and 20 normal brain controls from the CGGA database. SP1, EYA3, ZSCAN20, ITPRIPL1, ZNF217 were confirmed to be significantly up-regulated, while CKMT1B was down-regulated in LGG (P values < 0.001 for all cases, student t test, Figure 5C).
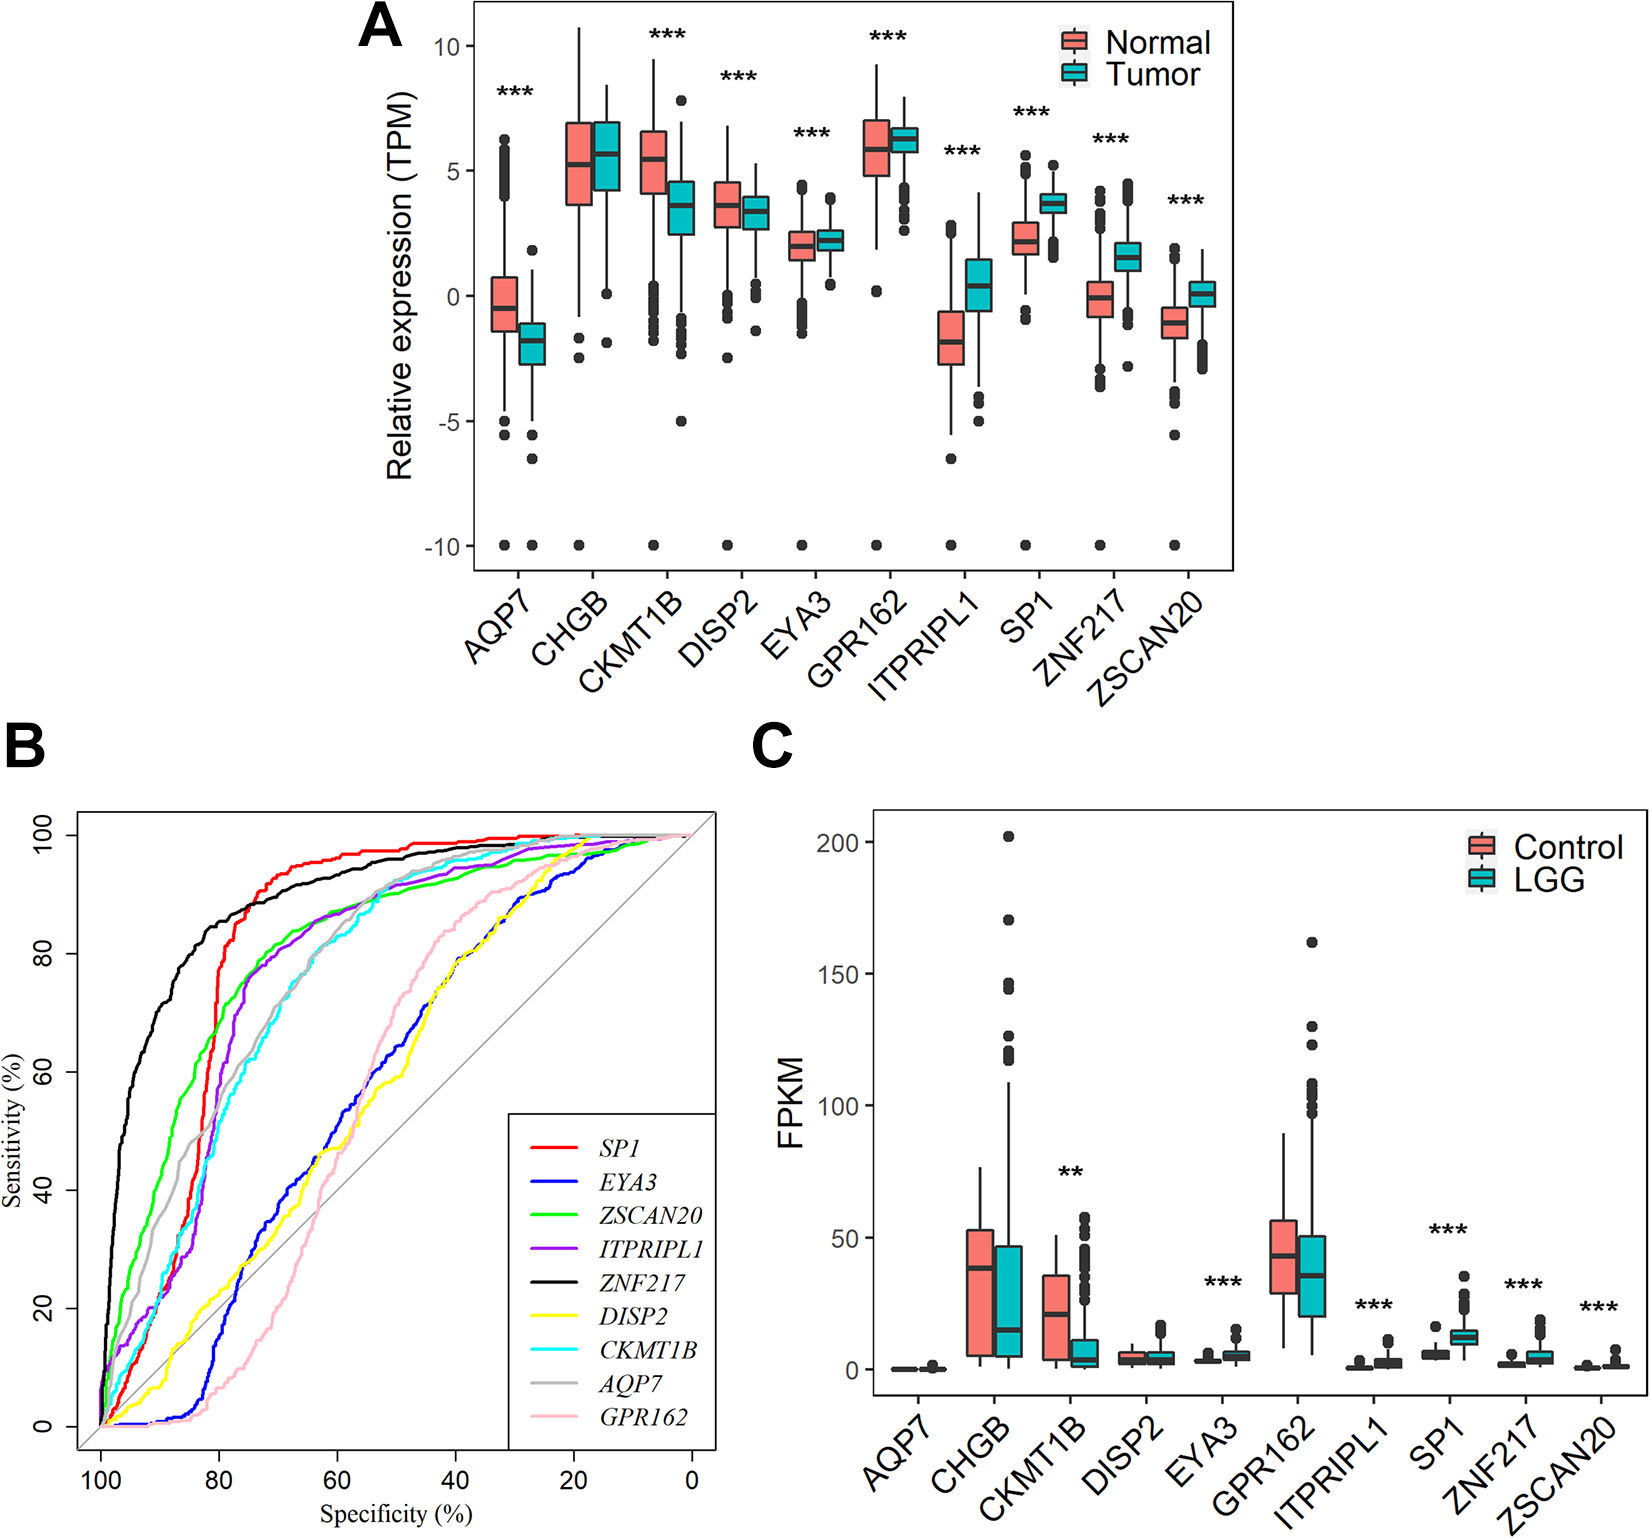
Differential expression gene analysis A. The expression difference of DISP2, CKMT1B, AQP7, GPR162, CHGB, SP1, EYA3, ZSCAN20, ITPRIPL1, ZNF217 between 523 LGG tissues and 1141 normal brain controls in the TCGA cohort. B. The ROC curves for the 9 genes in the TCGA cohort. C. The expression difference of DISP2, CKMT1B, AQP7, GPR162, CHGB, SP1, EYA3, ZSCAN20, ITPRIPL1, ZNF217 between 325 LGG tissues and 20 normal brain controls in the CGGA cohort. ** and *** represent P value < 0.01 and 0.001 respectively, student t test was used for the comparison.
Discussion
Over the past decade, despite significant advances in the treatment of LGG, LGG remains a serious threat to public health around the world. A number of studies have demonstrated the associations of molecular tumor markers with overall survival for LGG patients. For instance, the 1p-19q deletion is a powerful predictor of chemotherapy response and survival and serves as a diagnostic marker for oligodendrogliomas which account for less than 5% of gliomas. 5 The IDH1 and IDH2 mutations are associated with prolonged overall survival and higher rate of response to temozolomide in low-grade gliomas. 6 It remains critical and urgent to identify new molecular biomarkers and develop prognostic prediction models with high accuracy. In recent years, gene-signatures based on aberrant mRNA have drawn much attention and displayed great potential in prognostic prediction of LGG patients. 19 -21
In this study, we found 1489 genes expression was significantly associated with OS of LGG patients. The GO term and KEGG pathway enrichment analyses indicated that the 1068 risk genes were mainly enriched in the regulation of DNA replication, cell cycle, DNA repair signaling pathways. While, the 421 protective genes were significantly enriched in the nicotine addiction, synaptic vesicle cycle, neuroactive ligand-receptor interaction. The difference in the GO terms and KEGG pathway of prognosis-associated genes is of great importance to the identification of prognostic biomarkers and eventually novel therapeutic targets in LGG. For instance, given the significant enrichment of risk genes in the cell cycle signaling pathway, cell cycle genes may become potential candidates for developing prognostic biomarkers or druggable targets in LGG.
We also identified a 10-gene panel comprising DISP2, CKMT1B, AQP7, GPR162, CHGB, SP1, EYA3, ZSCAN20, ITPRIPL1, ZNF217 expression levels that could predict the OS of LGG patients. Furthermore, we established a risk score model using a linear combination of 10 gene expression levels weighted by β-values of multivariate Cox regression models. The risk score was negatively correlated with OS and RFS after adjustment of known prognosticators. The clinical significance of risk score was evaluated and KEGG pathways were identified. Nine signaling pathways were significantly enriched in the high risk group of both the TCGA and CGGA cohorts, including adherens junction, basal transcription factors, chronic myeloid leukemia, colorectal cancer, neurotrophin signaling pathway, pathways in cancer, small cell lung cancer, TGF-beta signaling pathway and Ubiquitin mediated proteolysis. Neurotrophins are a family of trophic factors involved in differentiation and survival of neural cells. 12 We believe neurotrophin signaling pathway and other pathways are implicated in the molecular mechanism by which risk score is associated with survival of LGG patients.
The 10 genes play diverse roles in the tumorigeneses of cancers. For instance, the Specificity protein 1 (Sp1) transcription factor is known to regulate tumorigenesis in many cancers. Sp1 is over-expressed and associated with poor prognosis in many cancer types. Inhibiting Sp1 expression suppresses the proliferation, metastasis and induces apoptosis in colon cancer, 22 glioma. 23,24 pharyngeal carcinoma 25 and lung cancer. 26 E2F suppression and Sp1 overexpression induce the differentiation-specific marker, transglutaminase type 1, in a squamous cell carcinoma cell line KJD-1/SV40. 27 ZNF217 is a member of the Kruppel-like family of transcriptional factors, it was firstly amplified in breast cancer and associated with aggressive tumor behavior and poor clinical prognosis. 28,29 ZNF217 expression was increased in prostate cancer, Elevated expression of ZNF217 promotes prostate cancer growth by restraining ferroportin-conducted iron egress. 30 ZNF217 is a crucial mediator and indicator of bone metastasis. The ZNF217 promotes breast cancer metastasis to the bone. 31 ZNF217 gene amplification was significantly correlated with lymph node metastasis in ovarian clear cell carcinoma. Inhibition of ZNF217 profoundly suppressed cell migration and invasion in ovarian clear cell carcinoma. 32 ZNF217 expression was associated with inferior relapse-free survival and overall survival in gastric cancer 33 and breast cancer. 34 CKMT1B expression has been shown to be associated with short disease-free survival and relapse in breast cancer, which is discordant with our study. 35 Low expression of AQP7 is correlated with tumor grade and the aggressive features of hepatocellular carcinoma. 36 Moreover, AQP7 is prognostic of overall survival in patients with breast cancer. In mouse breast cancer models, reduced expression of Aqp7 caused reduced primary tumor burden and lung metastasis. 37 Eya3 promotes triple-negative breast cancer-associated immune suppression. Eya3 loss decreases tumor growth in immune-competent mice and is associated with increased numbers of infiltrated CD8+ T cells. 38 Silence of EYA3 increased H2A.XY142 ph and inhibited cell viability, migration and percent cells in S stage in gastric cancer 39 and decreased survival of Ewing sarcoma cells. 40 These studies and the results in our study suggest that the 5 genes may have oncogenic or tumor suppressor function in cancers.
In addition to prognostic value, the 10 genes also showed diagnostic value for LGG patients. Our study reported DISP2, CKMT1B, AQP7 were significantly down-regulated and SP1, EYA3, ZSCAN20, ITPRIPL1, ZNF217 and GPR162 were significantly up-regulated in the LGG samples. They exhibited high accuracy in differentiating LGG tissues from normal brain tissues. Lastly, the 10 genes may also pave the way for developing targeted therapies for LGG patients. For instance, silencing the expression of Sp1 resulted in marked decrease in cell proliferation, metastasis in various cancer types. 22,26,32
Conclusion
In summary, this study revealed a novel 10-gene signature which has prognostic and diagnostic values and successfully classifies LGG patients with different prognostic probabilities. A higher risk score indicates a poorer prognosis. These findings will help researchers identify new treatments for LGG and to provide more therapeutic targets to cure LGG patients in the future.
Supplemental Material
Supplemental Material, sj-jpg-1-tct-10.1177_1533033821992084 - A Novel 10-Gene Signature Predicts Poor Prognosis in Low Grade Glioma
Supplemental Material, sj-jpg-1-tct-10.1177_1533033821992084 for A Novel 10-Gene Signature Predicts Poor Prognosis in Low Grade Glioma by Wentao Liu, Jiaxuan Zou, Rijun Ren, Jingping Liu, Gentang Zhang and Maokai Wang in Technology in Cancer Research & Treatment
Supplemental Material
Supplemental Material, sj-jpg-2-tct-10.1177_1533033821992084 - A Novel 10-Gene Signature Predicts Poor Prognosis in Low Grade Glioma
Supplemental Material, sj-jpg-2-tct-10.1177_1533033821992084 for A Novel 10-Gene Signature Predicts Poor Prognosis in Low Grade Glioma by Wentao Liu, Jiaxuan Zou, Rijun Ren, Jingping Liu, Gentang Zhang and Maokai Wang in Technology in Cancer Research & Treatment
Supplemental Material
Supplemental Material, sj-jpg-3-tct-10.1177_1533033821992084 - A Novel 10-Gene Signature Predicts Poor Prognosis in Low Grade Glioma
Supplemental Material, sj-jpg-3-tct-10.1177_1533033821992084 for A Novel 10-Gene Signature Predicts Poor Prognosis in Low Grade Glioma by Wentao Liu, Jiaxuan Zou, Rijun Ren, Jingping Liu, Gentang Zhang and Maokai Wang in Technology in Cancer Research & Treatment
Supplemental Material
Supplemental Material, sj-jpg-4-tct-10.1177_1533033821992084 - A Novel 10-Gene Signature Predicts Poor Prognosis in Low Grade Glioma
Supplemental Material, sj-jpg-4-tct-10.1177_1533033821992084 for A Novel 10-Gene Signature Predicts Poor Prognosis in Low Grade Glioma by Wentao Liu, Jiaxuan Zou, Rijun Ren, Jingping Liu, Gentang Zhang and Maokai Wang in Technology in Cancer Research & Treatment
Supplemental Material
Supplemental Material, sj-pdf-1-tct-10.1177_1533033821992084 - A Novel 10-Gene Signature Predicts Poor Prognosis in Low Grade Glioma
Supplemental Material, sj-pdf-1-tct-10.1177_1533033821992084 for A Novel 10-Gene Signature Predicts Poor Prognosis in Low Grade Glioma by Wentao Liu, Jiaxuan Zou, Rijun Ren, Jingping Liu, Gentang Zhang and Maokai Wang in Technology in Cancer Research & Treatment
Supplemental Material
Supplemental Material, sj-tif-1-tct-10.1177_1533033821992084 - A Novel 10-Gene Signature Predicts Poor Prognosis in Low Grade Glioma
Supplemental Material, sj-tif-1-tct-10.1177_1533033821992084 for A Novel 10-Gene Signature Predicts Poor Prognosis in Low Grade Glioma by Wentao Liu, Jiaxuan Zou, Rijun Ren, Jingping Liu, Gentang Zhang and Maokai Wang in Technology in Cancer Research & Treatment
Footnotes
Declaration of Conflicting Interests
The author(s) declared no potential conflicts of interest with respect to the research, authorship, and/or publication of this article.
Funding
The author(s) received no financial support for the research, authorship, and/or publication of this article.
Supplemental Material
Supplemental material for this article is available online.
List of Abbreviations
References
Supplementary Material
Please find the following supplemental material available below.
For Open Access articles published under a Creative Commons License, all supplemental material carries the same license as the article it is associated with.
For non-Open Access articles published, all supplemental material carries a non-exclusive license, and permission requests for re-use of supplemental material or any part of supplemental material shall be sent directly to the copyright owner as specified in the copyright notice associated with the article.