
Abstract
Isocitrate dehydrogenase mutational status defines distinct biologic behavior and clinical outcomes in low-grade gliomas. We sought to determine magnetic resonance imaging characteristics associated with isocitrate dehydrogenase mutational status to evaluate the predictive roles of magnetic resonance imaging features in isocitrate dehydrogenase mutational status and therefore their potential impact on the determination of clinical target volume in radiotherapy. Forty-eight isocitrate dehydrogenase-mutant and 28 isocitrate dehydrogenase–wild-type low-grade gliomas were studied. Isocitrate dehydrogenase mutation was related to more frequency of cortical involvement compared to isocitrate dehydrogenase–wild-type group (34/46 vs 6/24, P = .0001). Peritumoral edema was less frequent in isocitrate dehydrogenase–mutant tumors (32.6% vs 58.3% for isocitrate dehydrogenase–wild-type tumors, P = .0381). Isocitrate dehydrogenase–wild-type tumors were more likely to have a nondefinable border, while isocitrate dehydrogenase–mutant tumors had well-defined borders (66.7% vs 39.1%, P = .0287). Only 8 (17.4%) of 46 of the isocitrate dehydrogenase–mutant tumors demonstrated marked enhancement, while this was 66.7% in isocitrate–wild-type tumors (P < .0001). Choline–creatinine ratio for isocitrate dehydrogenase–wild-type tumors was significantly higher than that for isocitrate dehydrogenase–mutant tumors. In conclusion, frontal location, well-defined border, cortical involvement, less peritumoral edema, lack of enhancement, and low choline–creatinine ratio were predictive for the definition of isocitrate dehydrogenase–mutant low-grade gliomas. Magnetic resonance imaging can provide an advantage in the detection of isocitrate dehydrogenase status indirectly and indicate the need to explore new design for treatment planning in gliomas. Choline–creatinine ratio in magnetic resonance spectroscopy could be a potential more reasonable reference for the new design of delineation of target volume in low-grade gliomas.
Keywords
Introduction
Low-grade gliomas (LGGs) are diffuse, slow-growing, primary glial neoplasms that are classified as World Health Organization (WHO) grade II tumors, histopathologically including astrocytomas and oligodendrogliomas, with distinct biology behavior, treatment response, and prognosis. 1 Recently, isocitrate dehydrogenase (IDH) 1/2 mutation status identification is essential for the pathological diagnosis of gliomas. Isocitrate dehydrogenase mutation signifies less aggressive biologic behavior and better clinical outcomes, while the wild-type group behaves more like higher grade gliomas. 2 Furthermore, tumor sensitivity (SEN) to chemotherapy/radiation and patient prognosis could be predicted by molecular markers. 3,4 However, current technology does not permit noninvasive detection of these molecular markers; invasive tumor resection or biopsy is necessary.
Magnetic resonance imaging (MRI) is an essential modality for pretreatment diagnosis of gliomas prior to surgical resection or biopsy. Distinct image features on MRI could reflect variable molecular markers status, which provide important information for the diagnosis and prognosis of gliomas. 5 Previous studies have attempted to predict IDH1/2 mutation with different MRI 6 -8 including conventional MRI (cMRI), advanced MRI such as diffusion and perfusion imaging, and molecular imaging using various nuclear medicine tracers.
Here, we devised a method for noninvasive molecular biological diagnosis of WHO IDH-mutant (MT)/ wild-type (WT) gliomas using MRI. A retrospective single institution study was performed on 78 patients with pathologically proven WHO LGG with a presurgery MRI and molecular data on IDH to evaluate the predictive roles of MRI features in IDH mutational status and their potential impact on the determination of clinical target volume in radiotherapy.
Methods
Patients
Patients with histopathologically diagnosed grade II gliomas who underwent image-guided stereotactic biopsy or tumor resection at our institution from September 2016 to August 2018 were included. An area of significant contrast enhancement was oriented as biopsy targets if the tumor demonstrated contrast enhancement; otherwise, tumor center or the solid part of tumor was located, especially where the choline (Cho)/creatinine (Cr) ratio in magnetic resonance spectroscopy (MRS) were highest. At least 3 targets in noneloquent regions were determined.
The histopathologic diagnosis was made by experienced neuropathologists according to the updated WHO classification standards. All tissue samples were tested for IDH mutation, O 6 -methylguanine-DNA methyltransferase (MGMT) promoter methylation status, and 1p/19q deletions if possible. Patient inclusion criteria were age ≥18 years, treatment-naive status, and no prior diagnosis of brain tumor. Patients were divided into 2 groups based on the presence of IDH mutation. This retrospective study was approved by the ethical approval for Scientific Research Projects under medical ethics committee, Zhongnan Hospital of Wuhan University (approval no. 2017025). The ethics committee waived the need for consent because the data came from anonymous archival data.
Conventional MRI and Spectroscopy
The MR examinations were performed in the routine clinical workup using a 16-channel dedicated head matrix coil on a 3.0-Tesla MRI system (Siemens Healthcare, Erlangen, Germany). The sequences of cMRI protocols were gradient-echo T1-weighted imaging (T1WI, slice thickness of 5 mm), turbo spin-echo T2-weighted imaging (slice thickness of 5 mm), fluid-attenuated inversion recovery (FLAIR, slice thickness of 5 mm) imaging, and gradient-echo contrast-enhanced T1WI (CE-T1WI, slice thickness of 1 mm). Spectroscopic data were obtained as described previously. 9 Data were achieved using the multivoxel point resolved spectroscopy, TE/TR: 135/1500 ms, 15-mm section thickness, field of view 120 × 120 mm, and nominal voxel size of 10 × 10 × 10 mm. Total examination time, including setup, was approximately 30 minutes.
Image Analyses
The following characteristics were qualitatively evaluated: (1) tumor location (defined as primary lobe of involvement; frontal, parietal, temporal, occipital, insular, multilobar, or cerebellar and other sites); (2) tumor borders: well-defined was defined as where the border between tumor and normal appearing white matter can be delineated; ill-defined was where the border between tumor and normal appearing white matter is hazy or cannot be delineated; (3) peritumoral edema (presence vs absence) was defined as T2 hypersignal zone peritumoral; (4) cystic change (presence vs absence) was defined as circumscribed T2 hyperintense nonenhancing foci within the tumor; (5) cortical involvement was defined as any expansile T2 signal abnormality or contrast enhancement in the cerebral cortex; and (6) contrast enhancement (classified to 2 patterns according to the volume of contrast enhancement: <25% vs >25%). 5
Magnetic resonance spectroscopic data were analyzed by using SageIDL processing software (GE Medical Systems, Milwaukee, WI, USA). Gaussian curves were fitted to Cho and Cr peaks and peak area ratios (Cho/Cr and Cho/N-acetyl-aspartate [NAA]) were calculated. Metabolic ratios were calculated in the multiple locations: within the enhancing tumor, the peritumoral region, and normal contralateral brain parenchyma. 1 The calculation was made from the solid portion (defined on FLAIR images or CE-T1WI), avoiding hemorrhagic, calcified, necrotic, and cystic regions that might affect the measurements. Metabolite values were calculated automatically from the area under each metabolite peak by using the standard commercial software program provided by the manufacturer. Peak integral values were normalized to the internal Cr peak.
Molecular Studies
Isocitrate dehydrogenase 1/2 alterations in the hotspot codons R132 and R172 were also simultaneously assessed using bidirectional cycle sequencing of polymerase chain reaction–amplified fragments with the standard Sanger method.
The 1p/19q deletions were detected by fluorescence in situ hybridization analysis on 5-μm-thick paraffin-embedded sections using Vysis 1p36/1q25 and 19q13/19p13 dual-color probes according to the manufacturer’s instructions (Vysis Inc, Illinois, USA). The methylation status of the MGMT promoter was assessed by MSMLP Analysis (MRC Holland, Amsterdam, Netherlands) as described elsewhere. 10 Methylation analyses were performed in duplicate or triplicate, and the average ratios of each experiment and for each probe were calculated.
Telomerase reverse transcriptase (TERT) promoter mutations were analyzed by direct DNA sequencing. Cycle sequencing was carried out using the BigDye Terminator v3.1 cycle sequencing kit (Applied Biosystems; Thermo Fisher Scientific, Inc., Waltham, MA, USA) according to the manufacturer’s protocol. 11
Anti-Ki-67 antibody (clone MIB1; Dako, Denmark) was used as a primary antibody. The staining was carried out using the Dako Cytomation Autostainer Universal System (Dako, Denmark) and the Envision kit (Dako, Denmark) according to the manufacturer’s instruction. The Ki-67 percentage score is defined as the percentage of positively stained tumor cells among the total number of tumor cells assessed. 12
Statistical Analyses
Differences in clinical and MRI features between IDH-mutant (MT) and IDH-wild-type (WT) groups were analyzed using the χ2 test for categorical variables and Mann-Whitney U test for continuous variables. Receiver operating characteristic (ROC) analysis and binary logistic regression were plotted to evaluate diagnostic power including the areas under the curve (AUC). Diagnostic power is displayed in terms of SEN, specificity (SPE), positive predictive value (PPV), negative predictive value (NPV), and accuracy (ACC). Statistical analysis was conducted using SPSS (version 19.0.0; SPSS Inc, Chicago, Illinois) and GraphPad (MedCalc Inc, Mariakerke, Belgium). P values of ≤.05 were considered statistically significant.
Results
Patient Demographics
As demonstrated in Table 1, 76 cases (48 males and 28 females, age 39 ± 10.2 years) were diagnosed as LGG based on the current WHO criteria. Isocitrate dehydrogenase mutation statue, MGMT promoter methylation status, and 1p/19q co-deleted were based on the current WHO criteria. Magnetic resonance spectroscopy combined with cMRI were performed, and 72 of 76 patients evaluated MRS. Table 1 shows the summary of the main clinical and cMRI features between the groups (IDH-MT/IDH-WT).
The Main Clinical and Pathological Features of Low-Grade Gliomas (IDH-MT/WT).

Abbreviations: IDH-MT, isocitrate dehydrogenase–mutant; IDH-WT, isocitrate dehydrogenase–wild type.
In all patients with LGG, tumors were distributed as follows based on lobar anatomy: 24 frontal (26.3%), 8 temporo (10.5%), 8 fronto-temporo-insular, 8 brain stem, 6 hippocampus (7.9%), 4 parietal (5.3%), 4 fronto-insular, 4 insular, 4 lateral ventricles, 2 cerebellum, 2 callosum, and 2 sellar. Frontal tumors were more frequently IDH-MT (22/48) while no preference of location was found in IDH-WT group. All 8 brain stem tumors and 4 lateral ventricles tumors were IDH-WT.
Histologically, in IDH-MT group, 28 of 48 were astrocytomas and 20 of 48 were oliogodendroglioma with 1p/19q co-deleted. As shown in Table 2, we observed more MGMT promoter methylation cases in IDH-MT tumors compared to IDH-WT tumors (69.6% vs 28.6%, P = .0006). No significant difference in TERT mutation was seen between the 2 groups (P = .2229). Ki-67 value of tumors was also studied, and no significant correlation was noted between the 2 groups (P = .5454).
Histological Characters of 2 Subgroups.a
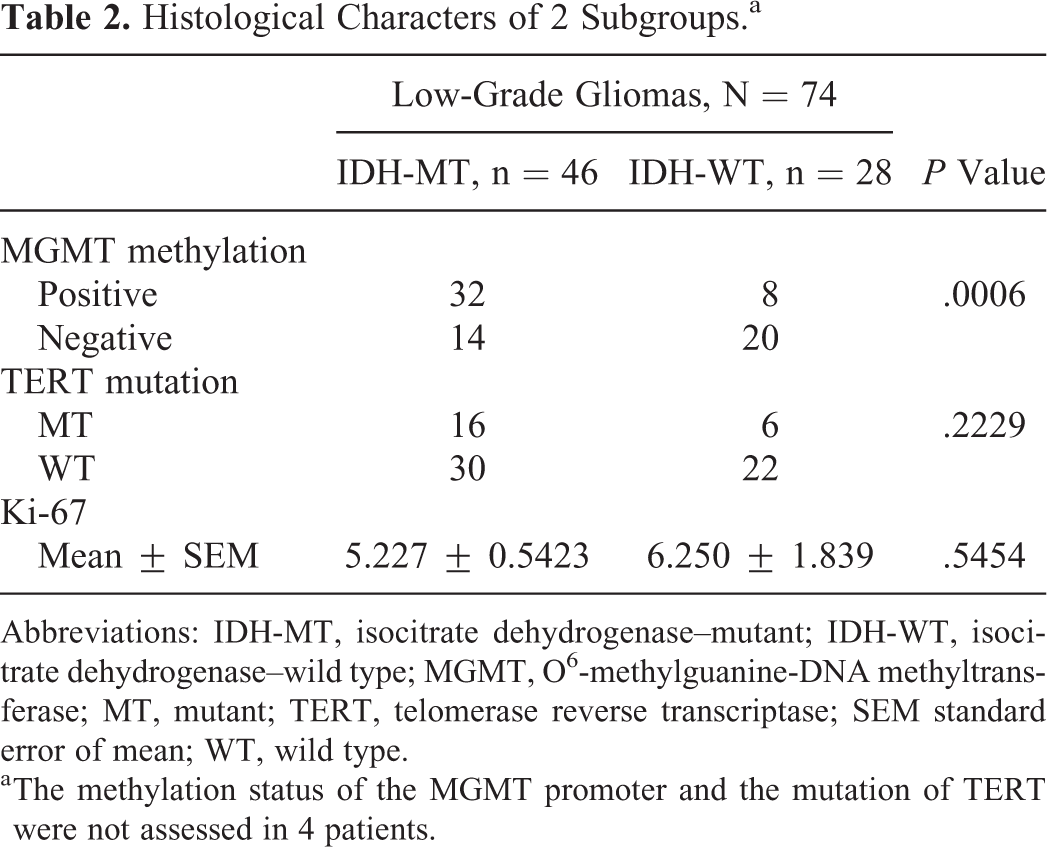
Abbreviations: IDH-MT, isocitrate dehydrogenase–mutant; IDH-WT, isocitrate dehydrogenase–wild type; MGMT, O 6 -methylguanine-DNA methyltransferase; MT, mutant; TERT, telomerase reverse transcriptase; SEM standard error of mean; WT, wild type.
a The methylation status of the MGMT promoter and the mutation of TERT were not assessed in 4 patients.
Representative MRIs of the 2 tumor groups are depicted in Figure 1. Table 3 summarizes qualitative MRI findings. Isocitrate dehydrogenase mutation was related to more frequency of cortical involvement compared to IDH-WT group (34/46 vs 6/24, P = .0001). It seemed that peritumoral edema was less frequent in IDH-MT tumors (32.6% vs 58.3% for tumors with IDH-WT tumors, P = .0381). Isocitrate dehydrogenase-WT tumors were more likely to have a nondefinable border, while IDH-MT tumors had well-defined borders (66.7% vs 39.1%). There was significant difference in contrast enhancement between the 2 groups (P < .0001). In fact, only 8 (17.4%) of 46 IDH-MT tumors in this study demonstrated marked enhancement, while this was 66.7% in WT tumors. There was a trend toward lower frequency of cystic change in IDH-WT tumors that did not meet statistical significance (P = .8042).

Representative MRIs of IDH-MT (A-C) and IDH-WT (D-F) grade II DGs. Cortical involvement presence in IDH-mutant group (A) and absence in IDH-WT group (D). Well-defined border (C) and ill-defined border (E). No enhancement (<25%; C) versus ring-like enhancement (>25%; E). IDH-MT indicates isocitrate dehydrogenase–mutant; IDH-WT, isocitrate dehydrogenase–wild type; MRI, magnetic resonance imaging.
MRI Characteristics in 2 Subgroups.a
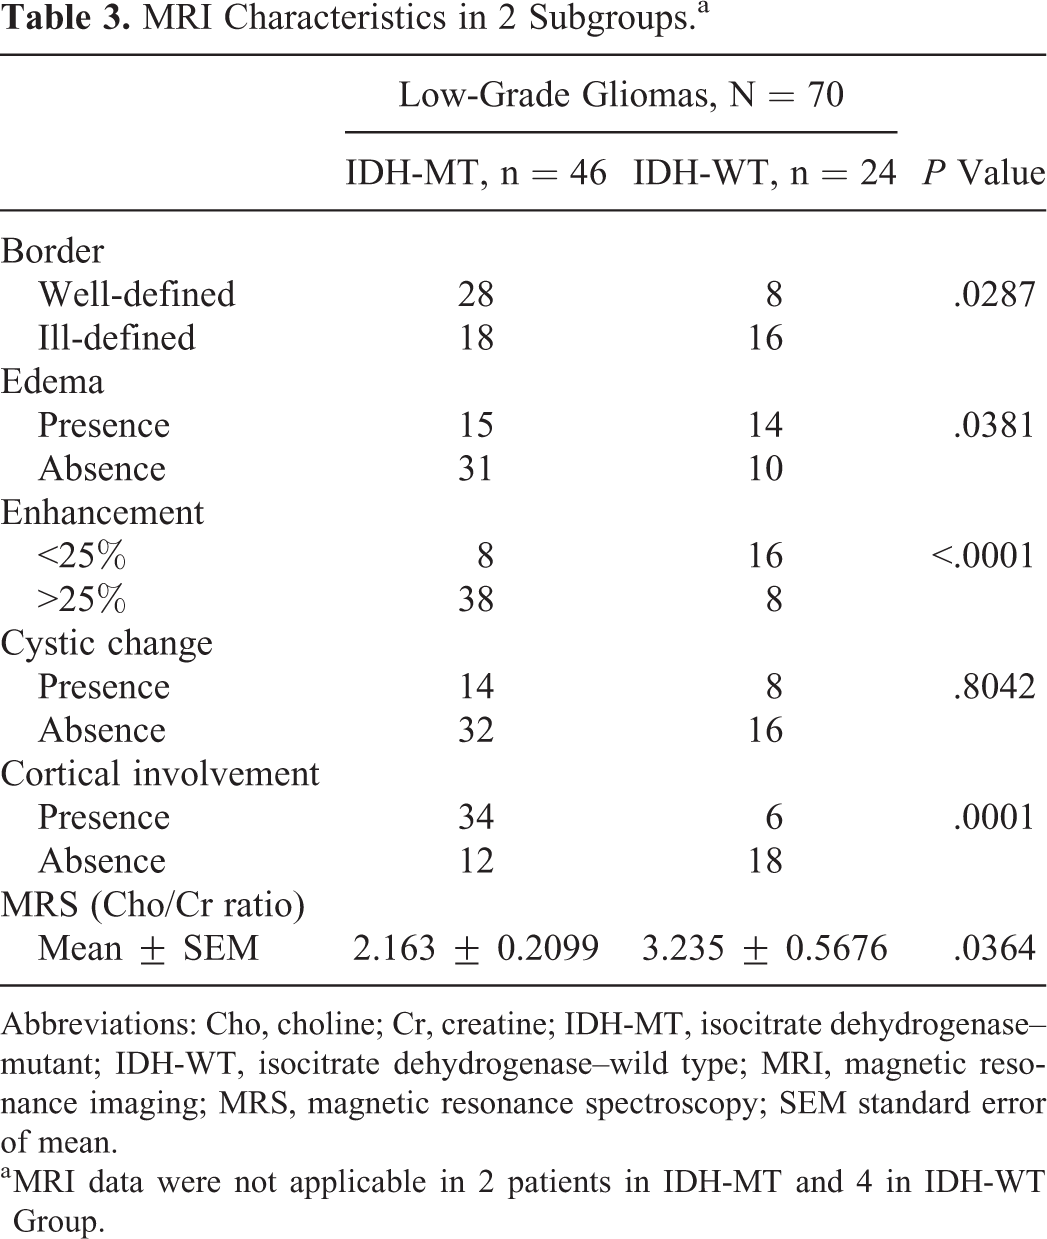
Abbreviations: Cho, choline; Cr, creatine; IDH-MT, isocitrate dehydrogenase–mutant; IDH-WT, isocitrate dehydrogenase–wild type; MRI, magnetic resonance imaging; MRS, magnetic resonance spectroscopy; SEM standard error of mean.
a MRI data were not applicable in 2 patients in IDH-MT and 4 in IDH-WT Group.
Magnetic Resonance Imaging Characteristics
Quantitative MRS parameters are depicted graphically in Figure 2. Mean Cho/Cr ratio for IDH-WT tumors (3.235 ± 0.5676) was significantly higher than that for IDH-MT tumors (2.163 ± 0.2099; P = .0364). Diagnostic power was evaluated by ROC analysis as shown in Figure 3. The ROC analysis of MRS revealed that the Cho/Cr ratio could differentiate between IDH-MT and IDH-WT gliomas with a relatively high ACC of 79.3% (SEN 89.47%, SPE 60%, PPV 80.95%, and NPV 75%). The optimal cutoff value was 2.79 (AUC 0.758, P = .025). As for cMRI characteristics, the diagnostic performance parameters were listed in Table 4. The logistic regression demonstrated the contrast enhancement and cortical involvement had predictive role in the IDH status (Supplementary Table 1).

Representative examples of MRS quantitation in IDH-MT patient (above) and IDH-WT patient (below). IDH-MT indicates isocitrate dehydrogenase–mutant; IDH-WT, isocitrate dehydrogenase–wild type; MRI, magnetic resonance imaging; MRS, magnetic resonance spectroscopy.
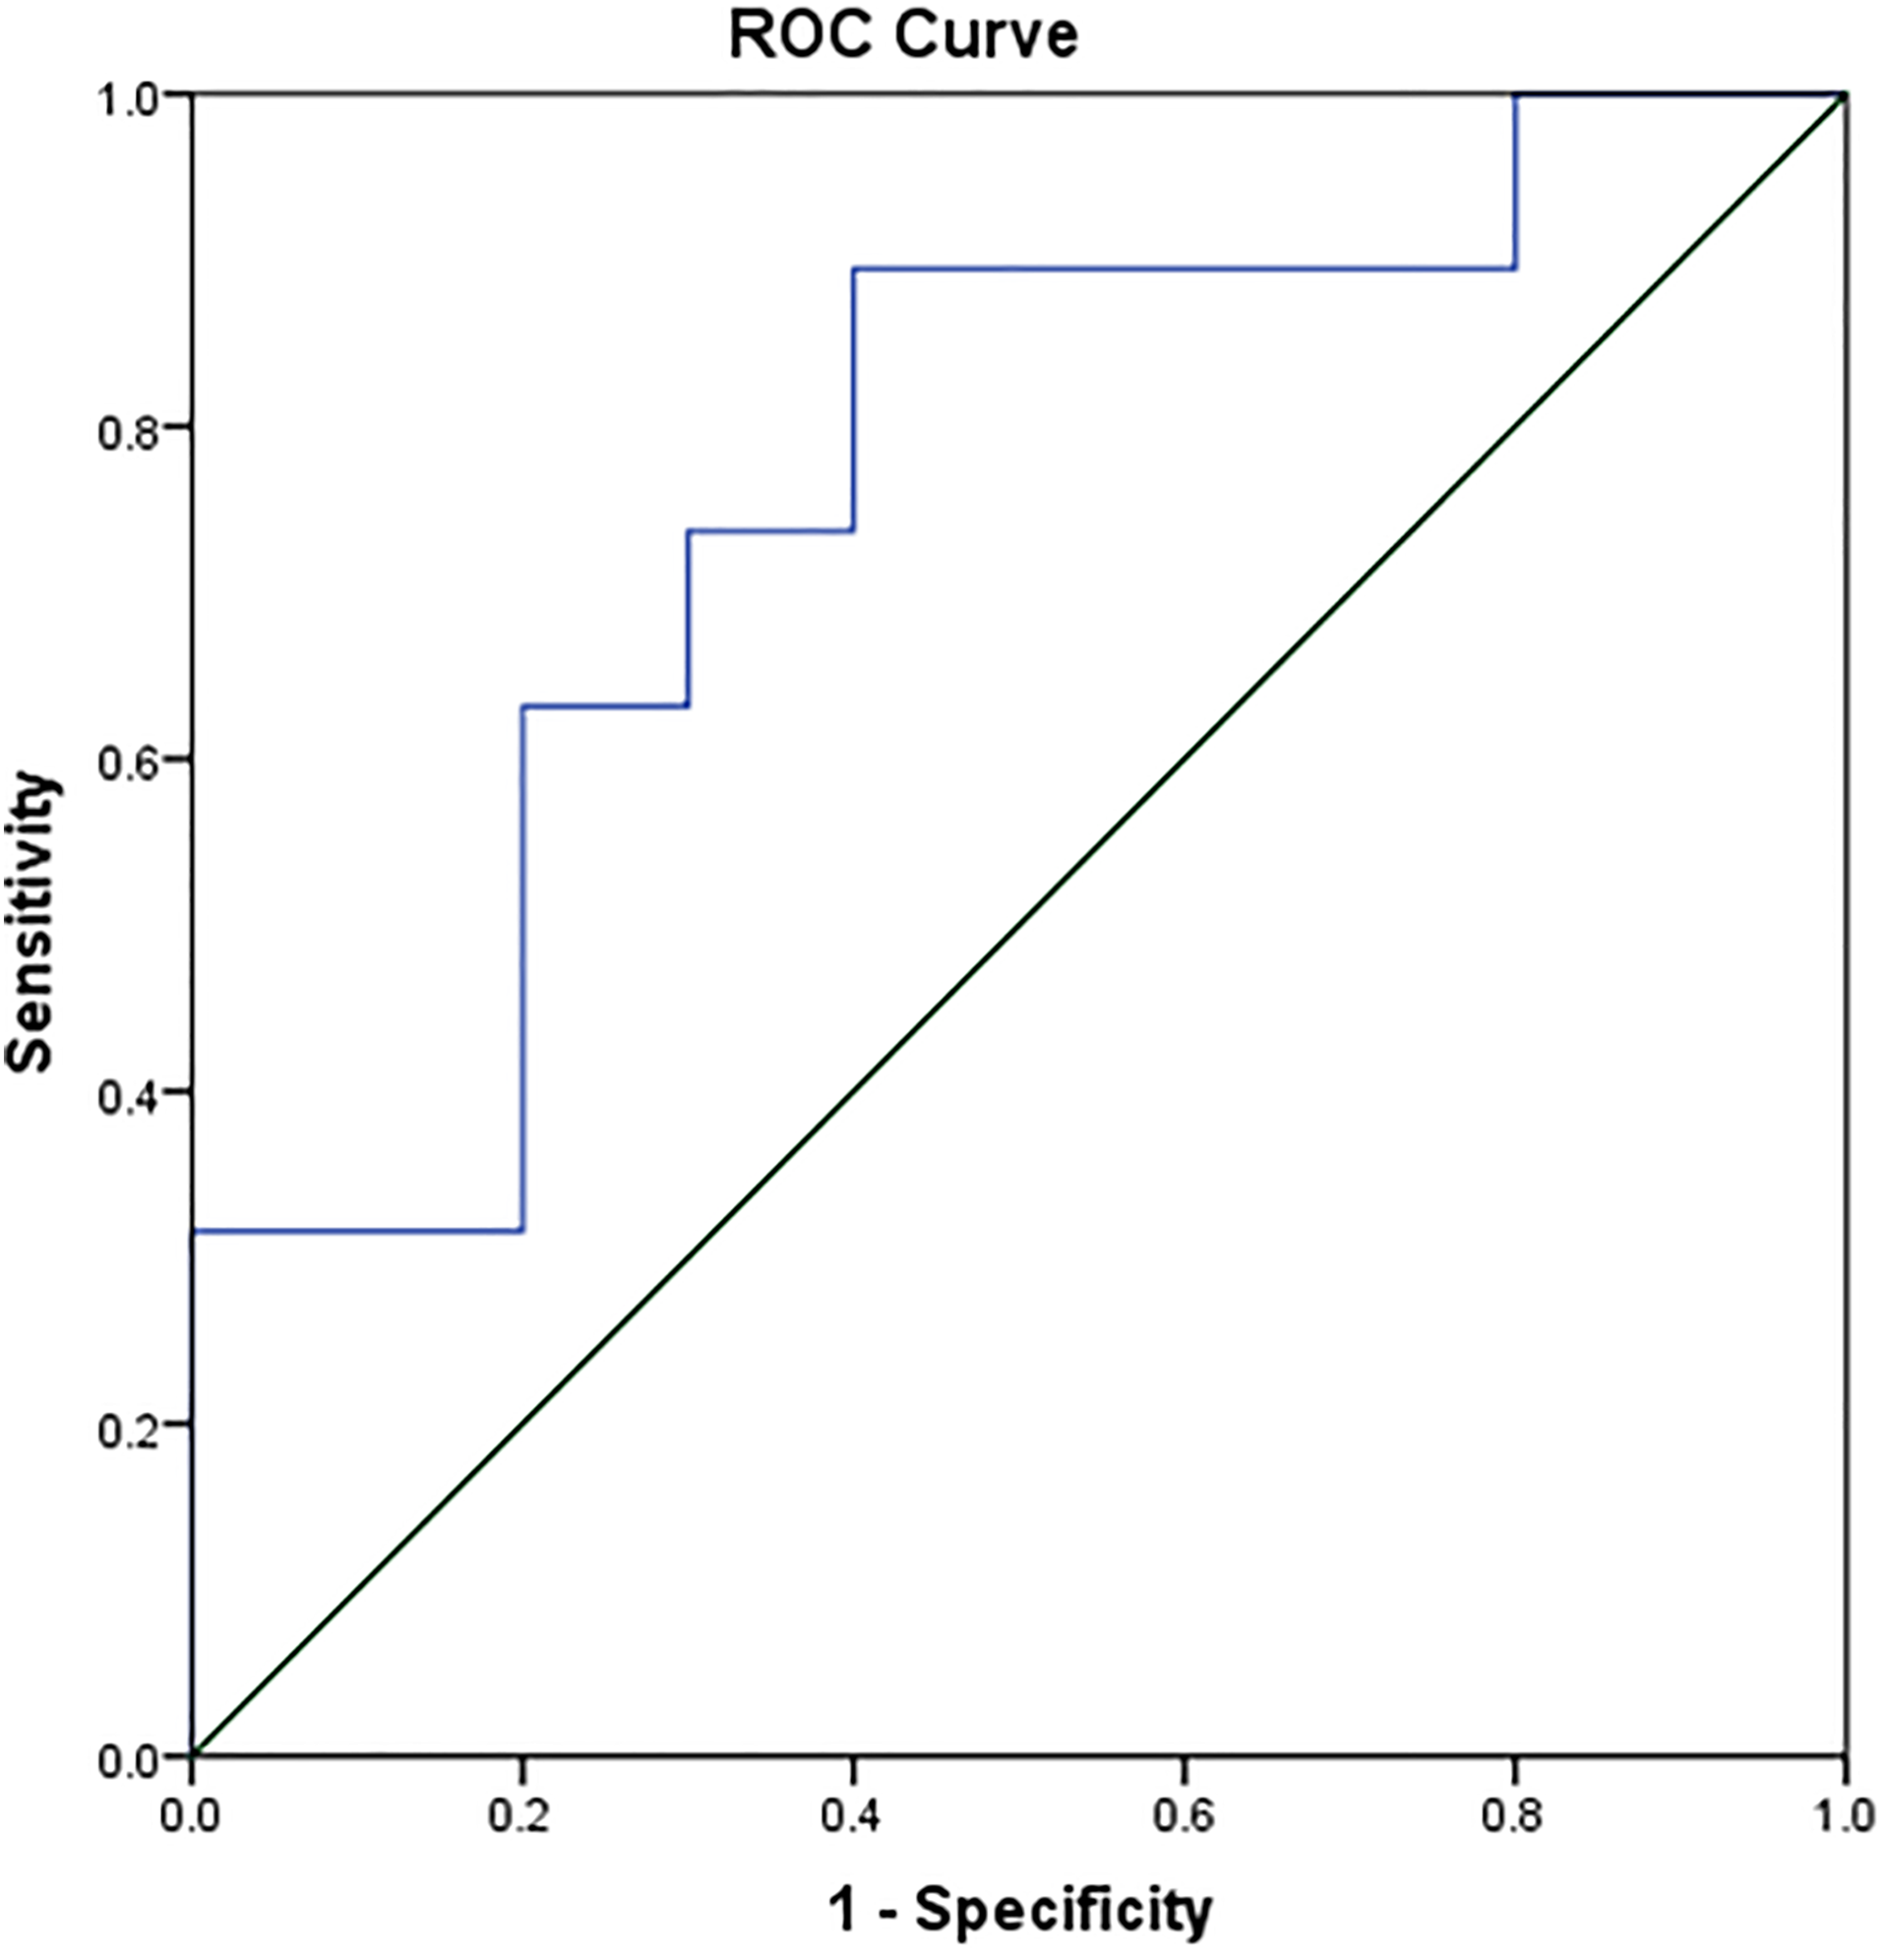
ROC curves for the identification of IDH status in grade II gliomas. IDH indicates Isocitrate dehydrogenase; ROC, receiver operating characteristic.
Diagnostic Performance Parameters of Each C-MRI Characteristic.

Abbreviations: ACC, accuracy; cMRI, conventional magnetic resonance imaging; MRS, magnetic resonance spectroscopy; NPV, negative-predictive value; PPV, positive predictive value; SEN, sensitivity; SPE, specificity.
Discussion
Isocitrate dehydrogenase mutation is an early step in gliomagenesis, which occurs in 70% to 90% of grade II gliomas. 13 Isocitrate dehydrogenase mutation is regarded as predictive markers of better SEN and prolonged survival. Besides, certain locations such as brain stem do not allow maximum resection; even if a biopsy could be applied, intertumoral heterogeneity is a potential problem with possible exclusion of tumor cell subpopulations. 14 Practically, sometimes a sampling could not be attempted owing to the abnegation of patients considering related risks. In contrast, imaging features on the initial diagnostic MRI could provide predictive and prognostic information. The prediction of IDH status prior to treatment may influence clinical decisions concerning the strategy of surgical resection and subsequent radiotherapy or chemotherapy. 5 Thus, discovering noninvasive imaging markers of IDH mutational status is an attractive area of investigation. Magnetic resonance imaging techniques, including Diffusion Weighted Imaging (DWI) and Perfusion Weighted Imaging (PWI), have been extensively studied in gliomas and shown to be associated with tumor grade and survival. 15,16 As these special MRI techniques demand optimum settings for various parameters, which have not been popularized, some researchers have focused on analyzing cMRI with different scales. Several studies have evaluated the relationship between MRI characteristics and IDH status, and only a few have directly assessed LGGs.
Concordant with previous report, LGGs show preferential locations, in particular within functional areas. Frontal tumors are associated with a better prognosis. 17 Several explanations can be hypothesized. First, the location of frontal lobe permits maximally a total surgical resection compared to other locations. 18 The extent of resection is directly associated with outcome. 19 Second, frontal tumors are more likely to have an oligodendroglial phenotype and thus a better prognosis. 20
As previously reported, IDH mutation was strongly positively associated with MGMT methylation. 21 Our study proved this correlation, consistent with the results of Leu et al, which demonstrated MGMT methylation was found in nearly 70% of LGGs. When restricted to the IDH-MT population, 84% were MGMT methylated. Isocitrate dehydrogenase mutation is regarded as a founder biochemical event in tumorigenesis that triggers methylation of genomic segments covering, among others, the MGMT gene. 22 During the course of gliomagenesis, IDH mutation and MGMT methylation are considered to be early events, followed by the acquisition of either TP53 mutation or 1p19qloh. 23 As IDH mutation/MGMT methylation combined status showed a favorable impact on overall survival, 24 further follow-up results need to be assessed.
The increased incidence of cystic change in the IDH-MT cohort, accordant with the report of Villanueva-Meyer et al, 1 may reflect the higher proportion of tumors with oligodendroglial histology seen in this group, as cystic change is frequently noted in oligodendrogliomas, 25 which signifies better prognosis. Survival results would be necessary to identify.
Isocitrate dehydrogenase-MT tumors were more frequently related with well-defined borders, while indistinct borders were more likely found in IDH-WT tumors. This differentiating FLAIR border adds to prior results of Metellus et al who found that 100% of IDH-WT tumors in their cohort had indistinct borders in contrast to only 45% of IDH-MT tumors. Given that IDH-WT tumors are known to have a survival comparable with primary glioblastomas and be suggested to behave similarly, 26 it follows that these IDH-WT tumors show a more infiltrative pattern on MRI, explaining their indistinct borders. Current guidelines for the delineation of target volume for LGG do not distinguish these 2 different types of biological behavior, but with equal extended margin. Here, we could suppose a more extensive margin specifically for the IDH-WT gliomas, which seems to be more reasonable.
Peritumoral edema was determined based on its nonenhancement on CE-T1WI and higher signal on T2 FLAIR as an indicator of tumor cell infiltration. Peritumoral edemas in IDH-WT patients are more frequently encountered in our study, mainly attributed to the high frequency of cellular/vasogenic pathogenesis in IDH-WT tumors. 27 Investigators have found that peritumoral edema is characterized by extensive infiltration of tumor. 28 Therefore, this preference of peritumoral edema in IDH-WT gliomas correspond with their higher invasiveness. Thus, in clinical practice, most studies suggested the clinical target volume (CTV) should be determined by adding an additional 1- to 2-cm margin to the hypersignal area on T2 FLAIR sequence. However, it has been demonstrated that diffuse LGGs cells could extend beyond the visible T2/FLAIR abnormality by up to 2 cm. 29 Consequently, current delineation of CTV underestimates the actual spatial extent of tumors, which suggest an extended margin in LGGs. Specifically, in the case of IDH-WT group with higher invasiveness, whether an expanded margin relative to IDH-MT group is needed should be considered.
Nodular or ring-like enhancement is association with blood–brain barrier breakdown and angiogenesis, 30 which is frequently observed in high-grade glioma. As we know, tumor formation demands excessive amount of tumor angiogenesis. However, these tumor vessels are abnormal in almost all aspects of their structure and function. The high permeability of tumor vessels leads to the leakage of gadolinium to tumor tissue around, which forms the enhancement in MRI. Significant concordance between the gadolinium enhancement in MRI and IDH-WT was found in our study (16/24 vs 8/46, P < .0001), consistent with previous finding 31 but contradictory to the theory that IDH1 mutation may facilitate angiogenesis by inhibiting aKG-dependent dioxygenases. 32 Previous study demonstrated that nonenhanced diffuse astrocytoma with IDH-WT was associated with rapid progression to ring-enhancing GBM 33 and correlated with decreased OS, 34 TTP, 35 and PFS. 36 Further follow-up of survival should be completed in our study.
Magnetic resonance spectroscopy provides information about metabolic tissue composition; 3 essential parameters have been quantified to indicate physiology and pathology status: Cho signifying membrane turnover and proliferation, Cr as energy homoeostasis, and NAA representing intact glioneuronal structures. Results are expressed as ratios rather than absolute concentrations. Magnetic resonance spectroscopy allowed to increase diagnosis ACC by 15.4% compared to MRI alone, 37 as it gauges mitosis and necrosis instead of vascularization. 38,39 Assessment of single-voxel spectroscopy (SVS) is relatively quick (3-5 minutes) and provides a global information in the selected volume, normally plotted in the center or in the solid part of tumor. Multivoxel spectroscopy (MVS) requires longer acquisition time but provides metabolic data from multiple areas within the tumor and surrounding area as well as the spatial distribution of various components. Multivoxel spectroscopy was performed in our study on the basis of the results of Steffen-Smith et al, which concluded that MVS showed heterogeneous patterns of metabolic activity within tumors and therefore was recommended for planning and monitoring targeted therapies and evaluating tumor invasion to surrounding area, while SVS is recommended for global assessment of tumor metabolism before and after therapy. 40 The high Cho/Cr ratio is thought to be a malignant feature and useful in distinguishing histological grade of gliomas, which is coherent with the higher invasiveness and malignancy of high-grade gliomas. 41,42 Consistently, here we found that Cho/Cr ratio was significantly lower for IDH-MT gliomas in comparison with IDH-WT group. The Cho/Cr ratio allowed differentiation of IDH status in grade II gliomas with relatively high ACC with an optimal AUC cutoff value of 2.79 and a SEN of nearly 90%, which indicated that Cho/Cr ratio might be a potential imaging biomarker for noninvasive evaluation of the IDH status of grade II gliomas.
Some research teams developed a new grading system using the Cho/Cr or Cho/NAA ratio. Additionally, MRS has been used to provide clinical benefits for target delineation in radiotherapy of gliomas. Graves et al used the Cho/NAA ratio to define CTV for regions with a Cho/NAA >2 and gross target volume (GTV) for those with a Cho/NAA >3. The average surface deviations and the volume overlap were reasonable and acceptable compared to T2 abnormality area. 43 The team of Narayana focused on Cho/Cr ratios and proposed a novel methodology for delineation of target volume in gliomas. Concretely, grade 0 was defined as Cho/Cr ratio <1, indicating no tumor activity or normal brain tissue; grade 1 as Cho/Cr ratio of 1 to 2, meaning some tumor activity, correlating with microscopic disease or the CTV; grade 2 represented a Cho/Cr ratio of 2-3, correlating with more aggressive anaplastic tumors; and grade 3 for Cho/Cr ratio ≥3 referring the most aggressive area, signifying the GTV (Table 5). 44,45 Obviously, our results were consistent with this grading: Mean Cho/Cr ratio was 3.235 in IDH-WT group corresponding grade 3, indicating a more aggressive feature, while mean Cho/Cr ratio in IDH-MT was 2.163 for grade 2, signifying less invasiveness. Therefore, whether a distinct target delineation approach should be made between these 2 groups of gliomas with different IDH status would be an interesting project. Besides, they demonstrated that current guideline of delineation with contrast T1 sequence overestimated the GTV by 40% compared to MRS grading system; the Cho/Cr ratio system defined CTV was 30% smaller in contrast to T2 sequence-defined volume, indicating overtreatment of normal brain tissue. 46 Whether cMRI could authentically represent the true extent of tumors as well as accurately define target volume needs to be reassessed. The Cho/Cr ratio assessment in relation to IDH mutation status might influence the delineation of target volume in grade II gliomas.
The System Used to Grade the Cho/Cr for Each MRS Voxel.a
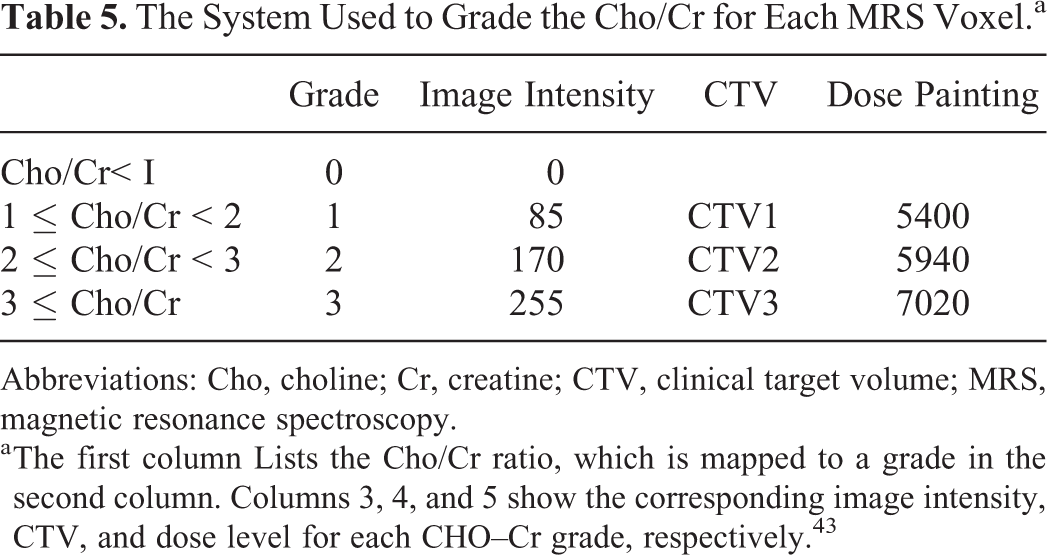
Abbreviations: Cho, choline; Cr, creatine; CTV, clinical target volume; MRS, magnetic resonance spectroscopy.
a The first column Lists the Cho/Cr ratio, which is mapped to a grade in the second column. Columns 3, 4, and 5 show the corresponding image intensity, CTV, and dose level for each CHO–Cr grade, respectively. 43
Recently,11C-MET and18F-FET PET were proved to allow a better delineation of tumor margins and improve targeting of biopsy and radiotherapy, suggesting the application of biological tumor volume defined by SUV value in radiotherapy of gliomas. 47,48 However, a meta-analysis comparing the diagnostic ACC of different imaging technique to delineate diffuse gliomas reported that for LGGs, the area under the hsROC curve was higher for MRS (0.781) than T2/FLAIR (0.774), followed by PET-MET (0.668) and PET-FET (0.649). The false-positive rate was lower in MRS (36.1%) than in PET-FET (38.5%); the true-positive rate was highest for MRS (87.3%), followed by T2/FLAIR (65.8%) and PET-FET (60%). The diagnostic odds ratio was higher for MRS (15.7) in comparison with PET-FET (2.57). Magnetic resonance spectroscopy demonstrated better diagnostic ACC compared with PET in LGGs. 49
Conclusion
Our study identified frontal location, well-defined border, increased incidence of cystic change, less peritumoral edema, lack of enhancement, and low Cho/Cr ratio as independent predictors of IDH-MT grade II glioma. The capacity of imaging to noninvasively predict the clinical behavior of grade II gliomas would be highly impactful for patients with respect to treatment planning and prognostic counseling, especially in patients in which detailed molecular assay is not yet routinely undertaken. The MRI can provide advantages in the detection of genetic characteristics indirectly, serve as reliable and robust biomarkers in the differential diagnosis prior to pathologic diagnosis, may improve clinical risk stratification, and guide personalized therapeutic strategy in patients with LGG. Owing to the infiltrative nature of LGG and the potential for microscopic invasion beyond the visible tumor boundary, 29 T2-defined volume either overestimates or underestimates the microscopic or nonenhancing disease in a majority of patients, 50 indicating the need to explore new design of treatment planning in gliomas based on the true extent of tumors and not just with an empirical margin in T2 anatomical-based imaging, among which, Cho/Cr ratio in MRS, based on diagnostic and therapeutic value, could be a potential more reasonable reference. Individualized delineation of target volume for LGG should be redefined based on different IDH statue.
Limitation
There are some limitations in our study such as the retrospective nature and small sample in single center. Further prospective multicenter study is needed. Besides, more advanced MRI techniques, including DWI and PWI, may provide more information to increase the diagnostic ACC. 1 Quantified ADC and FA values, rCBV, and so on should be completed in following step. Moreover, accumulated 2-hydroxyglutarate detected in IDH-MT tumors by MRS is a promising new tool in the noninvasive characterization of glioma. 3,51 However, as this optimized techniques was not typically available on clinical scanners and was not routinely performed in our cohort, we did not assess this in our study. In addition, all 4 brain stem gliomas did not undergo histone H3K27M analysis; also, other genetic alterations including ATRX and EGFR expression were not assessed. Finally, considering the lack of survival outcome, a long-term follow-up is under work for analysis of patients’ prognosis.
Supplemental Material
Supplemental Material, Supple_Table - Prediction of IDH Status Through MRI Features and Enlightened Reflection on the Delineation of Target Volume in Low-Grade Gliomas
Supplemental Material, Supple_Table for Prediction of IDH Status Through MRI Features and Enlightened Reflection on the Delineation of Target Volume in Low-Grade Gliomas by Haixia Ding, Yong Huang, Zhiqiang Li, Sirui Li, Qiongrong Chen, Conghua Xie and Yahua Zhong in Technology in Cancer Research & Treatment
Footnotes
Author Note
HD and YH contributed equally for the present study as first authors. HD and YZ developed the study idea, concept, and the overall study design. YH analyzed the data and generated the figures and tables. ZL undertook the collection of data and supervised the study. SL performed the analysis of MRS. QC realized the pathologic parts. HD and YH edited the manuscript. CX contributed to the manuscript. YZ supervised the study. All authors read and approved the final manuscript.
Declaration of Conflicting Interests
The author(s) declared no potential conflicts of interest with respect to the research, authorship, and/or publication of this article.
Funding
The author(s) disclosed receipt of the following financial support for the research, authorship, and/or publication of this article: The Special Funds for Basic Scientific Research of Central Universities of China (No. 2042018kf0134), the Foundation of Health and Family Planning Commission of Hubei Province of China (No. WJ2017H0014, WJ2019H072, WJ 2019H064), as well as the Innovation and Training foundation of Zhongnan Hospital of Wuhan University (No. cxpy20160082).
Supplemental Material
Supplemental material for this article is available online.
Abbreviations
References
Supplementary Material
Please find the following supplemental material available below.
For Open Access articles published under a Creative Commons License, all supplemental material carries the same license as the article it is associated with.
For non-Open Access articles published, all supplemental material carries a non-exclusive license, and permission requests for re-use of supplemental material or any part of supplemental material shall be sent directly to the copyright owner as specified in the copyright notice associated with the article.