
Abstract
Introduction
Gene and environmental factors are the main causes of the cancer. The therapy of cancers is some combination of chemotherapy, radiation therapy and targeted therapy. Unfortunately, the patient cancers are very high mortality and poor survival rate globally. Currently, it is necessary to search novel molecular markers for diagnosis and treatment of cancer. Therefore, new-type biomarkers are very necessary for clinicians to improve the survival of patient cancer.
The tRNA-derived small non-coding RNAs (tsncRNAs) are new class of ncRNAs, which can be classified into tRNA-derived fragments (tRFs), tRNA halves (tRHs) and tRNA-derived small RNAs (tsRNAs). 1 The tRFs are including 5′ tRFs, 3′ tRFs and i’ tRF. 2 The tRHs are including 5′ tRHs and 3′ tRHs. 3 The tsRNAs are also including 3′U tRNA, i'tRNA, 3′tRNA, and 5′tRNA. 4 These tsncRNAs can regulate gene expressions at both transcriptional and post-transcriptional level in bacteria, yeast, plants and animals, and play important roles in many diseases. 5 The deregulation of tsncRNAs were found in multiple human malignancies. 6 As precious study, many tsncRNAs were involved in pathogenesis and progression of cancers, such as 5′-tRFHis-GTG, 7 tRF-Leu-CAG, 8 ts-46 and ts-47, 9 and so forth. Notify, tsncRNAs were considered as diagnostic or prognostic biomarkers for cancer.10–13 But up to nowadays, the diagnostic/prognostic values of tsncRNAs are not systematically investigated. Therefore, we undertook a comprehensive meta-analysis to know different tsncRNAs in blood and solid tumors. The result suggested that tsncRNAs play important role in evaluating the early diagnostic and prognostic value in cancer.
Materials and Methods
Literature Search Strategy
Comprehensive literature searches were performed in tsncRNA and cancer. The databases included Google Scholar, MEDLINE, Scopus, PubMed, Embase, ScienceDirect, Ovid-Medline, Chinese National Knowledge Infrastructure, WanFang and SinoMed databases. The search terms for tsncRNAs were: “tRNA-derived small non-coding RNA” or tsncRNA or “tRNA-derived small non-coding RNAs” or tsncRNAs or “tRNA-derived fragments” or tRFs or “5′ tRFs” or “3′ tRFs” or “i’ tRFs” or “tRNA halves” or “5′ tRHs” or “3′ tRHs” or “tRNA-derived small RNAs” or “tsRNAs”. The search terms for cancer were: “cancer” or “tumor” or “tumour” or “neoplasm” or “neoplasma” or “neoplasia” or “carcinoma” or “cancers” or “tumors” or “tumours” or “neoplasms” or “neoplasmas” or “neoplasias” or “carcinomas”. The aim of the search was to identify research articles, reports, letters, reviews, editorials, and conference abstracts elucidation the association between tsncRNAs and cancer. The study was undertaken in accordance with the guidelines of the preferred reporting items for systematic reviews and meta-analyses (PRISMA) (protocol number: PROSPERO CRD42020213863).
Inclusion and Exclusion Criteria
There were sensitivity (SEN), specificity (SPE) and area under curve (AUC) in their diagnostic studies. Hazard ratios (HR) with 95% Cl for OS (overall survival) was included in prognostic studies. Those with diagnostic and/or prognostic tsncRNAs signatures as well as those with ex-tractable data such as the experimental and control groups data were also included. However, studies involving animal model research rather than human were excluded. Those with no control groups or comparative studies were also excluded. These were also the cases for commentaries, reviews, editorials, duplicate publications, and studies with limited or no extract-able data.
Data Extraction and Quality Assessment
Data was extracted independently by two or three authors. It included the first author's name, country, year of publication, number of cases and controls, methods of detecting tsncRNAs, sources of samples (blood and solid tumor), tsncRNA name, and tsncRNA expression signatures. Data regarding the SEN and SPE, true positive (TP), false positive (FP), false negative (FN) and true negative (TN), cutoff value and AUC values, follow-up time, HR, OS and additional quality evaluation information were also recorded. The extracted data were obtained and calculated using Revman 5 software (Review Manager, version 5.3. Copenhagen: The Nordic Cochrane Centre, the Cochrane Collaboration, 2014). Quality assessment of the included studies was performed using the 14-item quality assessment of diagnostic accuracy studies (14-item QUADAS) and Newcastle-Ottawa Scale (NOS).14,15 For studies representing data as plots or graphs, we retrieved data using GetData Graph Digitizer, v2.26 (http://getdata-graph-digitizer.com/) and Engauge Digitizer 4.1 (http://digitizer.sourceforge.net/).
Quality and Bias Assessment
Two reviewers independently assessed the quality and bias of the studies. The 14-item QUADAS contains 14 criteria, which were used to assess the quality of diagnostic studies. Nonetheless, “low”, “high” or “unclear” were used to indicate the risk of bias using scores of “1″, “0”and “U”, respectively. Studies with scores were higher than 8 deeming them as a low risk of bias. In the same line, the NOS checklist was used to assess bias of retrospective cohort studies. Studies with a NOS cumulative score of more than 6 were considered to be of high quality.
Statistical Analysis
The Stata software version 16 (Stata Corporation LCC, Texas USA) and Review Manager 5.3 were used to analyze the effect sizes of the studies. The Endnote X7 software (Clarivate Analytics, London, UK) was employed to check for duplicates among the eligible studies. In addition, the Chi2, I2 tests, L’Abbe, and Galbraith plots were employed to assess the heterogeneity of the studies. Studies with a P < 0.01 (for Chi2 test) or I2 > 50% (for I2 test) were considered to have a heterogeneous pooled effect. A fixed-effect model was used for studies lacking heterogeneity. However, a random-effect mode was employed for heterogeneous studies. The pooled SEN and SPE, summary receiver operating characteristics (SROC), AUC, positive likelihood ratio (PLR), negative likelihood ratio (NLR), diagnostic odds ratio (DOR) with corresponding 95% CI were also obtained from the diagnostic meta-analysis. Similarly, HRs with a corresponding 95% CI was also obtained from the prognostic meta-analysis. Study bias was assessed using the Deek's funnel plot asymmetry, visual funnal plot, Egger and Begg's tests.
Results
Study Selection and Study Characteristics
We analyzed the expression of tsncRNAs and examined their clinical value of cancer. After removing the duplicates, 663 papers were included. Through reviewing the titles and abstracts, 432 were excluded because they were unrelated to diagnostic and prognostic analysis topic of cancer. The left 171 studies received full-text evaluation for eligibility, and 107 of them were identified as basic studies, 49 were reviews, and therefore were all discarded. Finally, a total of 12 studies for diagnosis.11–13,16–24 5 for prognosis,11–13,24,25 and 12 for clinic pathologic feature,8,11,12,16–23,25 were included in the qualitative synthesis. We found that the tsncRNAs were likely identified as diagnostic and prognostic biomarkers of cancer. The detail characteristics of selection process are presented in the standards of PRISMA diagram in Figure 1. The studies comprised a pooled patient size of 2080, including 1545 cases for the diagnostic synthesis, and 535 cases with survival data for the prognostic meta-analysis. In addition, 946 and 391 healthy controls were included in the diagnostic and prognostic synthesis, respectively. The control entities involved healthy people,11,17,18,22 matched adjacent non-tumor tissues,8,21,23 normal tissues, 16 non-leukemic and tumor blood,13,16,21,25 nonmalignant tissue, 12 and adjacent normal tissues.19,24 The diagnoses of cancer were all confirmed histopathologically. All tissue and blood samples were obtained from patients undergoing resection surgery prior to other therapies. The primary endpoints were included OS,11,13,25 which were all statistical analyzed using the Kaplan-Meier analysis and log-rank test. The expression level of tsncRNAs was measured by the approach of quantitative real-time polymerase chain reaction (qRT-PCR), and the reference genes utilized for endogenous normalization covered U6,8,19,22,23 U43 and U48,13,25 RNU6B, 21 U38B, 24 RNU6 to 1,12,16 and RNU6 −2. 11 All study characteristics were shown in Table 1.

Study enrollment procedure in terms of the standards of the PRISMA diagram. PRISMA: preferred reporting items for systematic reviews and meta-analyses.
Main features of all included studies for diagnosis and prognosis.
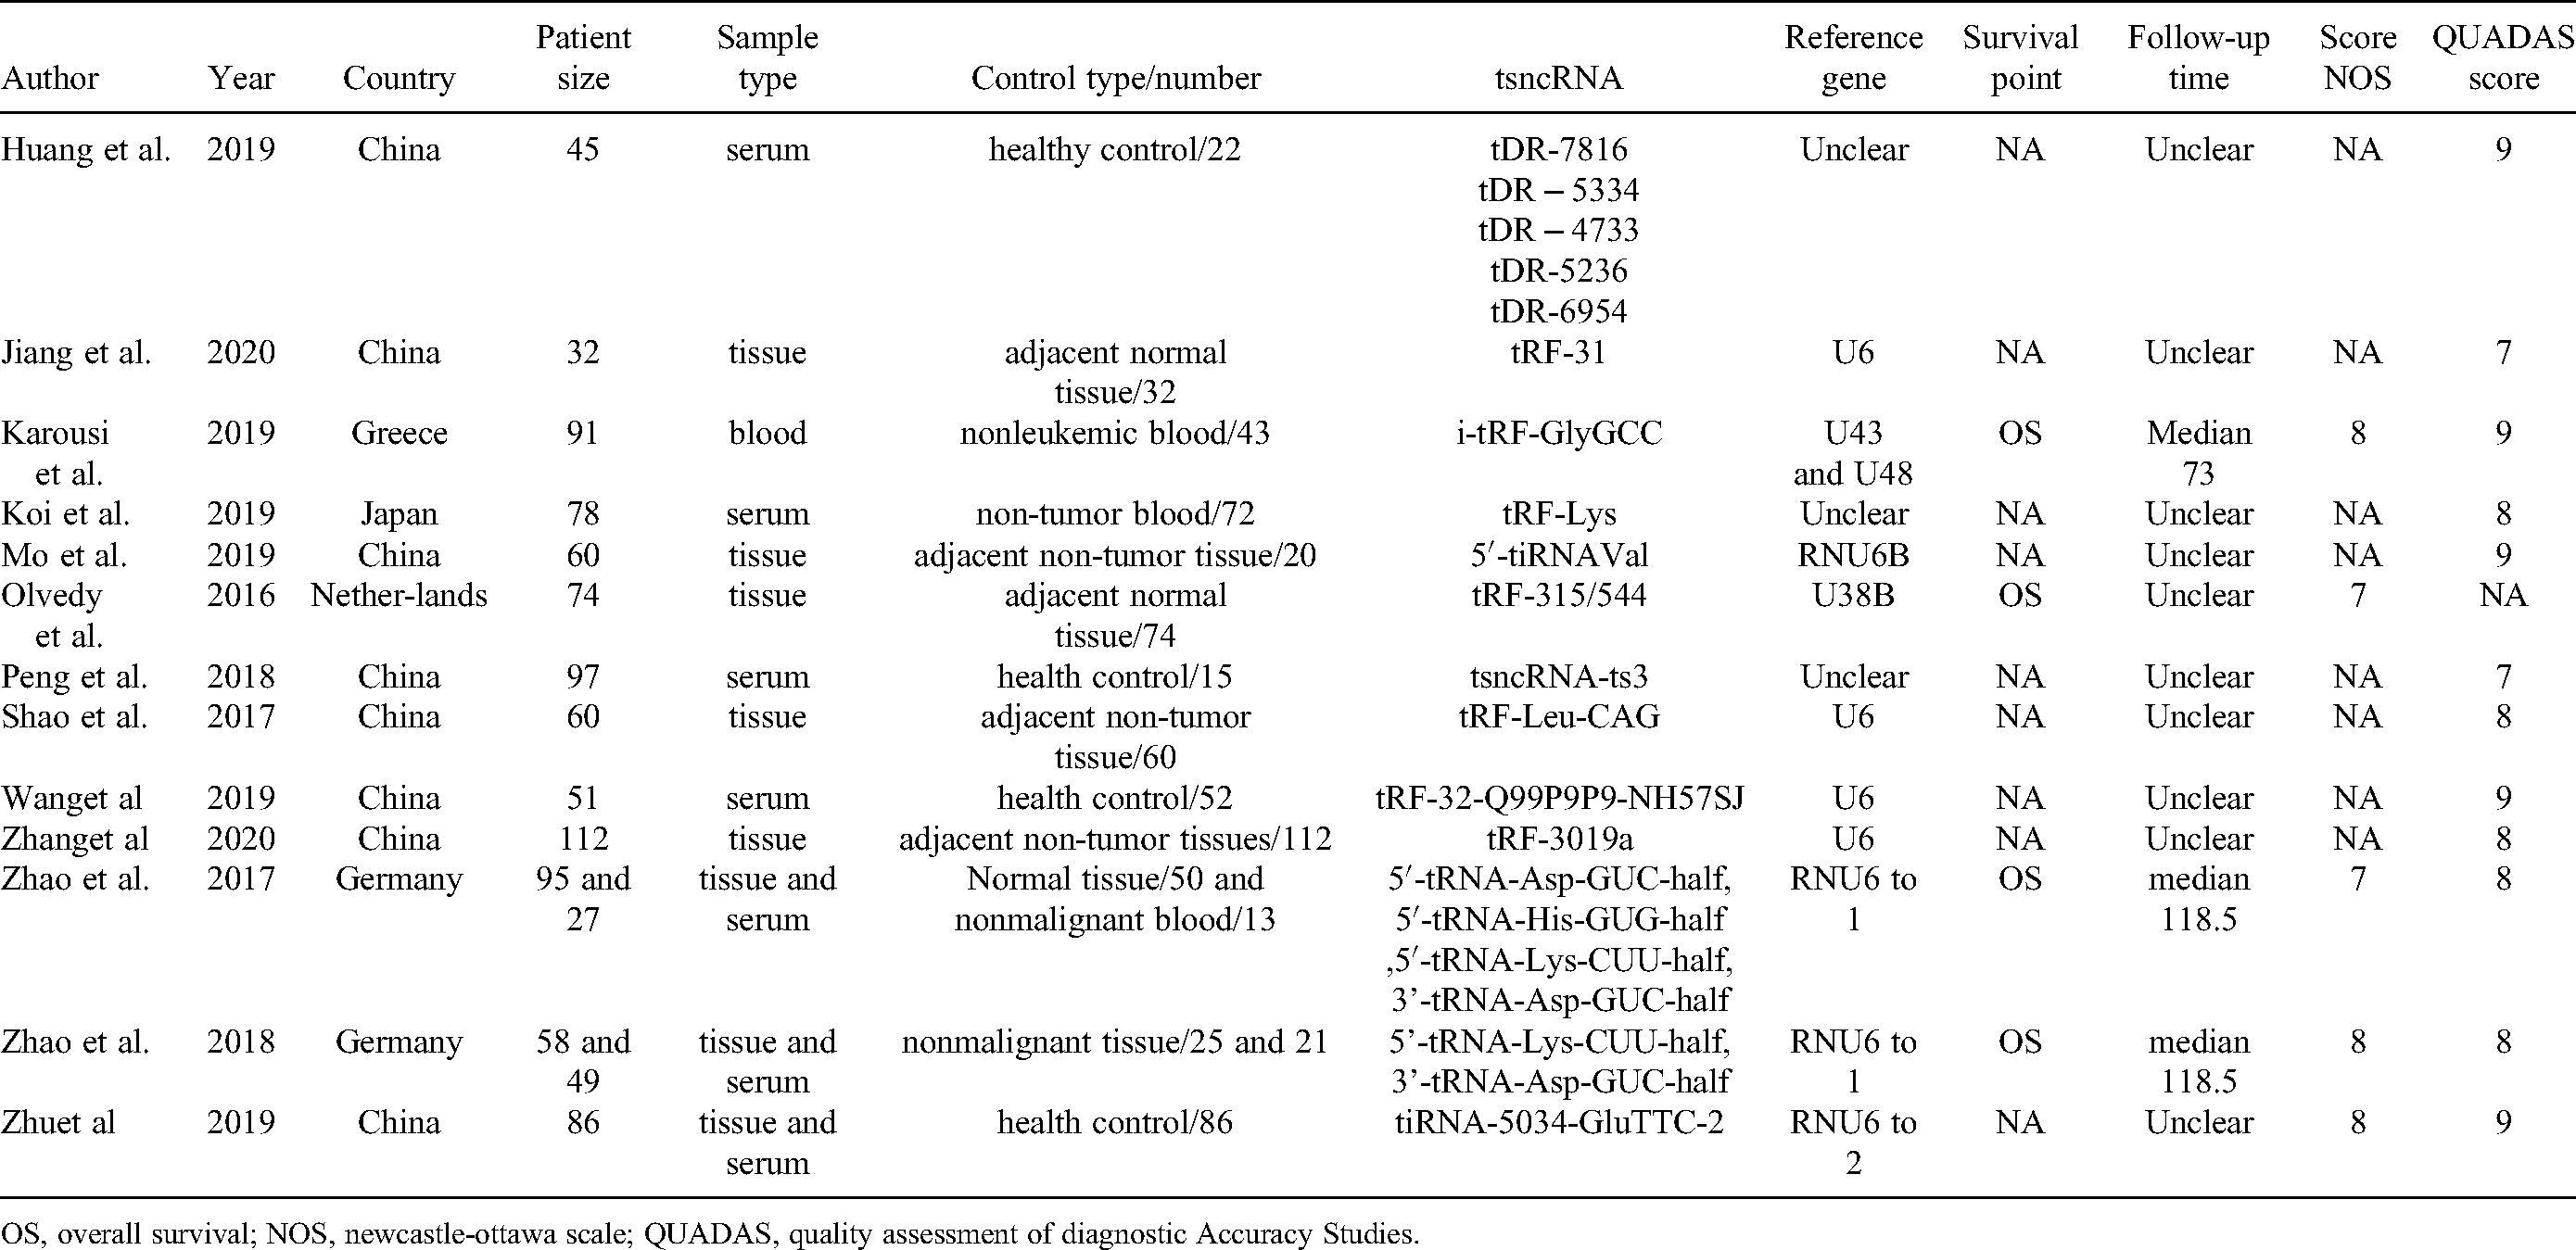
OS, overall survival; NOS, newcastle-ottawa scale; QUADAS, quality assessment of diagnostic Accuracy Studies.
Study Characteristics and Quality Assessment
Study quality judged by the 14-item QUADAS checklist revealed that no studies were in accordance with one of the item “blinding of researchers to index test” (Supplementary Table 1, Table S1). However, all the diagnostic studies obtained a cumulative evaluation score larger than 8 (Table S1); likewise, the NOS checklist also showed an evaluation score equal or greater than 6 for each retrospective cohort study, indicating that the risk of bias across studies was relatively small (Table S 2).
Heterogeneity analysis showed that there was large degree of heterogeneity existed in the pooled diagnostic studies (chi-squared = 68.46, df = 22.00, P = 0.000, I2 = 67.9%) as well as in the prognostic studies (chi-squared = 10.81, df = 8.0, P = 0.21, I2 = 26%). Heterogeneity analyses of the pooled studies by visual L’Abbe and Galbraith plots are shown in Supplementary Figure 1 (Figure S1). The study characteristics included in this analysis are presented eligibly in Table 2 and Table 3. All studies were of high quality and indicated the relatively the reliable foundation of our analysis in Table S1 and 2.
Main characteristics of studies for diagnosis analysis.

BRCA, breast cancer; CLL, chronic lymphocytic leukemia; OC, ovarian cancer; NSCLC, non-small cell lung cancer; GC, gastric cancer; ccRCC, cell renal cell carcinoma; PC, Prostate cancer; RCC, Renal cell carcinoma; U, upregulated; D, downregulated; SEN, sensitivity; SEP, sepectivity; AUC, area under the curve; TN,True negative; FP, False positive; FN,False negative; TP, True positive.
Clinical characteristics of articles enrolled in the prognosis analysis.

BRCA, breast cancer; CLL, chronic lymphocytic leukemia; OC, ovarian cancer; NSCL, non-small cell lung cancer; GC, gastric cancer; ccRCC, cell renal cell carcinoma; PC, Prostate cancer; RCC, Renal cell carcinoma; U, upregulated; D, downregulated; qRT-PCR, real-time polymerase chain reaction; OS, overall survival; HR, hazard ratio; LL, lower limit of confidence interval; UL, upper limit of confidence interval.
Diagnostic Accuracy Analysis
We identified 11 publications examining the clinical value of tsncRNA in diagnosis analysis. A total of 1545 cases of cancer and 946 control cases were included. The forest plots of pooled sensitivity, specificity, SROC curve as well as the Fagan's plot are displayed in Figure 2. Forest plots of the sensitivity and specificity of tsncRNA are presented in Figure 2A and 2B. The heterogeneity I2 values (I2 >50%) was took by using a bivariate binomial mixed model. The pooled sensitivity was 0.72 (95% CI, 0.62-0.80), and the pooled specificity was 0.73 (95% CI, 0.65-0.80). The SROC curve was plotted and the AUC was 0.79 (95% CI, 0.75-0.82) in Figure 2C. The Fagan's nomogram displayed that the pre-test probability was 20% in Figure 2D. The forest plots of pooled positive likelihood ratio (PLR), negative likelihood ratio (NLR), and diagnostic score and adds ratio (DOR) are revealed in Figure S2. The PLR was 2.68 (95% CI, 2.08-3.44), and the NLR was 0.38 (95% CI, 0.29-0.51) in Figure S2A and B. The summary assessment of tsncRNA in the diagnosis of cancer showed that the diagnostic score was 1.94 (95% CI, 1.51-2.38), and DOR was 6.89 (95% CI, 4.52-10.78) in Figure S2B, respectively. An LR scattergram was used to evaluate the clinical value of different diagnostic tests and divided into four quadrants in Figure S2C. Almost eligible studies were in the right lower quadrants except one study, suggesting that tsncRNAs were useful in diagnosing cancer. The results also suggested that tsncRNAs may be valuable as diagnostic tool in detection of cancer.

Diagnostic accuracy analysis. Forest plots of pooled sensitivity (A), specifcity (B), SROC curve (C) and Fagan's plot (D) for the overall combined diagnostic effect size. SROC: summary receiver operating characteristic.
Prognostic Value of tsncRNA Expression for Cancer Survival
Totally, 7 studies provided reported overall survival data and 6 articles concerning Kaplan-Meier curves were calculated to obtain HRs and their 95% CIs. First, oncogenic and tumor-suppressor tsncRNA were analyzed to obtain their HRs values. The pooled HR is 0.94 (95% CI: 0.64-1.38, P = 0.75) with significant heterogeneity (I2: 26%) in Figure 3.

Diagnostic and prognostic value analysis. Diagnostic value of tsncRNA in different cancer (A). Forest plots for OS according to tsncRNA in cancer (B). OS: overall survival; tsncRNA: tRNA-derived small non-coding RNAs.
Influence Analysis and Subgroup Study
Influence analysis was employed to trace the outlier values across combined effect sizes. The fixed effect estimates displayed no outlier values either in the diagnostic meta-analyses and prognostic studies in Figure 4A and 4B, respectively, which indicated that our results were relatively reliable.

Influence analysis. The sensitivity analysis of the overall combined diagnostic meta-analysis (A) and prognostic meta-analysis (B).
Further stratified study grouped by clinic pathologic features, the relationship between tsncRNA expression and clinic pathological characteristics exhibited in the diagnosis and prognosis of patients with cancer in Figure 5. The oncogenic and tumor-suppressor tsncRNA were analyzed to obtain their diagnostic studies and prognostic studies in Figure 5A and 5B. The results revealed that the diagnostic ability in different patients in different subgroup (oncogenic tsncRNA analysis: RR: 0.76, 95% CI: 0.59-0.92; tumor-suppressor tsncRNA analysis: RR: 0.65, 95% CI: 0.56-0.75) in Figure 5A. The results showed that the prognosis of patients in different subgroup (oncogenic tsncRNA of OS analysis: HR = 0.67, 95% CI: 0.48-0.94, p = 0.02; tumor-suppressor tsncRNA of OS analysis: HR = 1.41, 95% CI: 0.84-2.37, p = 0.19) in Figure 5B. The oncogenic tsncRNA may be a favorable prognostic factor in cancer.

Subgroup analysis. Subgroup study for diagnosis (A) and overall survival (B) according to the type of oncogenic tsncRNA and tumor-suppressor tsncRNA in patients with cancer. tsncRNA: tRNA-derived small non-coding RNAs.
Publication Bias and Sensitivity Analyses
The publication bias of diagnostic studies was checked by Deeks’ test (P = 0.46, Figure 6A), which indicatied no potential bias. The Egger's test of Diagnostic articles were in Figure 6B. As for prognostic articles, the p values of Begg's and Egger's test were 0.005 and 0.034, respectively (Figure 6B and 6C). Thus, there were no publication biases in the studies enrolled in the current study.

Funnel plots of publication bias. Deeks’ funnel plot asymmetry test for diagnostic studies (A). Egger's funnel plot for diagnostic tests (B). Begg's funnel plot for prognostic tests (C). Egger's funnel plot for prognostic tests (D).
Discussion
Diagnosis of malignant cancer still hitherto relies on biomarker although the sensitivities and/or specificities are not up to standard. Many patients are not easily diagnosed in the early stage but are nominally confirmed malignant cancer in a later stage. The later cancer is not only with high mortality rate, but also the cancer increases patients’ economic burden. Therefore, people need to find out more sensitive biomarkers to diagnose cancer. tsncRNA had found in all kinds of malignant tumors in recent year.2,24,26–32 If tsncRNAs are as biomarkers in the early diagnosis of cancer, and the patients and clinicians are benefit from them.
In this meta-analysis review, we thoroughly searched multiple databases and retrieved 14 eligible publications were identified. Up today, this study is the first meta-analysis of tsncRNAs in cancer. Meta-analysis showed that the combined sensitivity, specificity, and DOR for the tsncRNA were 72.00%, 73.00%, and 6.89, respectively. The sensitivity and specificity are as terms in the diagnostic performance, while the DOR combines the strengths of sensitivity and specificity. A higher value of DOR represents a better discriminatory test performance. The DOR for the tsncRNA was 6.89 which is larger than 1.0, which suggested that the diagnosis was significant for patients in cancer. The PLR and NLR were 2.68 and 0.38, respectively. The PLR suggests that a patient with cancer is 7.05 times more likely to have positive results on tsncRNA tests than a normal person, and the NLR suggests that the probability of a false negative result basted on tsncRNA signature detection was 0.38. The AUC of the combined ROC curve for tsncRNA in diagnosing cancer was 0.79. As we are known, the AUC of SROC is evaluated the overall test property. A value of AUC is from 0.75 to 0.92, which is an acceptable value. The AUC showed that tsncRNA was good diagnostic accuracy in cancer. In addition, we found the large degree of heterogeneities in diagnostic studies, and we also try to interpret the reasons. Therefore, we unitized subgroup analysis to evaluate the diagnostic efficacy. The result revealed that the heterogeneities may be come from the different kind of tsncRNA, such as tumor-suppressor and oncogenic tsncRNA. The heterogeneities of tumor-suppressor tsncRNA was 56.4%, and the heterogeneities of oncogenic tsncRNA was 67.9%, and P < 0.001, which is acceptable. These data suggested tumor-suppressor and oncogenic tsncRNAs may have high diagnostic efficacy in cancer, and therefore could be as a new biomarker for cancer.
We evaluated the efficacy of tsncRNA expression profile as an independent marker for cancer prognosis by systematic analysis. We found that altered expression of tsncRNA profile was significantly associated with poor OS time of cancer (HR = 0.94, with 95% CI: 0.22-1.80, and P = 0.75). We also further used subgroup analysis to interpret this phenomenon. The result revealed that the heterogeneities of tumor-suppressor tsncRNA reduced to 0%, and the heterogeneities of oncogenic sncRNA was 5%, and oncogenic tsncRNA was significantly associated with OS time (HR = 0.67, with 95% CI: 0.48-94, and P = 0.02). The oncogenic tsncRNA may be a favorable prognostic factor and high prognostic efficacy in cancer, and therefore could be as a new biomarker for cancer.
Obviously, there are also some limitations in this study. Firstly, the small sample size (12 studies for diagnostic meta-analysis and 5 studies for prognostic meta-analysis) may contribute to the study bias. Secondly, different studies utilized non-unified reference gene in determining the validity of the results, which may affect the interpretation of the results. Besides, the studies of tsncRNAs were as diagnostic and prognostic biomarker in cancer only in recent years, and different cancer of studies may be influence the results. Consequently, further many studies are carried out to testified that tsncRNAs would be surely and stably diagnostic and prognostic biomarker in cancer.
Conclusion
The result may suggested that tsncRNAs were prognostic and prognostic factors in cancer. Meanwhile, the present study may help to understand the importance of tsncRNAs expression signature on diagnostic and prognostic of cancer. The prospective large-scale studies would further evaluate tsncRNA as diagnostic and prognostic biomarkers for cancer. It is believed that tsncRNA could be useful and diagnostic and prognostic accuracy tool for clinical practice in the future.
Supplemental Material
sj-doc-1-tct-10.1177_15330338211072989 - Supplemental material for A Systematic Review of tRNA-Derived Small non-Coding RNAs as Diagnostic and Prognostic Markers in Cancer
Supplemental material, sj-doc-1-tct-10.1177_15330338211072989 for A Systematic Review of tRNA-Derived Small non-Coding RNAs as Diagnostic and Prognostic Markers in Cancer by Liyun Gao, PHD, Lin Xu, MM, and Xin Wang, MD in Technology in Cancer Research & Treatment
Footnotes
Abbreviations
Funding
This work was funded by the grants of the National Natural Science Foundation of 18 China (81502843, 81360447), Jiangxi Natural Science Foundation Project 19 (20202BAB206067), Jiujiang base and talent plan - high level scientific and technological innovation talent project (S2020QNZZ011) and Freescience editorial team.
Availability of Data and Materials
Data and materials will be provided to those who are interested in this meta-analysis by the correspondence.
Conflicts of Interest
The authors declare no competing financial interests.
Ethics Approval and Consent to Participate
Our study was approved by The Mercy Health Research Ethics Committee (approval no. XYZ123) and PROSPERO (CRD42020213863). All patients provided written informed consent prior to enrollment in the study.
Consent for Publication
All the authors agree with the publication of this meta-analysis
Declaration of Conflicting Interests
The author(s) declared no potential conflicts of interest with respect to the research, authorship, and/or publication of this article.
Funding
The author(s) disclosed receipt of the following financial support for the research, authorship, and/or publication of this article: This work was funded by the grants of the National Natural Science Foundation of China (81502843, 81360447), Jiangxi Natural Science Foundation Project (20202BAB206067) and Jiujiang base and talent plan - high level scientific and technological innovation talent project (S2020QNZZ011), Future project of Jiujiang administration of traditional Chinese medicine (2021b697).
Supplemental Material
Supplemental material for this article is available online.
References
Supplementary Material
Please find the following supplemental material available below.
For Open Access articles published under a Creative Commons License, all supplemental material carries the same license as the article it is associated with.
For non-Open Access articles published, all supplemental material carries a non-exclusive license, and permission requests for re-use of supplemental material or any part of supplemental material shall be sent directly to the copyright owner as specified in the copyright notice associated with the article.