
Abstract
Objective:
Dysregulation of long noncoding RNA is associated with a variety of cancers and LncRNA has anticancer or carcinogenic activities. PVT1, as a long noncoding RNA, plays an important role in the development of cancer.
Methods:
We use R to download and analyze the data in TCGA database. ROC curve is generated to evaluate the significance of PVT1 expression for the diagnosis of prostate cancer. Chi-square test is used to test correlation between PVT1 expression and clinical pathological features. Survival curve and univariate and multivariate cox regression analysis is performed to compare differences in the effect on the survival rate between PVT1 high expression and low expression.
Results:
The expression of PTV1 in tumor tissues was significantly higher than that in normal tissues(P<2.2e-16). The difference of PTV1 expression was observed according to vital status (P = 0.0051) and Gleason score (P = 0.0012). The expression of PTV1 is significantly associated with T classification (P < 0.0001), N classification (P = 0.0499), PSA (P = 0.0001), Gleason Score (P < 0.0001), targeted molecular therapy (P = 0.0264) and vital status(P = 0.0036). The area under the ROC curve (AUC) was 0.860, which revealed PTV1 expression has excellent diagnostic value in prostate cancer. Patients with high PVT1 expression had a worse prognosis.
Conclusions:
PVT1 expression may be a biomarker for the diagnosis and prognosis of prostate cancer.
Introduction
Prostate cancer, a common epithelial malignancy, remains the leading cause of cancer-related deaths in the male worldwide. 1 -3 Currently, there are many clinical treatments for prostate cancer, such as active surveillance, radical prostatectomy, radiotherapy and so on. 4 Although great progress has been made in the diagnosis and treatment of prostate cancer, the prognosis of prostate cancer is poor and patients after treatment prone to relapse, 5,6 so it is important to evaluate the prognosis of prostate cancer patients for the treatment of the disease and survival of patients. In the past years, clinicians used TNM classification (T: tumor size, N: lymph node, M: metastasis) and residual tumor (R0: pathological residual, R1: Microscopic residual, R2: Gross residual) to evaluated the prognosis. Recently, many researchers have focused on finding molecular markers of tumors for clinical use in determining disease progression, 7 so it is of great value to find reliable molecular markers to predict patient prognosis.
With the development of the whole genome, it has been found that long noncoding RNA in cancers changes in transcriptional, Genomic, and epigenetic levels, and studies have confirmed that long noncoding RNA has carcinogenic or anticancer activity. 8 PVT1(plasmacytoma variant translocation 1), also known as PVT1 oncogene, is a long intergenic noncoding RNA that is located in 8q24.21 of human chromosomes 9 and it’s adjacent to the oncogene Myc. 10 The diffusion and metastasis are unique features of malignancy. 11 PVT1 plays a complex role in regulating cell growth, differentiation, and other biological processes, and is closely related to common diseases such as malignant tumor. High expression of PVT1 promotes the proliferation and differentiation of tumor cells through trans-activation of c-Myc. 12 In addition, PVT1 also can regulate miRNA-mediated interaction networks, leading to breast cancer development. 13 PVT1 inhibit apoptosis by down-regulated expression of SMAD4 protein in the TGF-β signaling pathway and inhibiting the cleavage and activation of PARP and Caspase 3. 14 Presently, its expression level has been studied as a potential biomarker for various cancers, such as gastric cancer, 15 pancreatic cancer, 16 lung cancer 17 and colorectal cancer. 18 However, the potential role of PVT1 expression in the diagnosis and prognosis assessment of prostate cancer patients has not been determined.
In this study, We analyzed the difference of PVT1 expression between healthy people and cancer patients and evaluated the potential association between PVT1 expression and clinicopathological characteristics by analyzing the TCGA database. In addition, we also assessed the value of PVT1 expression in the diagnosis of prostate cancer. Furthermore, the effects of PVT1 expression on overall survival and relapse-free survival were analyzed. Taken together, our findings indicate that PVT1 may be a useful biomarker for the diagnosis and prognosis of prostate cancer.
Materials and Methods
Data Mining of TCGA Database
RTCGAToolbox package in R was used to obtain PVT1 RNA-Seq data and clinical information of patients from TCGA-PRAD database. 19 The data obtained is used for a series of statistical analysis.
Statistical Analysis
Box diagram was used to show the difference in expression of PVT1. Box diagrams and chi-square tests were used to assess the relationship between PVT1 expression and clinical characteristics. We divided the patients into high expression and low expression groups of PVT1. ROC curve was applied for assessing the value of PVT1 expression in the diagnosis of prostate cancer. 20 Kaplan-Meier curves were used to evaluate the effect of PVT1 expression on overall survival and relapse-free survival. Univariate cox regression analysis was used to screen for factors affecting overall survival and relapse-free survival. Multivariate cox analysis was used to evaluate the value of PVT1 expression as an independent prognostic factor. 21 P value < 0.05 is considered as significant difference.
Results
The Clinical Characteristics and PVT1 Expression of Study Population
The patient’s clinical characteristics can accurately reflect the patient’s physical state. Therefore, we downloaded the gene expression value and clinical data of 498 patients from TCGA-PRAD, including the patient’s age, TNM stage, PSA, and Gleason score, as well as zone of origin, histological type, targeted molecular therapy, radiation therapy, residual tumor, survival status, sample type and the expression of PVT1 (Table 1).
Clinical Characteristics of the Patients Included in the Present Study.

Difference of PVT1 expression between normal and tumor groups and potential association between PVT1 expression and clinical characteristics in prostate cancer
In order to understand the difference of PVT1 expression between normal tissue and prostate cancer tissue and the relationship between PVT1 expression and clinicopathological characteristics, we analyzed 52 healthy people with gene expression value and 498 tumor patients with clinical data and gene expression value in TCGA-PRAD database. It was found that the expression of PVT1 in tumor tissues was significantly higher than that in normal tissues(P<2.2e-16). In addition, boxplot showed that the difference of PVT1 expression was observed according to survival status(P = 0.0051) and Gleason Score(P = 0.0012) (Figure 1). Next, the chi-square test was used to assess the correlation between PVT1 expression and clinicopathological characteristics. As shown in Table 2, high expression of PVT1 is significantly associated with more severe T classification(P = 0), N classification(P = 0.0499), PSA(P = 0.0001), Gleason Score(P = 0), targeted molecular therapy(P = 0.0264) and poor vital status(P = 0.0036).
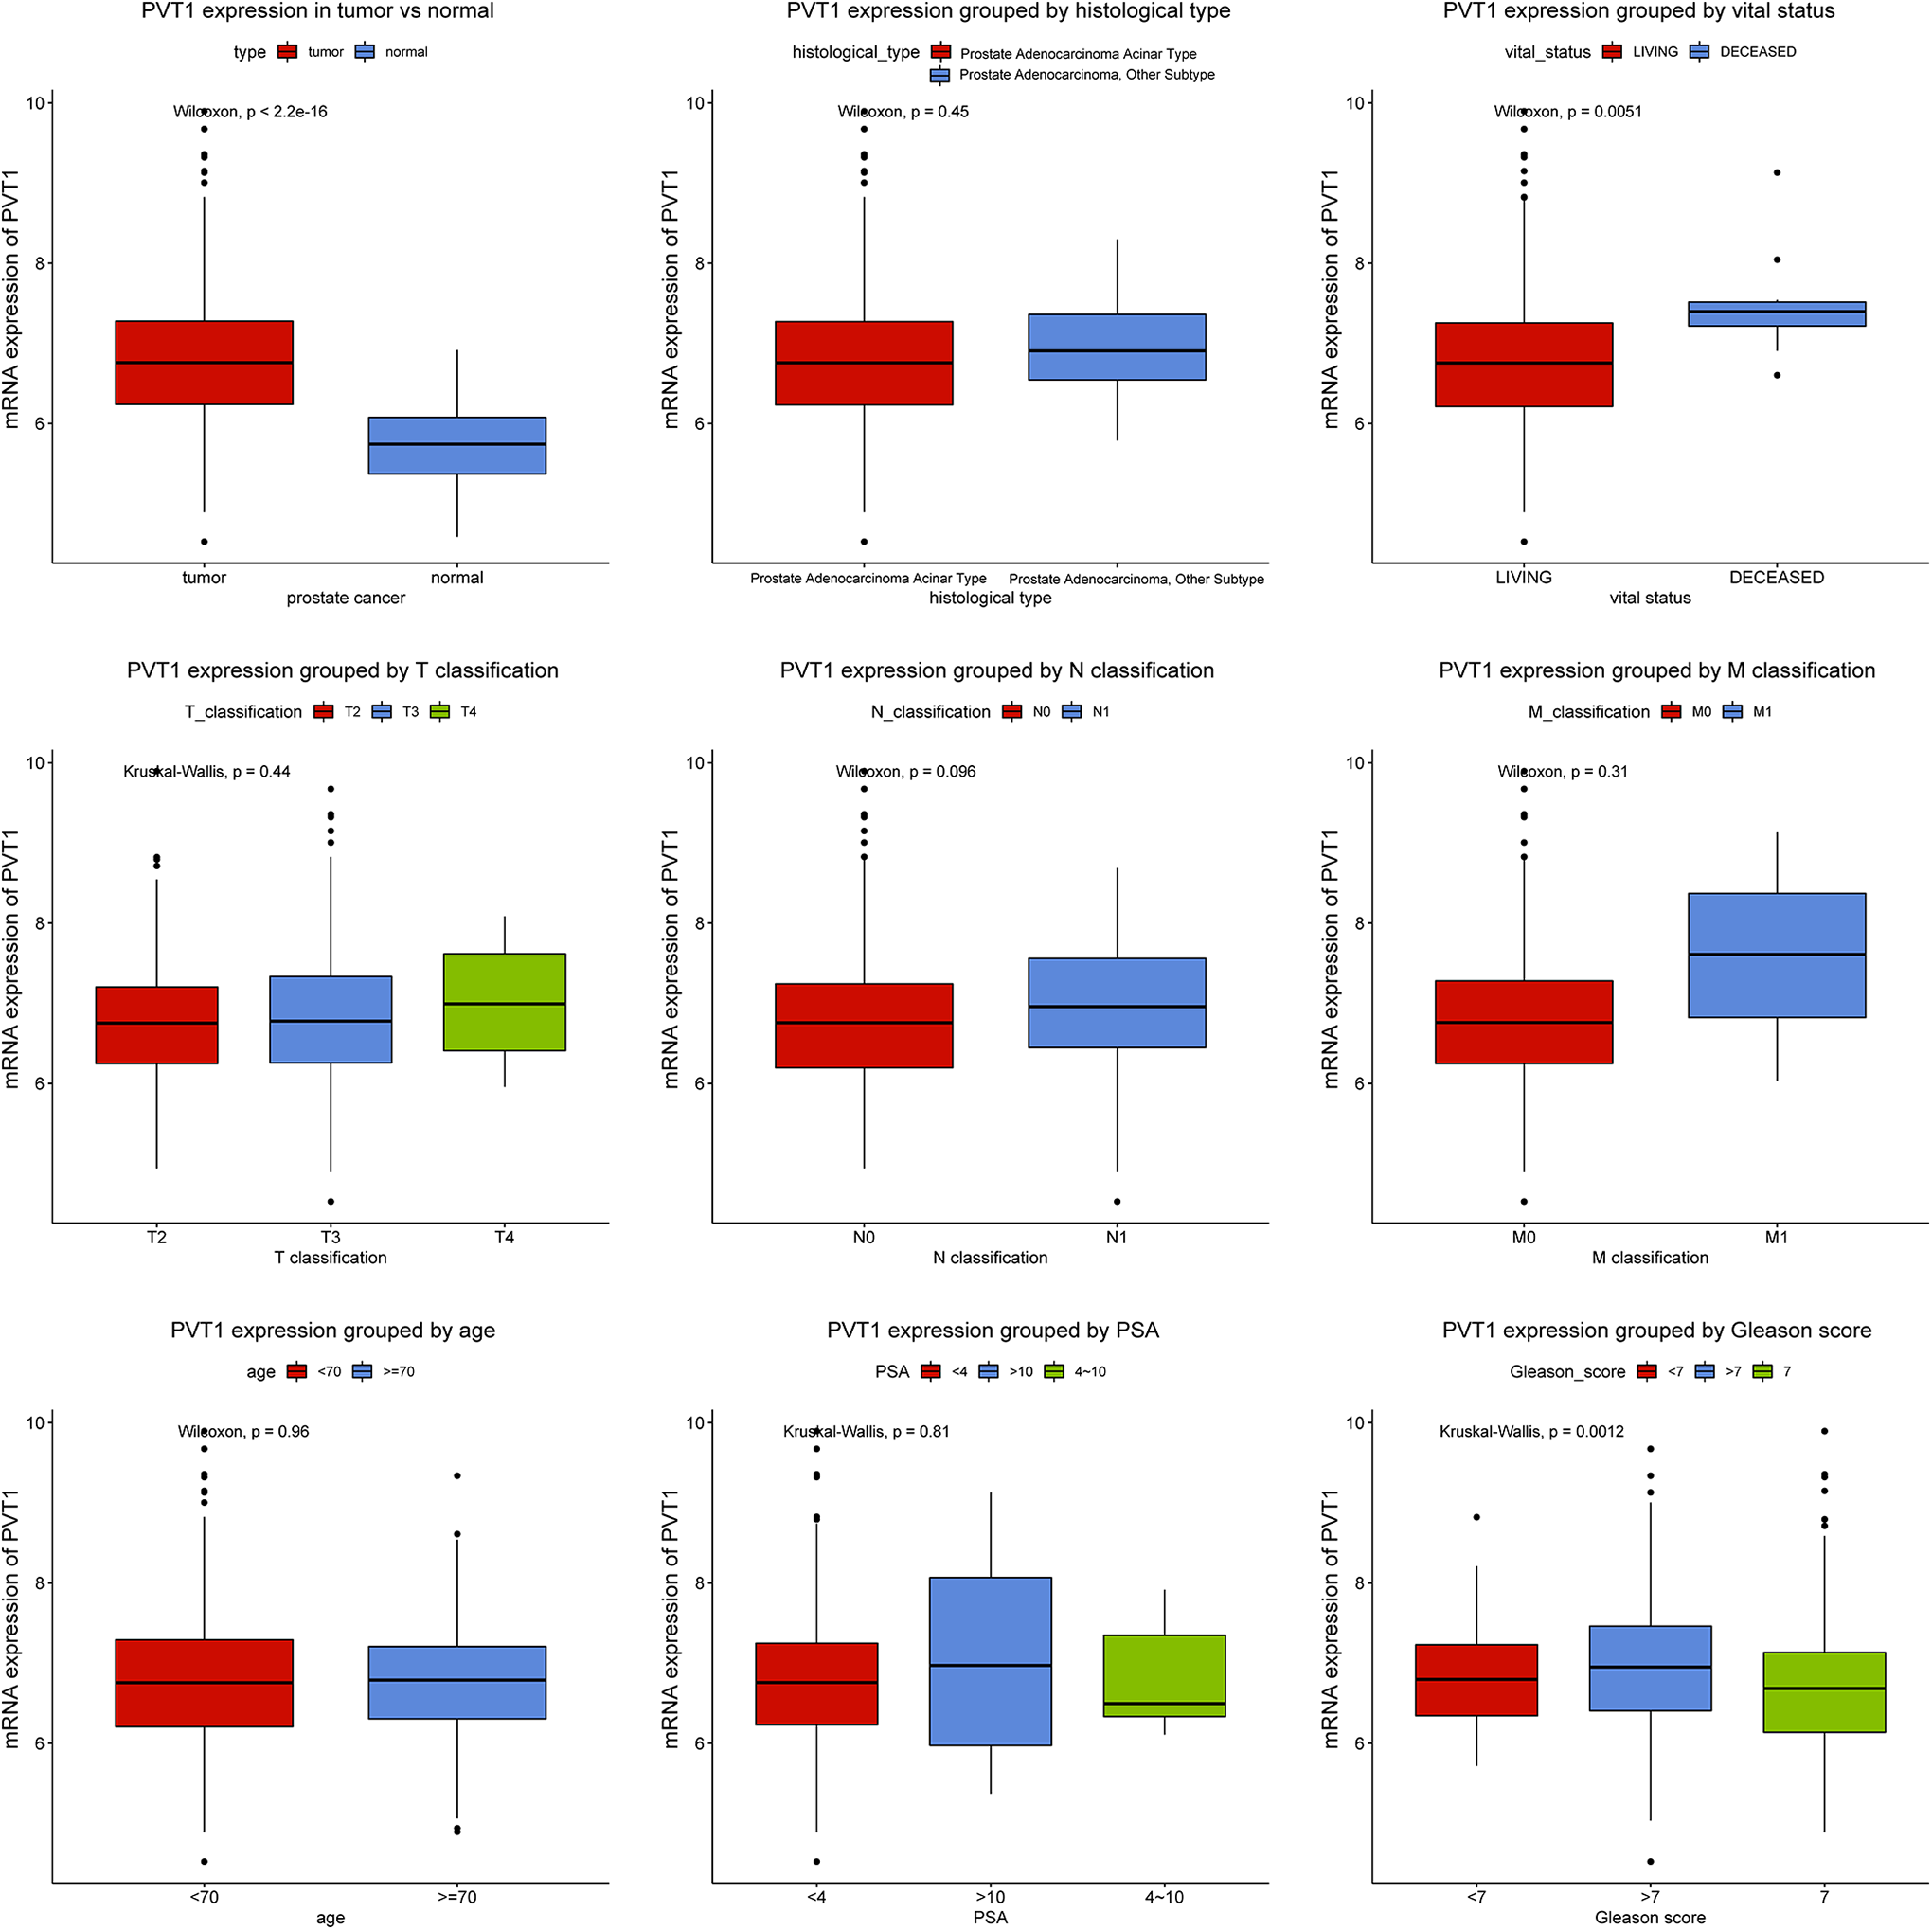
PVT1 expression pattern in prostate cancer. The difference in the expression of PVT1 between tumor tissue and normal tissue was compared, and the expression of PVT1 was compared according to different histological grade, stage, TNM classification, gender, age and vital status.
Associations Between the Clinicopathologic Variables and PVT1 Expression.

The Diagnostic Value of PVT1 Expression in Prostate Cancer
To assess the diagnostic value of PVT1 expression in prostate cancer, ROC curve analysis was performed for PVT1 expression in prostate cancer. The results showed that the area under the ROC curve (AUC) was 0.860, which revealed PVT1 expression has excellent diagnostic value in prostate cancer (Figure 2).

Diagnosis value of PVT1 expression in prostate cancer. The ROC curves of PVT1 expression in prostate cancer tissue and normal tissue of patients was generated.
High Expression of PVT1 Is an Independent Prognostic Factor for Poor Survival in Prostate Cancer
To assess the prognostic significance of PVT1 in prostate cancer, survival analysis of PVT1 expression was performed. Kaplan Meier survival curve analysis was used to evaluate the effect of PVT1 expression on survival. Prostate cancer patients were divided into 2 groups, high-expression, and low-expression of PVT1, according to the median expression of PVT1. Kaplan Meier survival curve showed that the patient with high PVT1 expression had poor overall survival (P = 0.0025). Furthermore, subgroup analysis showed high PVT1 expression is significantly associated with poor overall survival of patients in N1 stage (P = 0.015), M0 stage (P = 0.0066), T3 stage (P = 0.0023) and residual tumor R1/R2/Rx (P = 0.005) (Figure 3). Next, we evaluated the relationship between PVT1 expression and relapse-free survival in prostate cancer. As shown in Figure 4, we found that high expression of PVT1 reversely affected relapse-free survival of prostate cancer patients (P = 0.00032) and subgroup analysis showed that high PVT1 expression is significantly associated with relapse-free survival of patients in N0 stage (P = 0.0069), M0 stage (P = 5e-04), T3 stage (P = 0.00072) and residual tumor R1/R2/Rx (P = 0.0012). Univariate and multivariable cox regression analysis indicated that high PVT1 expression is an independent prognostic factor for poor overall survival (Hazard Ratio = 7.31, P = 0.016) and poor relapse-free survival (Hazard Ratio = 1.77, P = 0.043) in prostate cancer(Tables 3 and 4).
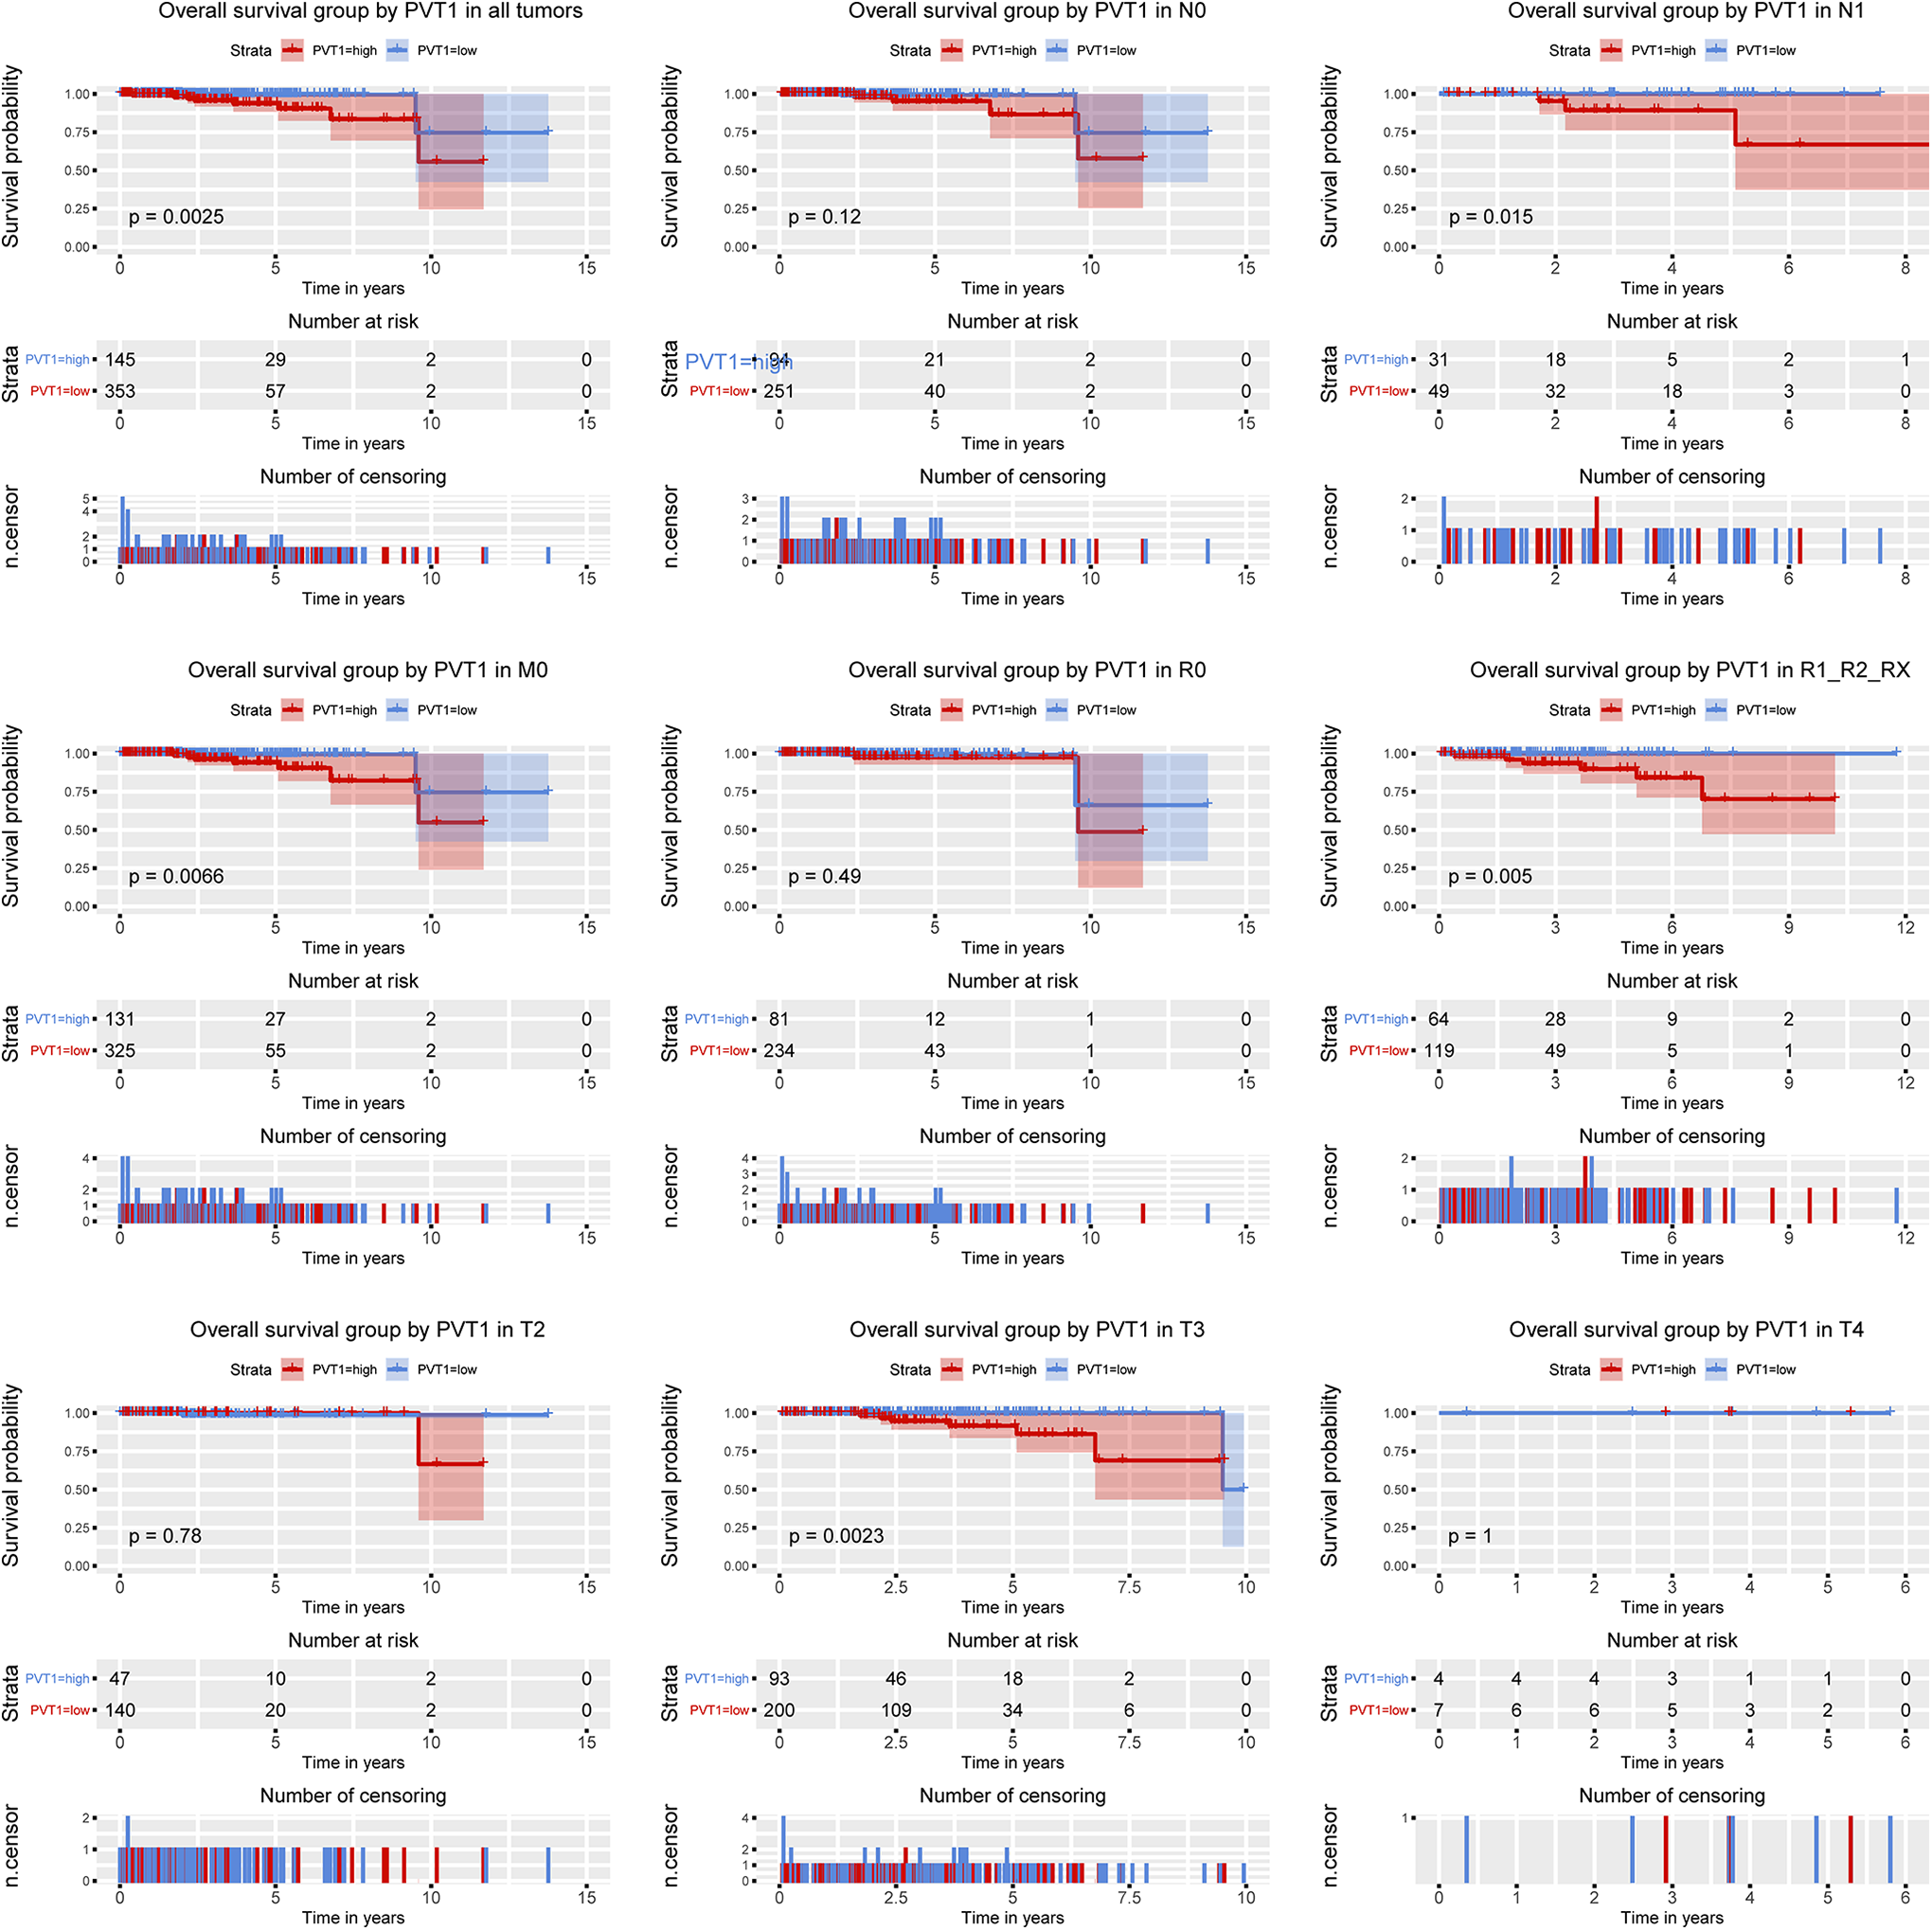
The effect of PVT1 expression on OS in prostate cancer. Kaplan-Meier curves of PVT1 expression in all patients as well as subgroup analysis (N0, N1, M0, R0, R1_R2_RX and T2-T4).
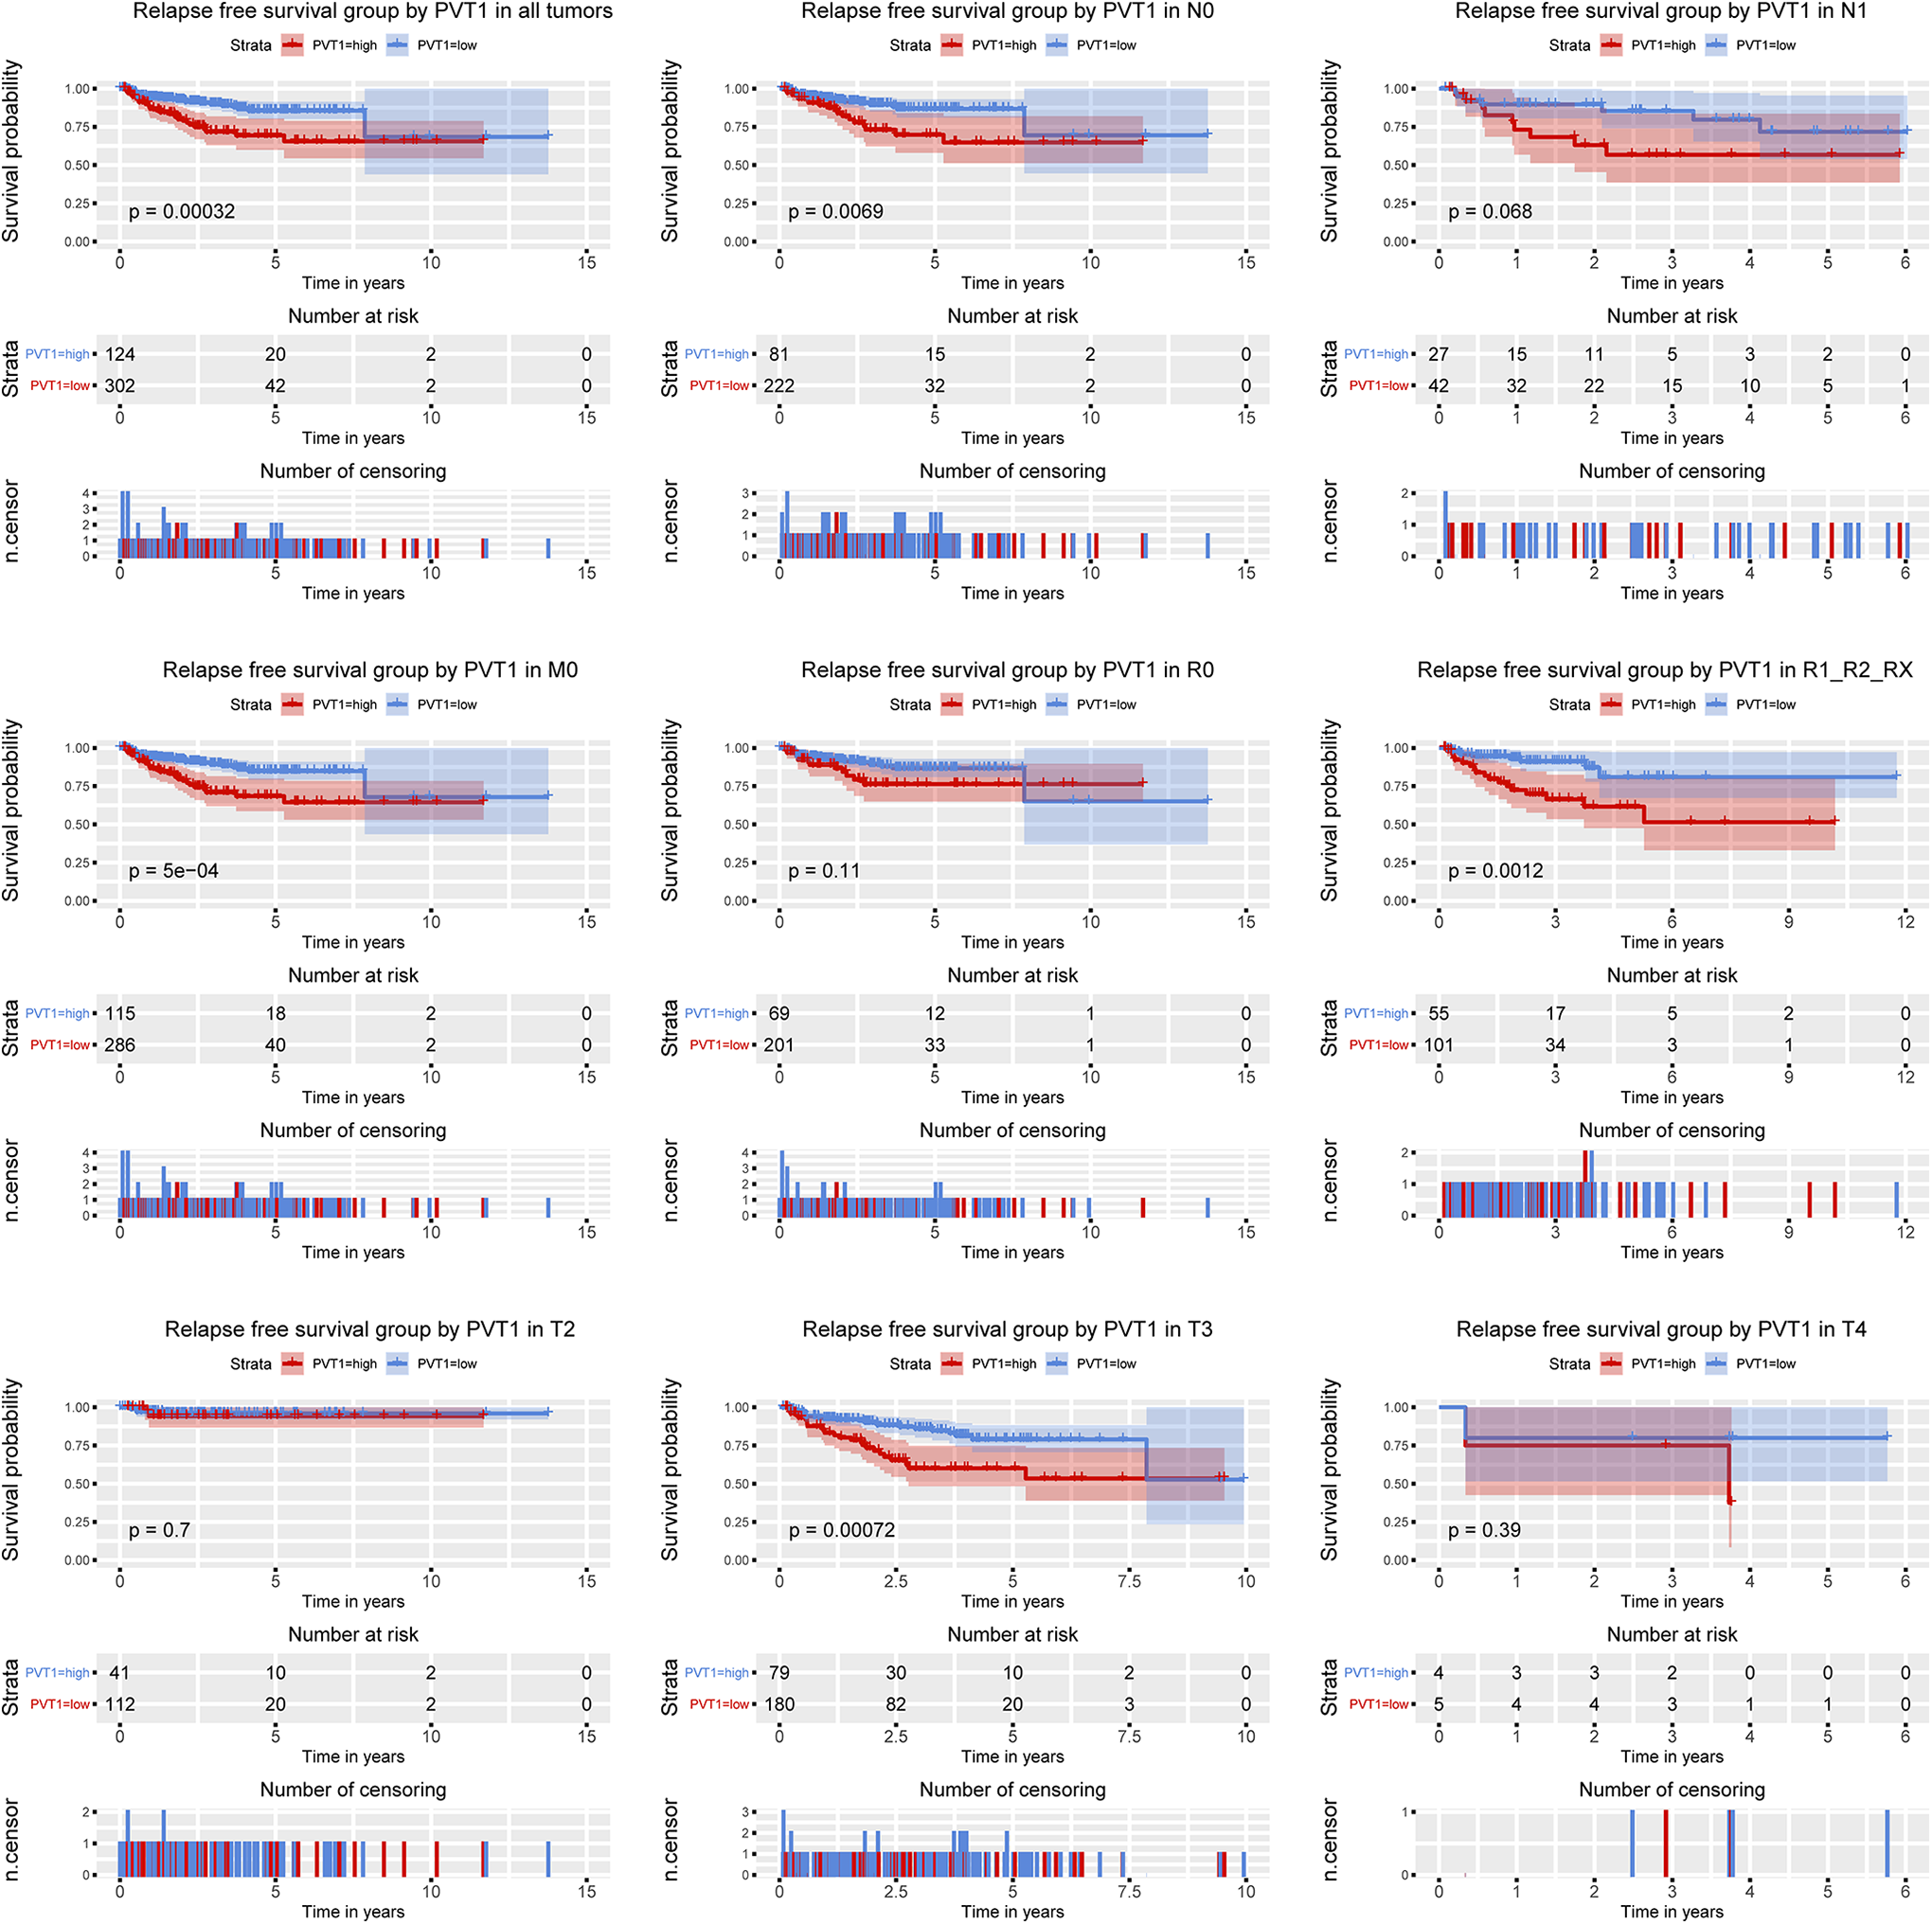
The effect of PVT1 expression on RFS in prostate cancer. Kaplan-Meier curves of PVT1 expression in all patients as well as subgroup analysis (N0, N1, M0, R0, R1_R2_RX and T2-T4).
Univariate and Multivariate Analysis of Overall Survival in Patients With Prostate Cancer.

Univariate and Multivariate Analysis of Relapse Free Survival in Patients With Prostate Cancer.

Discussion
In this study, we found that the expression level of PVT1 in prostate cancer patients was significantly higher than that in normal individuals, and the expression level of PVT1 was related to T stage, N stage, PSA, Gleason score, targeted molecular therapy, and vital status. PVT1 expression has an excellent diagnostic value for prostate cancer in clinic. In addition, patients with high expression of PVT1 had a poor survival, proving that PVT1 can be an independent predictor of the prognosis of prostate cancer.
PVT1 is highly expressed in a variety of tumors and participates in the regulation of malignant tumor cell proliferation and apoptosis through various pathways, including gastric cancer, 15 non-small cell lung cancer, 17,22 and colorectal cancer. 18 This is consistent with the high expression of PVT1 in prostate cancer. The expression of PVT1 varies according to survival status, suggesting that the expression of PVT1 can predict the survival of patients, and the specific mechanism needs to be further explored. With the advancement of T, N and M stages, the expression of PVT1 increased gradually, suggesting that PVT1 may be involved in the progression and growth of tumors. PVT1 can promote cyclin-dependent kinase (CDK) and cyclins expression to participate in tumor progression. The pro-tumor activity of PVT1 in breast cancer has been confirmed to be partly dependent on the negative regulation of P21. 23 The main pathway associated with PVT1 overexpression is the cell cycle pathway in liver cancer cells. 24 Therefore, PVT1 may be involved in the development of prostate cancer through cell cycle regulation .The expression of PVT1 was significantly correlated with Gleason score, and Gleason score was highly correlated with prognosis, which was an important reference index for the formulation of treatment methods, suggesting that the expression level of PVT1 could guide the formulation of treatment plans to some extent.
High expression of PVT1 is a powerful predictor of cancer progression and patient prognosis in many cancers. The high expression of PVT1 may serve as a new biomarker for predicting tumor recurrence in HCC patients and as a potential therapeutic target. 25 Consistently, our findings suggested that PVT1 expression was correlated with prognosis of patients with prostate cancer. Next, we conducted a subgroup analysis of the overall survival rate and relapse-free survival rate, and found that PVT1 expression at stage N1/M0/T3 had an impact on the overall survival rate, while PVT1 expression at stage N0/M0/T3 had an impact on the relapse-free survival rate. This indicates that PVT1 expression is specific in predicting the prognosis of patients, which is conducive to clinical accurate treatment of patients. Many studies have shown that expression of PVT1 is associated with the invasion of malignant tumors and regional lymph node metastasis. 16,26 And studies have shown that PVT1 down-regulation can inhibit the proliferation of prostate cancer DU145 and PC3 cell. 27 This suggests that the poor prognosis of patients with high PVT1 expression may be caused by pro-metastasis effect of PVT1 on the tumor.
In conclusion, our study provides evidence of the diagnostic and prognostic value of PVT1 expression in prostate cancer patients. It may be a new potential target for cancer treatment. However, the molecular mechanism by which high PVT1 expression adversely affects survival of prostate cancer patients is not well understood and this is also the main point of our work next. Indeed, it will help us understand the biological function of PVT1 through its upstream and downstream signaling pathway network. Our study contributes to formulate a more accurate diagnosis and treatment plan for malignant tumors based on PVT1, to promote its clinical application.
Footnotes
Abbreviations
Authors’ Note
Yan Jiao and Chunxi Wang are co-corresponding author. Our study did not require an ethical board approval because it did not contain human or animal trials.
Declaration of Conflicting Interests
The author(s) declared no potential conflicts of interest with respect to the research, authorship, and/or publication of this article.
Funding
The author(s) received no financial support for the research, authorship, and/or publication of this article.