
Abstract
Worldwide breast cancer ranks first in mortality and incidence rates in women over 20 years old. Rather than one disease, breast cancer is a heterogeneous group of diseases that express distinct molecular profiles. Neoadjuvant chemotherapy is an important therapeutic strategy for breast cancer patients independently of their molecular subtype, with the drawback of resistance development. In addition, chemotherapy has adverse effects that combined with resistance could contribute to lower overall survival. Although great efforts have been made to find diagnostic and prognostic biomarkers for breast cancer and for response to targeted and immune therapy for this pathology, little has been explored regarding biomarkers of response to anthracyclines and taxanes based neoadjuvant chemotherapy. This work aimed to evaluate the molecular profile of patients who received neoadjuvant chemotherapy to identify differentially expressed genes (DEGs) that could be used as biomarkers of chemotherapy response and overall survival. Breast cancer patients who were candidates for neoadjuvant chemotherapy were enrolled in this study. After treatment and according to their pathological response, they were assigned as sensitive or resistant. To evaluate DEGs, Gene Ontology, Kyoto Encyclopedia Gene and Genome (KEGG), and protein–protein interactions, RNA-seq information from all patients was obtained by next-generation sequencing. A total of 1985 DEGs were found, and KEGG analysis indicated a great number of DEGs in metabolic pathways, pathways in cancer, cytokine–cytokine receptor interactions, and neuroactive ligand-receptor interactions. A selection of 73 DEGs was used further for an analysis of overall survival using the METABRIC study and the ductal carcinoma dataset of The Cancer Genome Atlas (TCGA) database. Nine DEGs correlated with overall survival, of which the subexpression of C1QTNF3, CTF1, OLFML3, PLA2R1, PODN, KRT15, HLA-A, and the overexpression of TUBB and TCP1 were found in resistant patients and related to patients with lower overall survival.
Introduction
Breast cancer ranks first in mortality and incidence of neoplasia in women over 20 years old worldwide. 1 One of the first therapeutic approaches to treat this disease is the use of neoadjuvant chemotherapy, which has the objective of decreasing tumoral size, increasing the possibilities of conservative surgery, removing micrometastases, and improving overall survival (OS). However, despite the benefits of this treatment in breast cancer, some patients develop resistance to it, making their future therapeutic approach more difficult. The molecular factors involved in chemoresistance have not been totally elucidated thus far. Nevertheless, there is a relationship between chemoresistance and lower OS and disease-free survival.2,3 In this sense, there is a growing interest and urgency in finding molecular biomarkers useful for the prognosis of neoadjuvant chemotherapy response.
The use of predictive biomarkers, molecules that can be easily measured and provide clues regarding the behavior of the disease, is gaining importance in the clinic. Biomarkers have been used primarily for targeted therapy, classifying subjects, and ultimately predicting chemotherapy response and OS. The study of biomarkers in breast cancer has allowed the development of panels such as Mammaprint, Rotterdam, and OncotypeDx, which can predict the risk of metastasis, disease recurrence, and response to tamoxifen, respectively, for hormone receptor-positive patients. 4 Most of the biomarker panels developed to date for breast cancer have focused primarily on specific molecular subtypes, and there is currently no panel able to predict the response to neoadjuvant chemotherapy.
A methodology that has evolved rapidly and that is currently causing a great impact in various areas of human health is RNA sequencing or RNAseq. The current clinical applications of RNAseq are diverse and include metagenomic studies, transcriptomic analysis, detection of genetic alterations, and the discovery of new biomarkers for the diagnosis, prognosis, and therapeutic response in different pathologies.5,6
In this work, our main goal was to evaluate by using RNAseq the transcriptome of breast cancer patients who were resistant or sensitive to anthracycline and taxanes-based neoadjuvant chemotherapy, and to identify differentially expressed genes (DEGs) for their potential use as chemotherapy response and OS biomarkers.
Materials and Methods
Patient Eligibility and Selection
Patients aged 18 years and older with a diagnosis of breast cancer, with tumor size >2 cm and/or positive nodes, candidates to receive neoadjuvant chemotherapy and without previous therapy against cancer were recruited for this study. Patients with metastatic cancer, insufficient breast cancer biopsy tissue for pathological analysis, or RNA extraction were excluded. All molecular subtypes were included in the analysis. All participants provided written informed consent before enrollment.
Ethics Statement
The study was approved by the Ethical and Research Committee of the Instituto Mexicano del Seguro Social (IMSS) (number R-2013-785-061). All procedures performed in this study were in accordance with the ethical standards of the institutional and/or national research committee and with the 1964 Helsinki declaration and its later amendments or comparable ethical standards.
Treatment Plan and Study Design
Patients with breast cancer candidates to receive neoadjuvant chemotherapy were recruited at the Servicio de Oncología of Centro Médico Nacional de Occidente of IMSS. Patients were asked to participate and signed informed consent; thereafter, a breast biopsy was taken for RNA extraction and sequencing. The biopsies for this study were taken before the patients received their neoadjuvant chemotherapy schema. Neoadjuvant chemotherapy treatment started with 4 cycles of doxorubicin (60 mg/m2) or epirubicin plus cyclophosphamide (600 mg/m2) every 3 weeks, followed by either 12 cycles paclitaxel (90 mg/m2) or docetaxel (100 mg/m2) every week. After chemotherapy conclusion, another breast biopsy was taken only when was needed as part of their treatment, and this last biopsy was used by the pathology department to evaluate the response to treatment. Patients with residual tumors were assigned to the resistant group, while patients with pathologic complete response (pCR) were assigned to the sensitive group. The pCR was set as the absence of residual invasive and in situ cancer of the complete resected breast specimen and all sampled regional lymph nodes following completion of neoadjuvant systemic therapy.
RNA Extraction, QC, Library Preparation, and Sequencing
Once the biopsy was taken, it was immediately submerged in 1 mL of RNAlater RNA Stabilization Reagent (Qiagen, Cat No. 76104), incubated overnight in the reagent at 2 °C to 8 °C, and then transferred to −80 °C for storage until processing. For RNA extraction, the RNeasy Plus Mini Kit (Qiagen, Cat No. 74136) was used according to the manufacturer's instructions. Total RNA integrity was determined by using the Agilent 2100 Bioanalyzer Instrument and the Agilent RNA 6000 Nano Kit (Agilent, Cat No. 5067-1511).
Extracted RNAs were sequenced by the Beijing Genomics Institute (BGI Genomics). Briefly, total RNA (200 ng) was purified with oligo-dT beads to obtain messenger RNA (mRNA), and then it was fragmented into small pieces with fragment buffer. mRNA was converted into complementary DNA (cDNA) using SuperScript III First-Strand Synthesis SuperMix (No. Cat, 18080400) (reaction conditions: 25 °C for 10 min; 42 °C for 50 min; and 70 °C for 15 min) and Second Strand Master Mix. End Repair Mix was added (30 °C for 30 min), and cDNA was purified with Ampure XP Beads (AGENCOURT). Poly-A tail addition was performed by adding an A-Tailing Mix (37 °C for 30 min). Adapters were added to cDNA by combining Adenylate 3'Ends DNA with RNA Index Adapter and Ligation Mix (30 °C for 10 min). PCR amplification was performed with PCR Primer Cocktail and PCR Master Mix to enrich the cDNA fragments. Then, the PCR products were purified with Ampure XP Beads (AGENCOURT). Validation of the library was performed in 2 steps: first, the average molecule length was determined using the Agilent 2100 Bioanalyzer Instrument and the Agilent DNA 1000 Reagents (Agilent, Cat No. 5067-1504), and second, quantification of the library using TaqMan Probes (Applied Bioscience) and real-time quantitative PCR was performed. For sequencing, qualified and quantified libraries were used. First, amplification was performed within the flow cell on the cBot instrument for cluster generation (HiSeq 4000 PE Cluster Ki, Illumina). Then, the clustered flow cell was loaded onto the HiSeq4000-Sequencer for paired-end sequencing (HiSeq 4000 SBS Kit, Illumina) with recommended read lengths of 150 bp.
Analysis of DEGs
For filtration and remotion of Illumina adapters from the reads, we used Flexbar. The alignment of the clean short reads was mapped using Kallisto and the GRCh38 version of the human genome as a reference index for the generation of abundance tables. The DEGs were identified using the software package DESeq2 in R 3.5.1 “Feather Spray” (R Core Team, URL https://www.R-project.org/). A false discovery rate (FDR) or p-adjusted <.05 with the Benjamini-Hochberg method was used for further analysis. The DEG analysis was performed based on the chemotherapy response setting up the sensitive group as a reference. The raw and processed data were submitted to the Gene Expression Omnibus (GEO) repository with the number GSE162187.
In addition, the GSE163882 database was used to validate our results, this database has information on the response to neoadjuvant chemotherapy of 222 breast cancer samples.
Functional Gene Analysis
Gene Ontology (GO) analysis of DEGs was performed to identify characteristic biological attributes stratified into categories. Kyoto Encyclopedia Gene and Genome (KEGG) analysis of the DEGs was carried out online with the bioinformatic tool KEGG Mapper. A cutoff P < .05 was set up as a criterion for enrichment analysis.
Gene Set Enrichment Analysis
Gene Set Enrichment Analysis (GSEA) preranked was performed with GSEA software v4.1.0 to identify the molecular signatures modulated by DEGs.7,8 A rnk file was built using the ranked list of DEGs obtained with DESeq2 analysis as input data. For the enrichment analysis, the 9 major collections (C1, C2, C3, C4, C5, C6, C7, C8, and H) of the molecular signature database (MSigDB v7.4) were used.8–10
Functional Protein Association Analysis
Interactome analysis of p-adj < .5 DEGs was performed by using String version 11.0. A high confidence score (the approximate probability that a predicted link exists between 2 enzymes in the same metabolic map in the KEGG database) >0.7 was set up. The clusters were identified by interconnected nodes. Finally, we selected the pathways among GO, KEGG, and Reactome pathways as well as UniProt keywords in which the evaluated proteins participate.
Overall Survival Analysis
We performed a search in online databases to validate our findings with other studies. CBioPortal database was used (https://www.cbioportal.org/), which provides visualization, analysis, and download of large-scale cancer genomics data sets. We selected the dataset composed with the information of the METABRIC, Nature 2012 & Nat Commun 2016 studies. 11 A total of 1904 samples with RNAseq data were taken for performing OS analysis. Samples with an mRNA expression z-score threshold of >|1| were selected for analysis. A cutoff of 60 months was set up for the OS analysis. Additionally, a database of 785 patients obtained from the TCGA breast ductal carcinoma study was analyzed (TCGA Research Network: https://www.cancer.gov/tcga), 12 for this dataset, the analysis was performed to 60 and 120 months. DEGs with an adjusted P-value <.05 were analyzed. A LogRank <0.05 was taken as significant.
Results
A total of 41 patients were recruited for this study; nevertheless, 18 samples had poor quality or insufficient quantity of RNA for the analysis, and 1 patient died during treatment. Therefore, only 22 samples covered the criteria for RNAseq. All clinical characteristics are summarized in Supplementary Table 1; briefly, the age mean was 51.2 ± 10.18 years old. All patients were diagnosed with invasive ductal carcinoma of the breast. The molecular subtype distribution among the patients was 3 luminal A, 6 luminal B, 8 Her2, 4 triple negative, and 1 patient with unavailable information. The histological grade was 1 SBRI, 10 SBRII, 9 SBRIII, and 2 patients with nonavailable information. After patients completed 6 months of neoadjuvant chemotherapy, 9 were sensitive, that is, they had a pCR, and 13 of them were resistant (non-pCR) (Supplementary Table 1).
Differentially Expressed Genes in Patients Resistant to Neoadjuvant Chemotherapy
Analysis of DEGs was performed between resistant and sensitive patients. To accomplish the comparisons, the sensitive group was set as the reference, so the results indicate DEGs in the resistant group. The data for performing the analysis were taken from the ENSEMBL project. From the 39 723 genes reported in the ENSEMBL database, a total of 29 739 genes had reads that aligned with its sequence, and there were 1985 DEGs with a P-value <.05 (1005 DEGs overexpressed and 980 subexpressed) (Figure 1A). When filtering the data by log2FoldChange > |1|, the number of DEGs diminished to 1178 (556 overexpressed and 662 subexpressed). The most downregulated genes with a P-value <.05 and a log2FoldChange lower than −5 were FLG2, LCE2B, UGT1A6, KRT1, UGT2B7, PSAPL1, KRTDAP, C1orf68, LOR, SPRR2E, KPRP, LST1, AC116533.1, and AC244489.2. Meanwhile, highly expressed genes with a log2FoldChange >5 and a P-value <.05 were PVALB, CRIM1, IGHV3 to 43, CHRNA4, HLA-DQA2, ARHGAP11A, and MUC2 (Figure 1A). In addition, 73 genes (53 with subexpression and 20 with overexpression) showed a padj value <.05 (Figure 1B).

Distribution of differentially expressed genes (DEGs) by P value and Log2-FoldChange. The DEGs were plotted in the graph in which the x-axis represents the log2 fold change and the y-axis represents the log10 of the P value. The sensitive group was set up as a reference for comparison. A, DEGs with a P < .5. B, DEGs filtered by a p-adj < .05. Red indicates overexpressed genes, and blue indicates subexpressed genes. C1orf68 and LCE2B genes are not shown in the plot since their Log2FoldChange is lower than the limit of the x-axis.
Pathways Differentially Modulated in Resistance to Neoadjuvant Chemotherapy
To highlight the physiological processes that could be related to neoadjuvant chemotherapy resistance, we performed a KEGG pathway and GO enrichment analysis of DEGs with a P-value <.05. The GO analysis results showed that cellular components modulated in resistant patients belong to the extracellular region, including extracellular matrix, cell periphery, and intrinsic/extrinsic components of the plasma membrane (Figure 2). The molecular functions of those DEGs were related to extracellular matrix structural constituent, binding function, receptor activity, protein binding (collagen, integrin, growth factor, calcium ion, and signal receptor binding), transmembrane receptor protein kinase activity, and metallopeptidase activity (Figure 2).

Gene Ontology (GO) analysis of differentially expressed genes (DEGs). A total of 1985 DEGs with P < .05 were analyzed with the Pantherdb tool. The light-gray bars show the total genes reported for each of the GO terms, dark-gray bars are the number of DEGs, and the colored bars indicate the expected number of genes for each GO term in normal conditions. The GO categories of biological process, cellular component, and molecular functions are colored green, blue, and red, respectively. The y-left axis lists the enrichment terms (false discovery rate [FDR] < 0.05) for the 3 GO categories, and the x-axis represents the log2 of the DEG numbers.
In addition, the biological processes with more DEGs were cell and tissue development, extracellular matrix assembly, positive regulation of epithelial-to-mesenchymal transition (EMT), regulation of cellular response to transforming growth factor-beta receptor signaling pathway, homophilic cell adhesion via plasma membrane adhesion molecules, epithelium development, regulation of angiogenesis, and cell migration (Figure 2).
The KEGG pathway analysis revealed that pathways with more DEGs were related to the regulation of transcription, cell proliferation, and signal transduction; furthermore, there were signaling pathways differentially modulated among the first 15 KEGG pathways, including the PI3K-Akt, MAPK, Calcium, TGF-beta, Ras, cAMP, and JAK-STAT signaling pathways (Figure 3) (Supplementary Table 2).
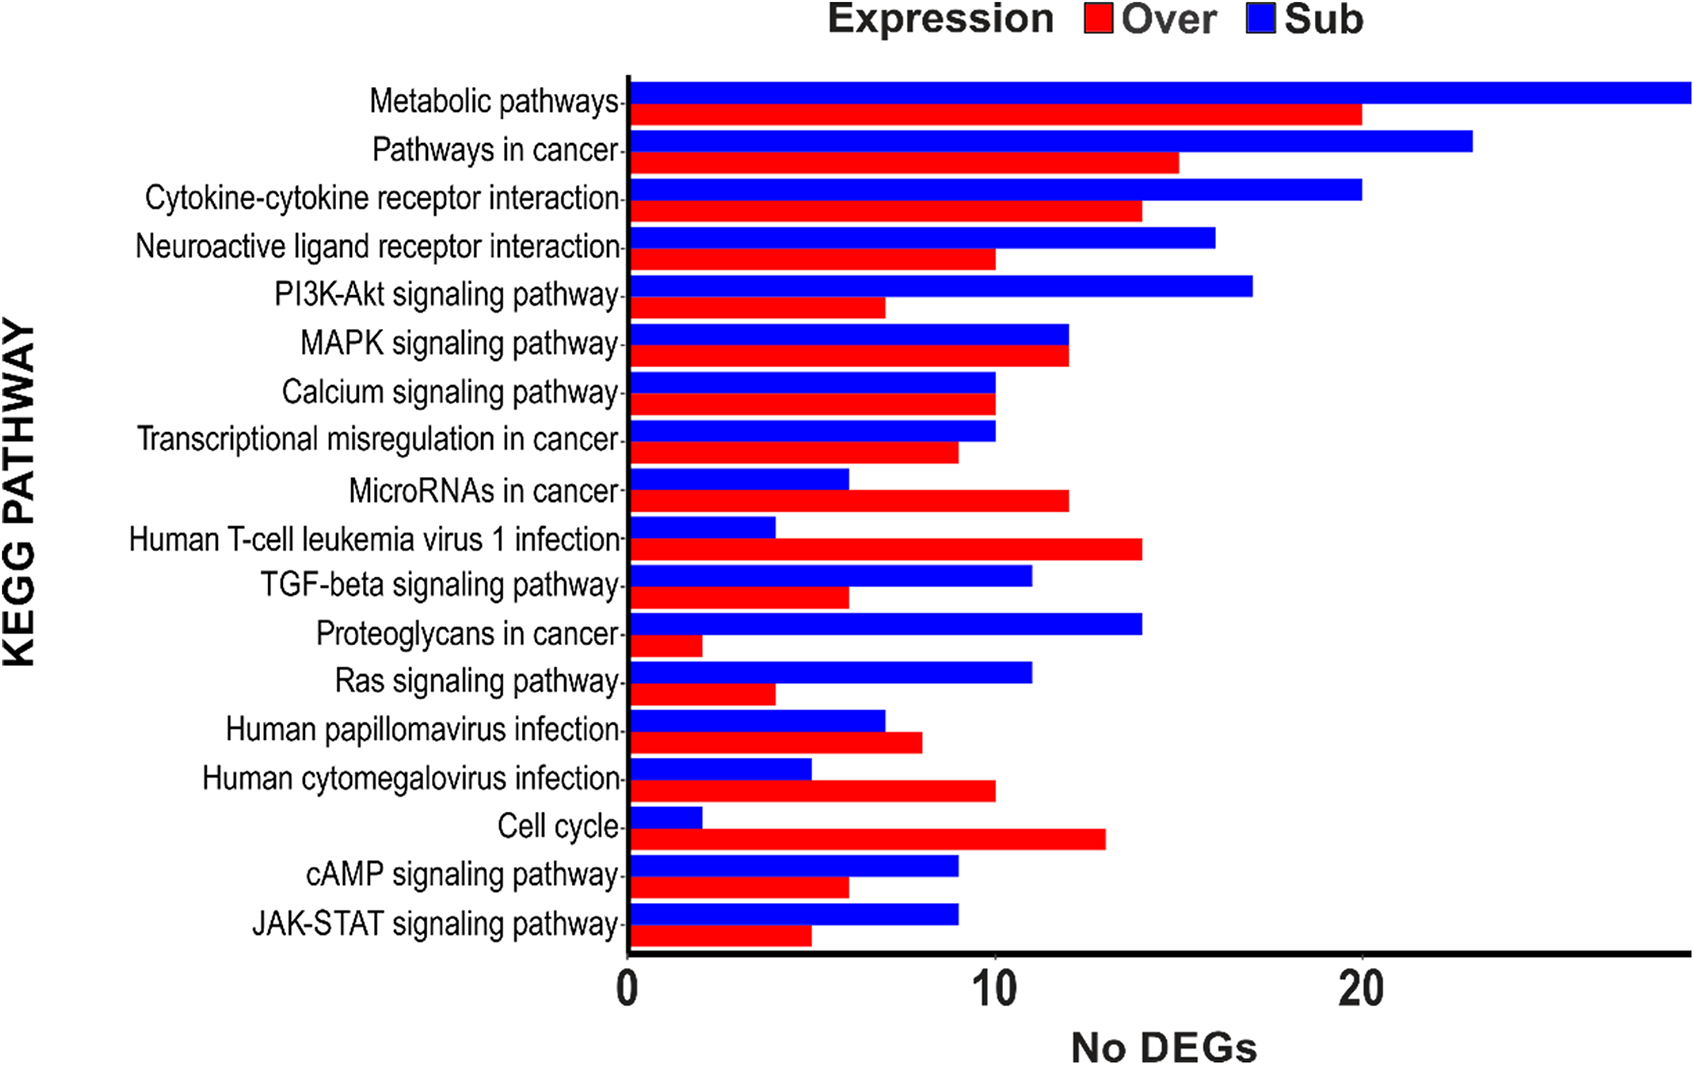
Kyoto Encyclopedia Gene and Genome (KEGG) analysis of differentially expressed genes (DEGs). A total of 1985 DEGs with P < .05 were analyzed in the KEGG mapper tool. The x-axis represents the number of DEGs, and the y-axis represents the name of the pathways. Red indicates overexpressed genes, and blue indicates subexpressed genes in the chemotherapy resistance group.
Enriched Gene Sets in Chemoresistance
The GSEA results show enriched gene sets with a P-value <.05 and FDR q-value <.25. The more positively enriched score value, the more overexpressed genes in the set: negative enriched values mean the content of more subexpressed genes in the gene set. The total enriched gene set for each collection is: 18 hallmarks gene sets (8 positively enriched and 10 negatively enriched), 31 positional gene sets (16 positive and 15 negative), 202 curated gene sets (55 positive and 147 negative), 1 motif gene set positively correlated, 67 computational gene sets (22 positive and 45 negative), 57 ontology gene sets (38 positive and 19 negative), 4 oncogenic signature gene sets negatively correlated, 10 immunologic signature gene sets positively correlated, and 93 cell type signature gene sets (19 positive and 74 negative). In Supplementary Table 3 are listed the 20 first positive and negative correlated gene sets for each collection.
Protein–Protein Interaction Network Functional Enrichment Analysis of DEGs
DEGs with a p-adj value lower than .05 were further analyzed by STRING to determine the possible interactions among their protein products. A total of 73 genes were included in this last analysis, of which only 68 proteins were incorporated and used to build the interaction matrix. We focused our analysis on those protein interactions with a minimum confidence score of 0.7. The confidence score is defined as the approximate probability that a predicted link exists between 2 proteins in the same metabolic map of the KEGG database (its range is from 0 to 1), with a higher score indicating that the number of interactions diminishes among the query proteins, but those interactions are more likely to be real. A lower score results in a great number of interactions but also more false positives. After this analysis, 18 edges (protein–protein interaction) were reported to have a high confidence score (0.7), with 5 clusters identified. The proteins of the largest cluster included COL21A1, COL3A1, MMP2, DCN, VCAN, and FBLN2, and all belong to the category of extracellular matrix organization of the Reactome pathways. The next cluster grouped the proteins LCE2B, LOR, FLG, KRT1, KRT15, and KRT2, all of which were related to keratinocyte differentiation, epithelial cell differentiation, the formation of the cornified envelope, and anatomical structure development. The third cluster was made up of CLDN1 and CLDN8, which are part of the plasma membrane. HLA-A and HLA-B form a cluster that contributes to the cellular response to chemical stimuli. Finally, the last cluster was composed of UGT1A7 and UGT1A6, which are part of drug metabolism (cytochrome P450). Furthermore, there are proteins that, although they do not interact with each other, belong to the plasmatic membrane and anatomical structure development (Figure 4).
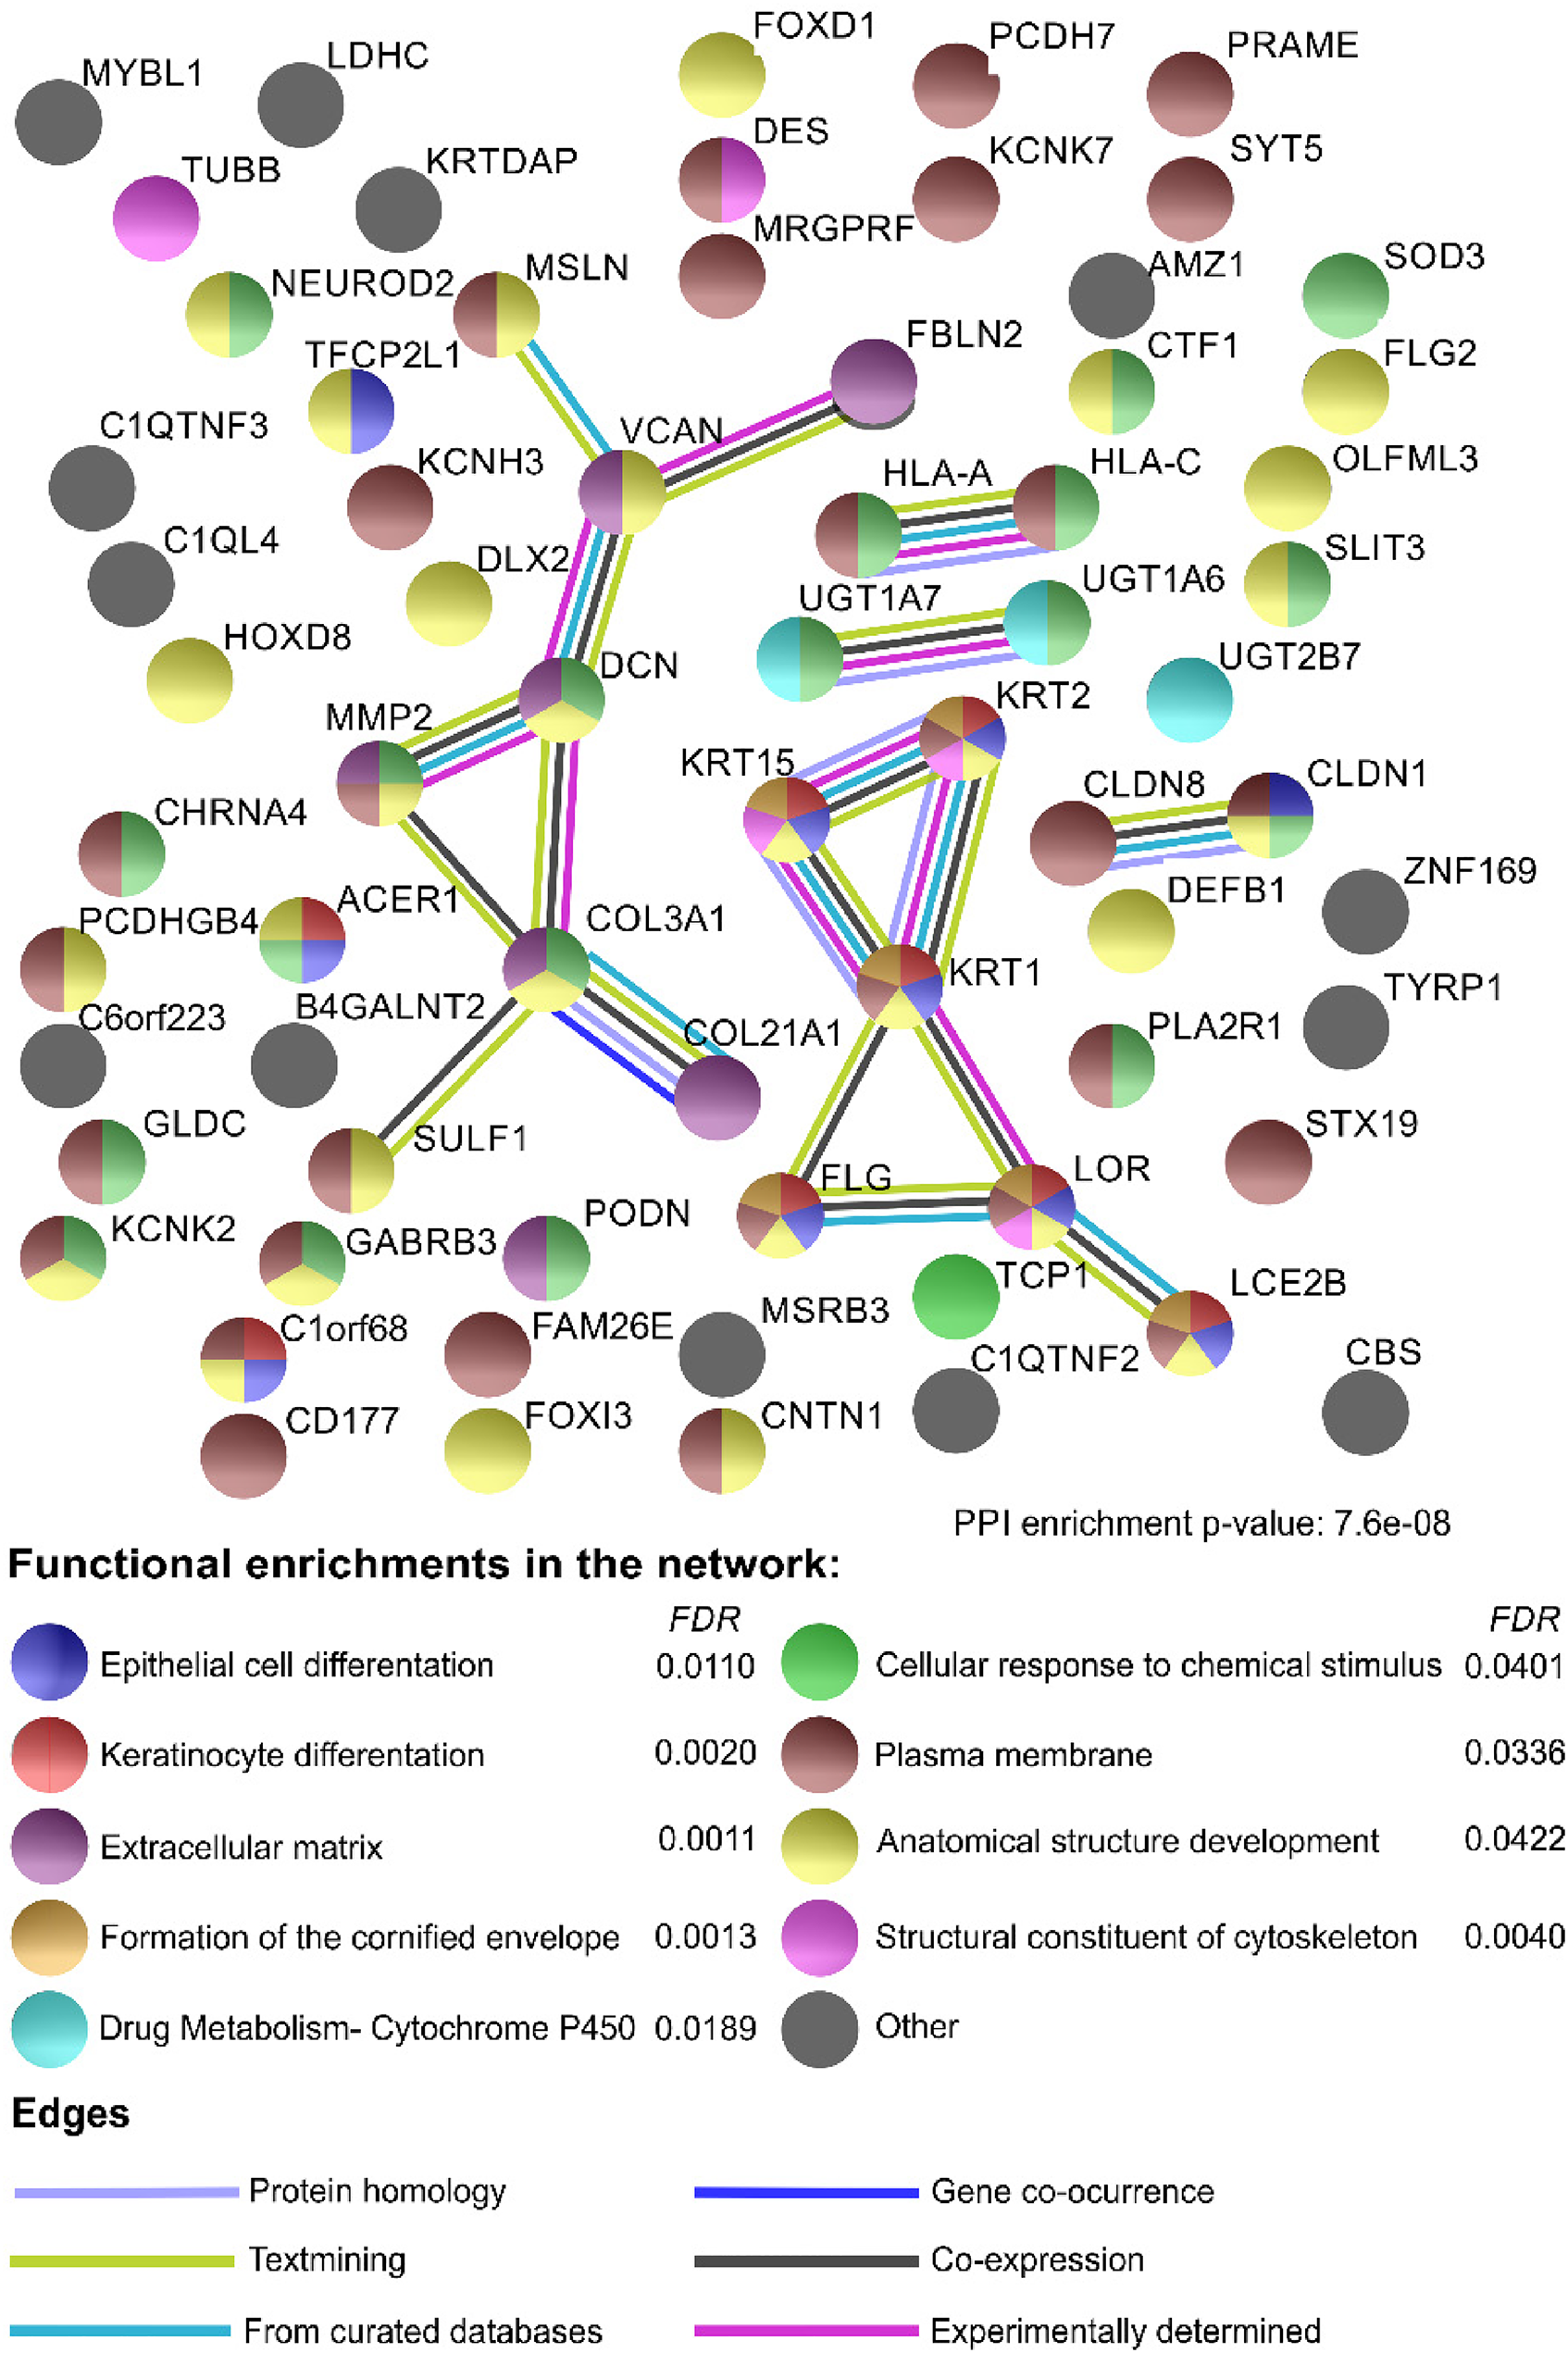
Interactome analysis. A total of 73 differentially expressed genes (DEGs) with a p-adj < .05 were analyzed in the STRING tool. Every node (circle) represents the protein encoded by every gene. The colors indicate the functional enrichments of the node in Gene Ontology (GO), Kyoto Encyclopedia Gene and Genome (KEGG), or Reactome pathways. The edges (lines) represent the type of evidence reported in the literature for the interaction of proteins. A confidence value of 0.7 was used to establish the interactions.
Evaluation of DEGs in a Study With a Large Number of Patients Showed an Association With OS
Validation of DEGs in other studies showed putative biomarkers associated with OS
To determine whether there was a relationship between the DEGs observed in resistant and sensitive patients and the OS of patients with breast cancer, the previously selected DEGs were used to perform a comparative analysis against data stored in the cBioPortal database. We selected the METABRIC (Nature 2012 & Nat Commun 2016) database, which has information about gene expression and OS data from 2509 invasive breast carcinoma patients. Nevertheless, we selected 1904 patients for the analysis that also had Illumina sequencing data. The data about patient status (alive or dead) were taken with a cutoff of 60 months, and over- or subexpression for each analyzed gene was set up at a z-score threshold >|1|. The results showed that the group of patients with overexpression (z-score >1 and LogRank <0.05) of TCP1 and TUBB had lower OS (Figure 5A). Additionally, subexpression (z-score < −1 and LogRank <0.05) of C1QTNF3, CTF1, OLFML3, PLA2R1, and PODN was also related to lower OS (Figure 5B). The percentage at risk was in none of the analyzed genes lower than 50%.
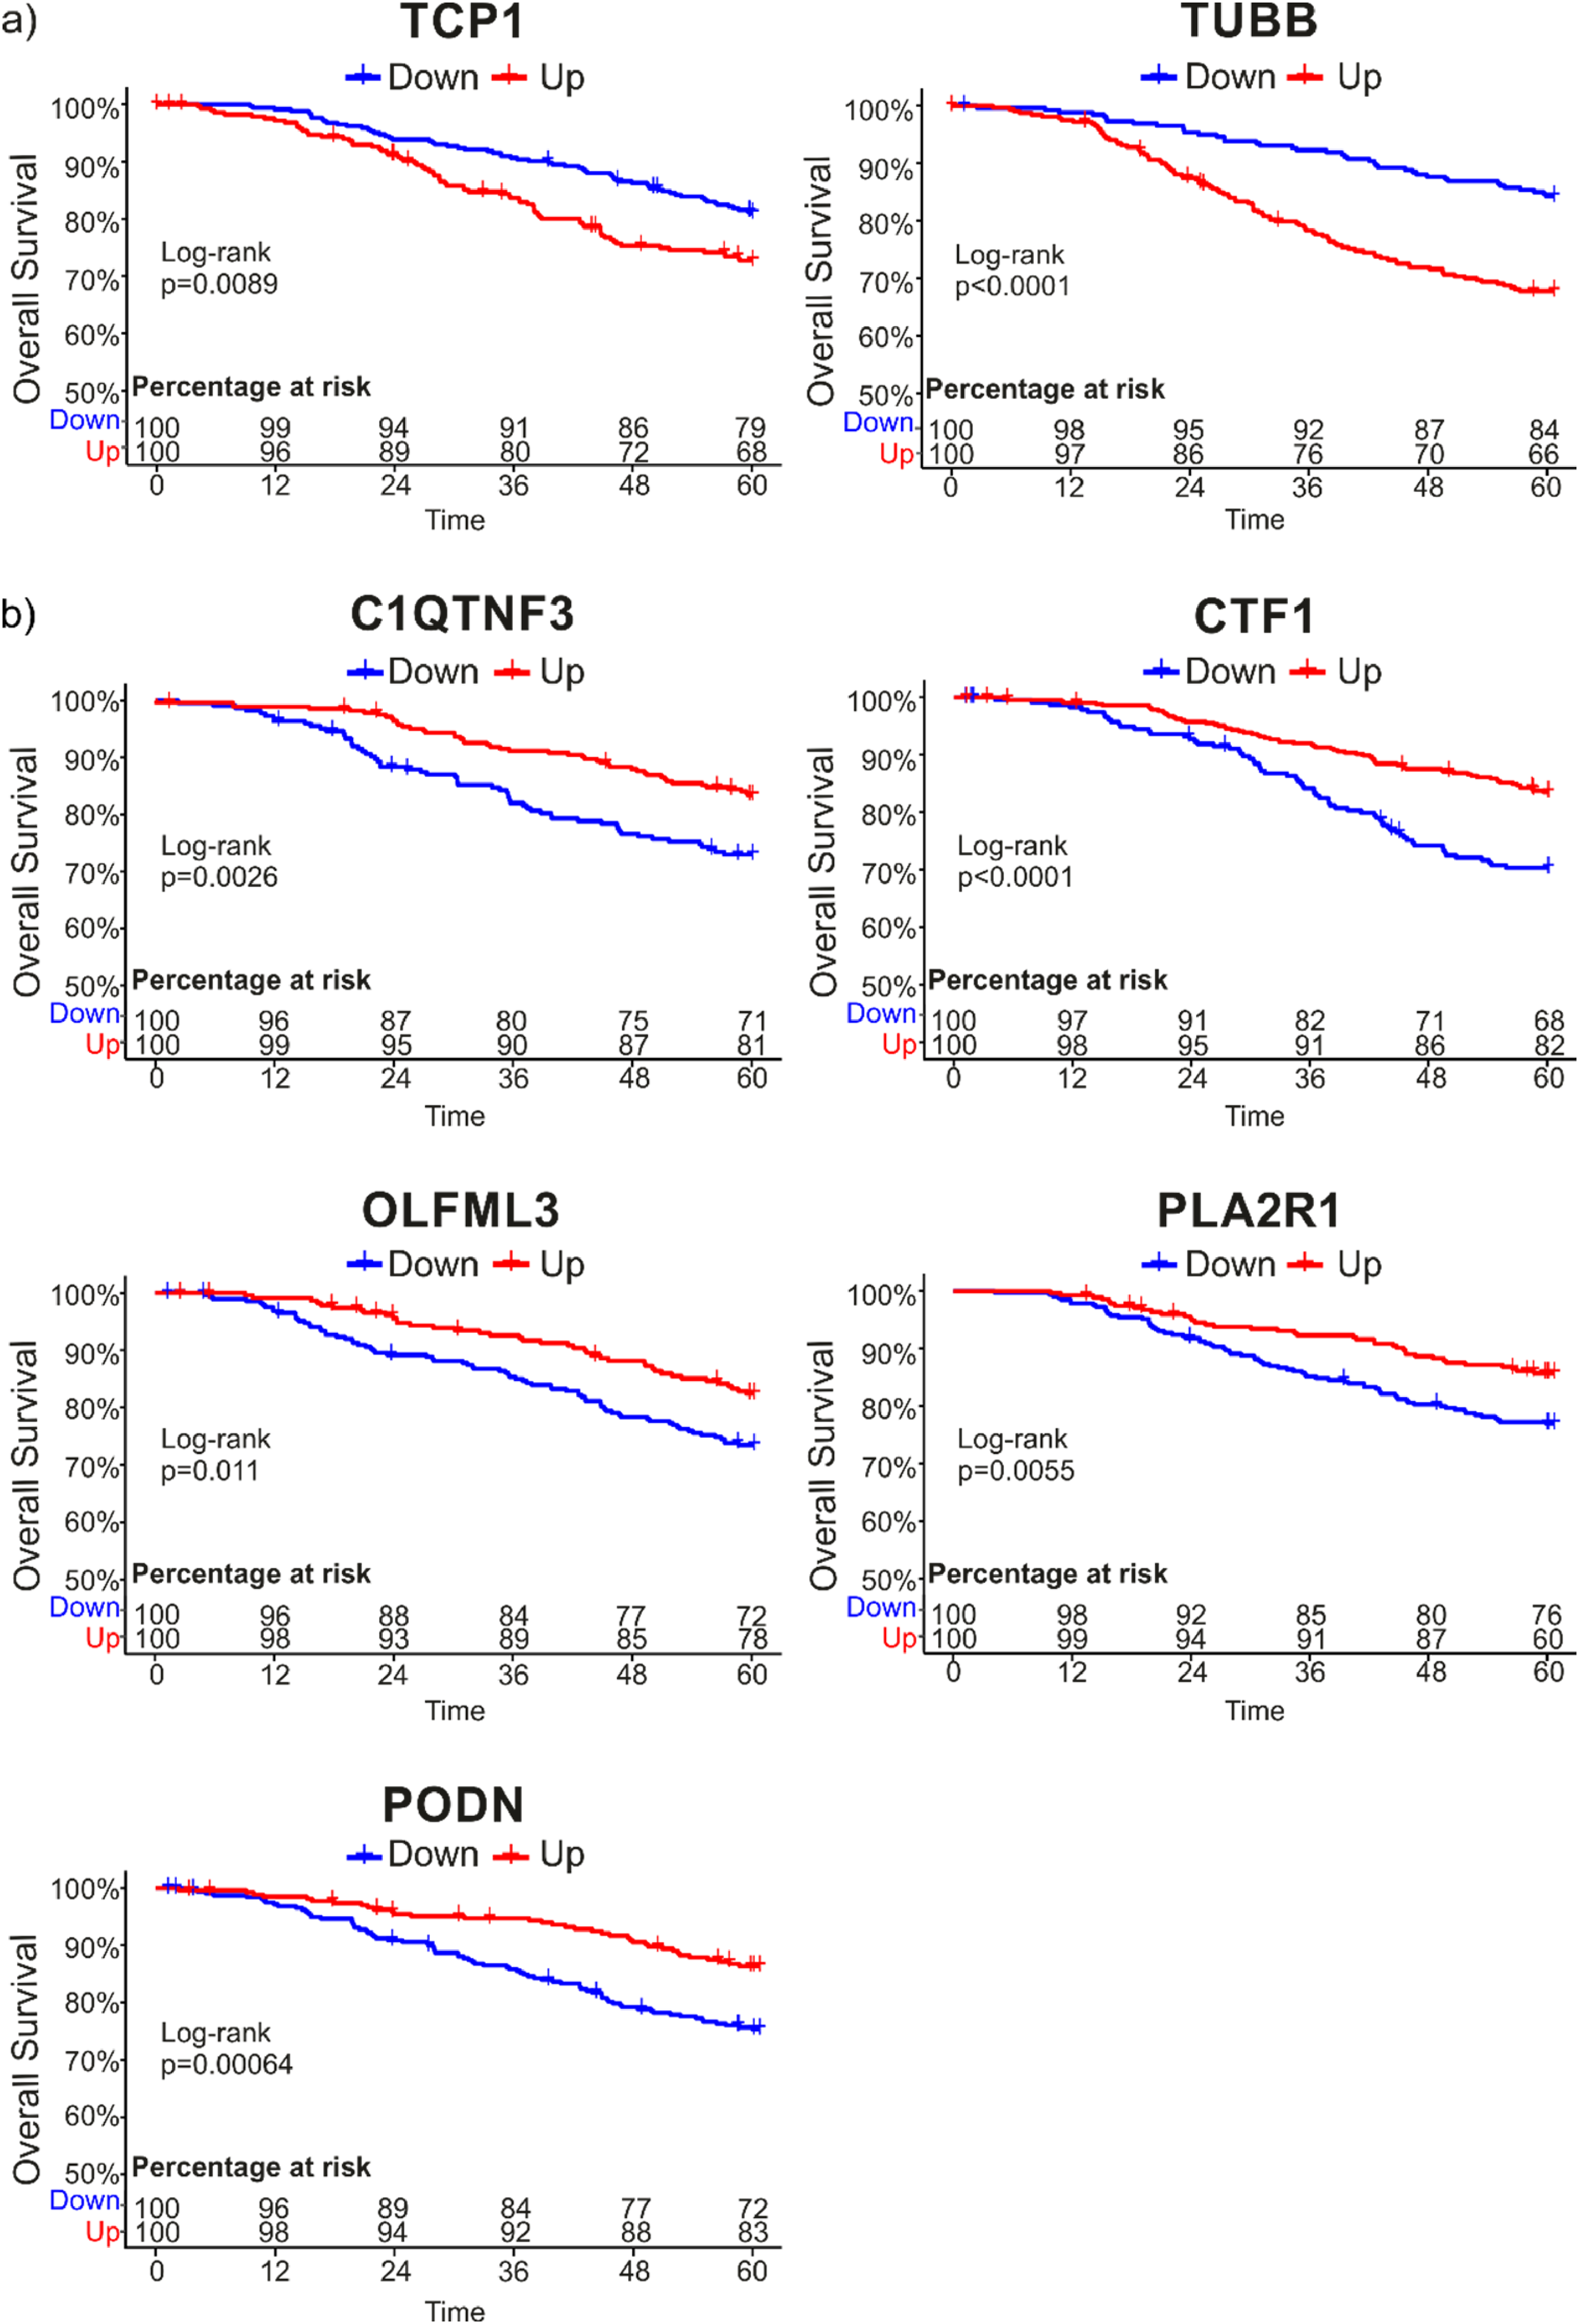
Overall survival (OS) analysis of differentially expressed genes (DEGs) in METABRIC studio. A total of 73 DEGs with a p-adj < .05 were analyzed in the METABRIC database (Nature 2012 & Nat Commun 2016) with a cutoff time of 60 months and a z-score expression >|1|. Of the query genes, only 7 genes had a log-rank <0.05. A, OS of TCP1 and TUBB; (b) OS of C1QTNF3, CTF1, OLFML3, PLA2R1, and PODN. Blue indicates the group of patients in whom the gene was downregulated, and red indicates the group of patients in whom the gene was upregulated.
A similar analysis but using the data from the TCGA study of breast ductal carcinoma was performed. The sub and overexpression were set up according to z-values with respect to the mean expression value. From the DEGs analyzed in this dataset, we found that KRT15 and HLA-A genes were subexpressed in the group with a lower OS rate at 10 years (Figure 6A and B). Interestingly and according to the results obtained using the METABRIC data, TCP1 was found to be overexpressed in the group with lower OS rates at 5 years (Figure 6C).

Overall survival (OS) analysis of differentially expressed genes (DEGs) in TCGA database. A total of 73 DEGs with a p-adj < .05 were analyzed in the ductal carcinoma TCGA database with a cutoff time of 5 and 10 years and the z-score values for expression values. Of the query genes, 3 genes had a P < .05 in the log-rank. A, OS of KRT15; (b) OS of HLA-A, and (c) OS of TCP1. Blue indicates the group of patients in whom the gene was downregulated, and red indicates the group of patients in whom the gene was upregulated.
Furthermore, the analysis of differential expression using the GEO database GSE163882 was performed in order to validate our results. After contrasting the list of 73 DEGs obtained from our samples with the list of DEGs obtained from the GSE163882 study, a total of 11 genes appeared in common: C1QTNF3, PODN, TUBB, MRGPRF, PLA2R1, KRT15, HOXD8, DCN, SOD3, SLIT3, and PRAME. To highlight 5 of the 11 DEGs also had a relationship with OS prediction.
Discussion
Neoadjuvant chemotherapy is the standard treatment for patients with locally advanced breast cancer, and its application has the advantage of diminishing the volume of the principal tumor, making it easier to remove by surgery. In addition, axillary disease, micrometastases, and circulating tumor cells are expected to also be eliminated. 13 The major drawback of this therapeutic approach is that a large percentage of patients develop chemoresistance, which complicates their treatment. 14 Additionally, there are controversial reports about the negative effect of this therapy, indicating that an increase in metastasis was related to its application. 15 Given the heterogeneity of breast cancer disease, new therapeutic strategies suggest individualization of the treatment 16 ; however, this has been hampered by the high cost of current diagnostic and prognostic panels, most of which have been developed for specific molecular subtypes. In this sense, it is important to find new prognostic tools that can be applied to all subtypes of breast cancer. Genomic approaches have been proven to highlight differences among patients with distinct conditions. The application of genomic strategies in breast cancer allowed the discrimination of patients in the early stages of the disease, to prognosticate metastasis to lymph nodes in triple-negative patients, and to predict the response to adjuvant chemotherapy in endocrine-responsive patients.17,18 Analysis of gene expression has allowed classifying breast cancer into different molecular subtypes; in the same way, among the molecular subtypes, the expression of hormonal receptors has been of special utility for the prognosis and prediction of response to therapy.16,19 Preoperative treatment based on anthracyclines and taxanes has demonstrated better pCR in patients with breast cancer, with the drawback that 30% to 50% develops resistance. Current evidence indicates that the mechanisms of resistance to neoadjuvant chemotherapy could be divided into preexisting and acquired. 20 In the pre-After exposure to chemotherapeutics drugs, cells with preexisting mechanism are selected and form resistant tumors. On the other hand, acquired mechanisms of resistance are developed during chemotherapy exposure. 20 In this work, due to its design, only markers of preexisting chemotherapy resistance mechanisms would be observed since the transcriptome of chemotherapy naive patients was used to look for DEGs. The analysis of RNA-seq data of resistant and sensitive patients to neoadjuvant chemotherapy, regardless of their molecular classification, indicated a great number of DEGs. This highlights that there are notable differences at the level of gene expression between these 2 conditions and that there could be indicators of chemotherapy resistance and OS.
After performing a GO enrichment analysis, we identified that most DEGs belong to cellular components related principally to the membrane and the extracellular region, which are processes that involve many receptors responsible for sending signals of proliferation, survival, or apoptosis and signals to metastasis.21,22 Likewise, the KEGG analysis indicated some pathways that could be involved in resistance. One of these pathways is the PI3K/AKT pathway, which can induce mTOR (mammalian target of rapamycin) stimulation, leading to sustained proliferative signals. Activation of PI3K/AKT has been related to breast cancer, and currently, there is much interest in the development of inhibitors of this pathway to target breast cancer. 23 In addition, PI3K/AKT/mTOR pathway upregulation has been linked to chemotherapy and radiotherapy resistance, 24 and its inhibition overcomes drug resistance in breast cancer cells.25,26 Another pathway suggested by our analysis was the MAPK pathway. The activation of the MAPK pathway in breast cancer is promoted by the stimulation of estimated glomerular filtration rate and HER2 receptors and contributes to drug resistance, cancer cell survival, and invasion.27,28 In addition, the MAPK pathway plays a role in the maintenance of breast cancer stem cells and the promotion of EMT, a process necessary for tumor migration and the development of distant metastases. 29 Breast cancer stem cells have been linked to be responsible for the development of chemoresistance. 30
An additional pathway suggested by the KEGG analysis was the TGF-β beta pathway, which is well known to act as a double edge sword during cancer development. TGF-β is a potent tumor suppressor but also enhances invasiveness and metastasis by inducing EMT. 31 The loss of MED12, a regulator of the TGF-β signaling pathway, has been related to chemoresistance in lung cancer and colon cancer, 32 and activation of TGF-β compensates for the action of tyrosine kinase inhibitors (anticancer agents) by inducing the MAPK pathway. 33 In hepatocellular carcinoma, TGF-β signaling contributes to drug resistance by inducing the expression of PXR, 34 and in squamous cell carcinoma, the inhibition of TGF-β results in a chemosensitive phenotype. 35 In breast cancer, the determination of protein expression levels of TGF-β pathway components has been suggested to be of utility for prognosis and to identify patients at increased risk for disease recurrence. 36
The interactome analysis showed 3 principal clusters related to an extracellular matrix organization, keratinocyte differentiation, and drug metabolism. Proteins of the extracellular matrix have a role in cancer-activating pathways related to growth, proliferation, and metastasis.37,38 The proteins involved in keratinocyte differentiation, such as keratins, have been documented to play a role in invasion and EMT.39,40 The third cluster contains genes related to drug metabolism, specifically, overexpression of CYP450 components that have been related to drug resistance in breast cancer. 41
Genes downregulated in the resistance group were also observed to have low expression in the group of patients with lower OS. Among the genes related to OS, the CTF1 gene, which encodes a cytokine of the gp130 group and is mainly expressed in the heart, skeletal muscle, kidneys, lung, and liver, 42 was observed with low expression in the resistant group and the lower OS group. The functions of CTF1 have been related to activation of the JAK-STAT pathway, promotion of angiogenesis, and activation of cellular proliferation. 43 Its role in cancer is related to cell growth and interleukin-6 positive regulation. 44 CTF1 relationship with drug response or chemotherapy resistance mechanisms could be through its interaction with the leukemia inhibitory factor receptor (LIFR) which has been related to cancer progression, metastasis, stem cell maintenance, and therapy resistance. Recently the inhibitor EC359 of LIFR signaling has been developed. Treatment of triple-negative breast cancer cell lines with EC359 reduces proliferation, invasion, and stemness and promotes apoptosis. Moreover, a reduction in tumor progression and proliferation was observed after the treatment with EC359 of explants and xenografts derived from patients with breast cancer. 45
The olfactomedin-like 3 (OLFML3) gene also had low expression in the resistance group as well as in the lower OS group. The functions and mechanisms in which this gene is involved remain unclear, although it has been related to embryonic development. 46 Regarding its role in cancer, it has been proposed that the expression of this gene increases in the tumor stroma and in the EMT process47,48; furthermore, it is the target of miR-155 and BRMS1. The first has been associated with the cell cycle, proliferation, and myogenic differentiation, 49 and the latter has been associated with the inhibition of breast cancer cell metastasis through the recruitment of the LSD2/CoREST complex and the inhibition of OLFML3 expression. 48 In this sense, low expression levels of OLFML3 could be associated with less metastasis potential, and we could not analyze this hypothesis since the samples included in this study were not from breast cancer patients with metastasis. In addition, changes in the expression of BRMS1 were not observed between the study groups.
The expression of podocan (PODN) was also diminished in both resistant patients and the lowest OS group. This gene blocks proliferation in human bladder smooth muscle cells, 50 and its overexpression has been associated with an increase in p21 expression and a decrease in cdk2, leading to the arrest of the cell cycle and the inhibition of the G1 to S phase transition.50,51
An interesting gene that regulates the TGF-β pathway and that was observed with low expression in resistant patients and patients with poor OS was C1QTNF3 (C1q and tumor necrosis factor-related protein 3). This gene has been related to the stimulation of cell proliferation and the induction of expression of anti-apoptotic molecules in prostate cancer cells by mediating the activation of the PKC signaling pathway. 52 Hofmann et al found that C1QTNF3 has antifibrotic effects by inhibiting TGF-β beta production. 53 In this work, KEGG analysis pointed out the possible involvement of the TGF-β beta pathway in the mechanisms of chemotherapy resistance. Low expression of C1QTNF3 in the resistant group could lead to the activation of the TFG-beta pathway, which in turn could increase proliferative signals resulting in tumor progression. 54
Likewise, the phospholipase A2 receptor 1 (PLA2R1) gene was observed with low expression in the resistant group and the group with less OS. This gene has tumor-suppressor activity by promoting apoptosis and blocking transformation, 55 and its downmodulation has been observed in most cancer types. 56 The knockdown of this gene in prostate cancer cells increases cell proliferation but does not affect their sensitivity to docetaxel. 57 In breast cancer, negative regulation of this gene was reported in all molecular subtypes, and promoter hypermethylation of this gene has been associated with aggressive subtypes. 58 Regarding its role in chemotherapy, PLA2R1 regulates JAK/STAT signaling, and the targeting of PLA2R1 overcomes senescence. 59 All these reports indicate that this gene could play an important role in the resistance and OS.
Other gene that was found differentially expressed in resistant versus sensitive patients was cytokeratin 15 (KRT15), this gene was proposed in breast cancer as a marker for a different subset of breast tumors. 60 The expression of KRT15 was also observed in response to sonic hedgehog signal in breast epithelial cells. 61 In addition, genetic alterations in KRT15 have been related to trastuzumab-induced cardiotoxicity in HER-2 positive patients with breast cancer. 62 Recently, low expression of KRT15 has been associated with poor OS in patients with breast cancer. 63 In this work, KRT15 was found with low expression in resistant patients, mechanisms of chemotherapy resistance that involve this gene are not described so far and it will be interesting to evaluate in a model of breast cancer whether the expression of KRT15 modulates the phenotype of resistance to anthracyclines or taxanes, further studies are needed regarding this topic.
In addition, low expression of HLA-A was also observed in patients with resistance. HLA-A was observed as a marker of chemotherapeutic treatment response in triple-negative breast cancer patients treated with durvalumab. 64 Interestingly, therapeutic strategies aimed at the development of antibodies directed against HLA-A and tumor antigens have shown good efficacy in the induction of tumor cell death in vitro and in vivo. 65 Moreover, the expression of HLA-A was observed to be decreased in breast cancer and it has been associated with low lymphocyte infiltration, lower OS, and poor prognosis. 66 Interestingly, high expression of KRT15 and HLA-A was related to better OS to 10 years (Figure 6A and B), indicating that both genes could be good prognostic candidates for long-term survival, further studies would reveal this potential use.
On the other hand, 2 genes were highly expressed in resistant and low OS patients, tubulin-β (TUBB) and T-complex protein 1 (TCP1). Tubulin-β beta together with Tubulin-α forms a heterodimer that is a component of microtubules.67,68 TUBB is necessary for microtubule polymerization and depolymerization to spindle formation during mitosis. 69 It has been proposed that resistance to taxanes and microtubule-stabilizing agents depends on tubulin mutations and the content of tubulin isoforms. 70 Norimura et al. evaluated the expression of tubulin beta by histochemistry in samples of patients who received anthracycline and taxane as chemotherapy. They reported that more than 10% positivity for this protein was associated with taxane responders and less than 10% positivity was a characteristic of taxane nonresponders. 71 Additionally, in their work, they showed evidence about the probable use of tubulin beta as a prognostic marker for OS. In our work, we found a high expression of TUBB in resistant patients. This contradictory result could be explained because we measured RNA levels instead of protein levels. High levels of RNA could be an indication of a compensatory mechanism after protein diminution; however, this hypothesis needs to be addressed. On the other hand, TCP1 is a protein involved in the folding of cytoskeletal proteins, including tubulin. The interruption of the tubulin-β/TCP1 axis leads to cellular apoptosis through caspase-dependent signaling. 72 TCP1 has been reported to play a role in the maturation of Cycline E, which in turn activates Cdk2 to positively control the G1/S phase transition. 73 Overexpression of TCP1 has been observed in multidrug-resistant uterine cancer cells and colorectal cancer cells.74,75 In breast cancer patients, it has been reported that amplification and/or overexpression of TCP1 correlates with reduced OS measured at 300 months. In our analysis, a similar pattern was observed, but with a cutoff of 60 months, a time that is more useful for clinicians. 76
The validation of our results with the GSE163882 database, highlight 11 common DEGs, nevertheless, is important to mention that the percentages of luminal (43%), Her2+ (16%) and, triple-negative (41%) molecular subtypes, differed from our data with 40% for luminal, 36% for Her2+ and, 18% for triple negative. In our population, there were more Her2+ molecular subtypes than triple negative, contrary to GEO study where there were more triple negative than Her2+ molecular subtypes. That could be the reason which from the 73 DEGs found in our data, only 11 DEGs were common in both lists.
Conclusion
In conclusion, this work highlights the differences in the level of gene expression in patients resistant and sensitive to neoadjuvant chemotherapy. These differences indicate that cellular components related to the extracellular region and plasma membrane were mainly involved. Furthermore, 73 DEGs were able to discriminate against patients resistant and sensitive to neoadjuvant chemotherapy. These DEGs could be used as possible biomarkers of response to chemotherapy regardless of the molecular subtype, and 9 of them were able to predict OS. More studies are needed to test these putative biomarkers in a large number of breast cancer patients. These findings also corroborate the sensitivity of the RNAseq methodology to highlight the genetic behavior of different pathological conditions. The RNAseq methodology has shown great potential to find subtle differences that could aid the development of assays and help in the prognosis and diagnosis of diverse pathologies. Gene fusions, differential gene expression, new RNA species, splice variants, aberrant splicing, allele-specific expression, extracellular RNAs, noncoding RNA species, chimeric gene fusions, and detection of exogenous RNA are in the repertoire of possibilities that RNAseq could detect in association with a determined pathology. There is no doubt that RNAseq is a methodology with great potential, the greatest task now lies in the development of clinical trials focused on specific questions with representative samples and whose results after validation in large trials can be transferred to the clinic as lower cost assays.
Authors’ Note
Adriana Aguilar-Lemarroy and Luis F Jave-Suárez contributed equally.
Supplemental Material
sj-docx-1-tct-10.1177_15330338211068965 - Supplemental material for Transcriptomic Analysis of Breast Cancer Patients Sensitive and Resistant to Chemotherapy: Looking for Overall Survival and Drug Resistance Biomarkers
Supplemental material, sj-docx-1-tct-10.1177_15330338211068965 for Transcriptomic Analysis of Breast Cancer Patients Sensitive and Resistant to Chemotherapy: Looking for Overall Survival and Drug Resistance Biomarkers by Carlos A Barrón-Gallardo, Mariel Garcia-Chagollán, Andres J Morán-Mendoza, Raul Delgadillo-Cristerna, María G Martínez-Silva, Adriana Aguilar-Lemarroy and Luis F Jave-Suárez in Technology in Cancer Research & Treatment
Supplemental Material
sj-docx-2-tct-10.1177_15330338211068965 - Supplemental material for Transcriptomic Analysis of Breast Cancer Patients Sensitive and Resistant to Chemotherapy: Looking for Overall Survival and Drug Resistance Biomarkers
Supplemental material, sj-docx-2-tct-10.1177_15330338211068965 for Transcriptomic Analysis of Breast Cancer Patients Sensitive and Resistant to Chemotherapy: Looking for Overall Survival and Drug Resistance Biomarkers by Carlos A Barrón-Gallardo, Mariel Garcia-Chagollán, Andres J Morán-Mendoza, Raul Delgadillo-Cristerna, María G Martínez-Silva, Adriana Aguilar-Lemarroy and Luis F Jave-Suárez in Technology in Cancer Research & Treatment
Supplemental Material
sj-docx-3-tct-10.1177_15330338211068965 - Supplemental material for Transcriptomic Analysis of Breast Cancer Patients Sensitive and Resistant to Chemotherapy: Looking for Overall Survival and Drug Resistance Biomarkers
Supplemental material, sj-docx-3-tct-10.1177_15330338211068965 for Transcriptomic Analysis of Breast Cancer Patients Sensitive and Resistant to Chemotherapy: Looking for Overall Survival and Drug Resistance Biomarkers by Carlos A Barrón-Gallardo, Mariel Garcia-Chagollán, Andres J Morán-Mendoza, Raul Delgadillo-Cristerna, María G Martínez-Silva, Adriana Aguilar-Lemarroy and Luis F Jave-Suárez in Technology in Cancer Research & Treatment
Footnotes
Abbreviations
Acknowledgments
CAB-G is grateful for a scholarship from Consejo Nacional de Ciencia y Tecnología (CONACyT)-Mexico.
Declaration of Conflicting Interests
The author(s) declared no potential conflicts of interest with respect to the research, authorship, and/or publication of this article.
Funding
The author(s) disclosed receipt of the following financial support for the research, authorship, and/or publication of this article: This work was supported by the Fondo de Investigación en Salud, IMSS (grant number FIS/IMSS/PROT/PRIO/14/030).
Supplemental Material
Supplemental material for this article is available online.
References
Supplementary Material
Please find the following supplemental material available below.
For Open Access articles published under a Creative Commons License, all supplemental material carries the same license as the article it is associated with.
For non-Open Access articles published, all supplemental material carries a non-exclusive license, and permission requests for re-use of supplemental material or any part of supplemental material shall be sent directly to the copyright owner as specified in the copyright notice associated with the article.