
Abstract
Background:
Breast cancer is the most commonly diagnosed malignancy and a major cause of cancer-related deaths in women globally. Identification of novel prognostic and pathogenesis biomarkers play a pivotal role in the management of the disease.
Methods:
Three data sets from the GEO database were used to identify differentially expressed genes (DEGs) in breast cancer. Gene Ontology (GO) enrichment and Kyoto Encyclopaedia of Genes and Genomes pathway analyses were performed to elucidate the functional roles of the DEGs. Besides, we investigated the translational and protein expression levels and survival data of the DEGs in patients with breast cancer from the Gene Expression Profiling Interactive Analysis (GEPIA), Oncomine, Human Protein Atlas, and Kaplan Meier plotter tool databases. The corresponding change in the expression level of microRNAs in the DEGs was also predicted using miRWalk and TargetScan, and the expression profiles were analyzed using OncomiR. Finally, the expression of novel DEGs were validated in Chinese breast cancer tissues by RT-qPCR.
Results:
A total of 46 DEGs were identified, and GO analysis revealed that these genes were mainly associated with biological processes involved in fatty acid, lipid localization, and regulation of lipid metabolism. Two novel biomarkers, ADH1A and IGSF10, and 4 other genes (APOD, KIT, RBP4, and SFRP1) that were implicated in the prognosis and pathogenesis of breast cancer, exhibited low expression levels in breast cancer tissues. Besides, 14/25 microRNAs targeting 6 genes were first predicted to be associated with breast cancer prognosis. RT-qPCR results of ADH1A and IGSF10 expression in Chinese breast cancer tissues were consistent with the database analysis and showed significant down-regulation.
Conclusion:
ADH1A, IGSF10, and the 14 microRNAs were found to be potential novel biomarkers for the diagnosis, treatment, and prognosis of breast cancer.
Keywords
Introduction
Breast cancer is one of the most commonly diagnosed cancer, resulting in high rates of cancer-related mortality in women. 1 It has a high incidence rate, and the American Institute for Cancer Research reported that in 2018, there were about 2 million new breast cancer cases. Breast cancer biomarkers play a pivotal role in clinical practice since they can be used to guide early diagnosis, individualized treatment, and prognosis. Although numerous risks and prognostic factors for breast cancer have been reported, and several biomarkers have also been identified, the mechanisms of breast cancer prognosis and pathogenesis remain to be fully elucidated. This renders the identification of novel biomarkers urgent. 2
Comprehensive and in-depth cancer research entails the use of microarray and sequencing-based technologies to compare gene expression, for the accurate evaluation of the pathogenesis, and prediction of prognostic factors for various tumors. 3,4 Recently, the advent of second-generation sequencing and protein profiling has markedly improved the efficiency of biological problem-solving, and these are currently widely used in cancer research.
This study aimed at identifying novel biomarkers associated with the prognosis and potential pathogenesis of breast cancer using integrated bioinformatics analysis. Briefly, the expression profiles of 3 genes, GSE89116, GSE109169, and GSE1390383, were downloaded from the Gene Expression Omnibus (GEO) database and analyzed using the GEO2 R online tool, followed by identification of the DEGs. The overlapping DEGs across the 3 datasets were analyzed using Gene Ontology (GO) enrichment and Kyoto Encyclopaedia of Genes and Genomes (KEGG) pathway analysis. 5 Significant DEGs were determined by analyzing the expression levels of the overlapping DEGs in breast tissues derived from breast cancer patients and normal subjects. The prognostic value of these factors was identified using Gene Expression Profiling Interactive Analysis (GEPIA), 6 and translational and protein expression levels for the most significant DEGs were validated using Oncomine and Human Protein Atlas (HPA), respectively. 7,8 To identify the prognostic value of the most significantly expressed DEGs in breast cancer, Kaplan Meier plotter was used. 9 miRWalk 10 and TargetScan 11 were used to predict microRNA (miRNA) in the significantly expressed DEGs, and the intersecting miRNAs were verified using OncomiR. 12 These findings provide evidence of novel prognostic biomarkers for breast cancer.
Materials and Methods
Microarray Data
Expression profiles for the 3 genes, GSE89116, GSE109169, and GSE1390383, were downloaded from the GEO database (http://www.ncbi.nlm.nih.gov/geo/), a public functional genomics data repository that supports MIAME-compliant data submissions. In the database, tools are provided to help users query and download experimental and curated gene expression profiles. GSE89116 was sequenced on the GPL6947 platform(Illumina HumanHT-12 V3.0 expression BeadChip) from 9 breast cancer and 24 normal breast tissues, GSE109169 was generated on the GPL5175 platform, (HuEx-1_0-st) Affymetrix Human Exon 1.0 ST Array [transcript (gene) version] from 25 breast cancer and 25 normal breast tissues, and GSE139038 was sequenced on the GPL27630 platform [Print_1437 (Block_Column_Row IDs)] from 41 breast cancer and 18 normal breast tissues. 13
Identification of DEGs
DEGs were identified using GEO2 R (http://www.ncbi.nlm.nih.gov/geo/geo2r), an interactive online tool for comparing 2 or more datasets across experimental conditions. DEGs were identified using a classic t-test, as well as the standard of |logFC|>2, with adj. P < 0.05 was considered to be statistically significant. 14 Overlapping DEGs across the 3 gene profiles were identified using Venny 2.1 (https://bioinfogp.cnb.csic.es/tools/venny/index.html).
Enrichment Analysis
Overlapping DEGs were identified by GO enrichment and KEGG pathway analyses in WebGestalt (http://www.webgestalt.org), using the Over-Representation Analysis (ORA) method. WebGestalt supports 3 well-established and complementary methods for enrichment analysis: ORA, Gene Set Enrichment Analysis, and Network Topology-based Analysis. 5 GO enrichment targeted enriched biological process (BP), cellular component (CC), and molecular function (MF), with an FDR of <0.05 considered statistically significant.
Determination of Significant DEGs
To identify the most significant DEGs, the expression levels of overlapping DEGs in breast cancer tissues were compared with those from normal breast tissues using the standard fold change of >2 and P < 0.01. Prognostic values for breast cancer (Log rank P < 0.05) were determined using GEPIA (http://gepia.cancer-pku.cn/). This is a newly developed interactive web server analyzing RNA sequencing data for 9,736 tumors and 8,587 normal samples from The Cancer Genome Atlas (TCGA) and the GTEx projects, using a standard processing pipeline. 6 The expression of the significantly expressed DEGs was analyzed across different pathological stages of breast cancer.
mRNA and Protein Expression Analysis of the Significantly Expressed DEGs
Analysis of the mRNA levels of DEGs in different cancer types was performed using Oncomine gene expression array datasets (https://www.oncomine.org/resource/login.html, an online cancer microarray database). The resulting mRNA expression profiles from the significantly expressed DEGs across clinical cancer specimens were compared with those from normal controls, using a Student’s t-test, P < 0.01, and fold change of 4. Furthermore, translational and protein expression levels of the significantly expressed DEGs were validated using Oncomine and HPA, respectively. HPA (https://www.proteinatlas.org/) is a Swedish-based program initiated in 2003 that aids in the mapping of all human proteins in cells, tissues, and organs using the integration of various omics technologies, including antibody-based imaging, mass spectrometry-based proteomics, transcriptomics, and systems biology. 7
Analysis of Prognostic Value
The identification of overall survival rates of the 6 significantly expressed DEGs in breast cancer was performed using the Kaplan Meier plotter (https://kmplot.com/analysis), an online tool used to assess the effect of 54 k genes on survival across 21 cancer types. 9 A Log-rank P < 0.05 was considered to be statistically significant. The system comprised of a gene chip and RNA-seq data derived from GEO, EGA, and TCGA, while the primary purpose of the tool was meta-analysis-based discovery and validation of survival biomarkers.
miRNA Prediction
miRNAs in the 6 significantly expressed DEGs were predicted using online tools miRWalk (http://mirwalk.umm.uni-heidelberg.de/) 10 and TargetScan (http://www.targetscan.org/vert_72/). 11 A Venn diagram was generated to describe the intersection. The resulting miRNA intersection was further analyzed using OncomiR (http://www.oncomir.org/oncomir/index.html), 12 and a t-test (FDR < 0.05) was performed to ascertain whether there were any significant differences in their expression levels, relative to those of corresponding target genes in breast cancer tissues. Finally, the overall survival rates of the miRNAs were analyzed using the Kaplan Meier plotter with a Log-rank P < 0.05.
Sample Collection
Ten samples from fresh tumor tissues and 10 samples from paired adjacent non-tumor tissues were collected from breast cancer patients after surgical resection at the Affiliated Hospital of Xuzhou Medical University, Xuzhou, China. This study was carried out in accordance with the guidelines of the Ethics Committee of the Affiliated Hospital of Xuzhou Medical University, with written informed consent from all subjects. All subjects gave written informed consent in accordance with the World Medical Association Declaration of Helsinki. The protocol was approved by the Affiliated Hospital of Xuzhou Medical University (Approval number: XYFY2019-KL095).
RNA Extraction and RT-qPCR
Total RNA was extracted using the Trizol reagent (Servicebio, China) according to the manufacturer’s instructions. The cDNA was synthesized by using the Servicebio®RT First Strand cDNA Synthesis Kit (Servicebio, China). RT-qPCR was performed with 2×SYBR Green qPCR Master Mix (Low ROX) (Servicebio, China) on the ABI 7500 fast real-time PCR system. The amplification reaction procedure was as follows: 95°C for 10 min, followed by 95°C for 15 s and 60°C for 30 s for 40 cycles. GAPDH was applied as internal control for mRNA, and the relative expression level of mRNA was calculated by 2- △△ct method. Primer sequences were listed in Table S1.
Results
Significantly Expressed DEGs
A total of 393 DEGs were obtained from the GSE89116 dataset. Among them, 97 were upregulated and 296 downregulated. A total of 119 DEGs were identified from GSE109169, 29 of which were upregulated and 90 downregulated. GSE139038 yielded 408 DEGs, 43 of which were upregulated and 365 downregulated. [|logFC|>2 and adj. P < 0.05; shown in volcano plots drawn in R software (ggpubr and ggthemes packages) (Figures 1A-C).

(A-C) Volcano plot of DEGs between breast cancer and normal breast tissues in each dataset. red dots, significantly upregulated genes in breast cancer tissues; green dots, significantly downregulated genes in breast cancer tissues; blue dots, not significantly expressed genes. |logFC|>2 and adj. P < 0.05 were considered to indicate a statistically significant difference. (D) Venn diagram of 46 overlapping DEGs from the GSE89116, GSE109169 and GSE139038 datasets. DEGs, differentially expressed genes.
Besides, Venny 2.1 was used to identify 46 overlapping DEGs across the 3 datasets. Among them, 5 were upregulated and 41 downregulated (Figure 1D, Table 1).
A Total of 46 Overlapping DEGs Were Identified in the GSE89116, GSE109169, and GSE139038 Datasets, Including 5, Upregulated and 41 Downregulated.
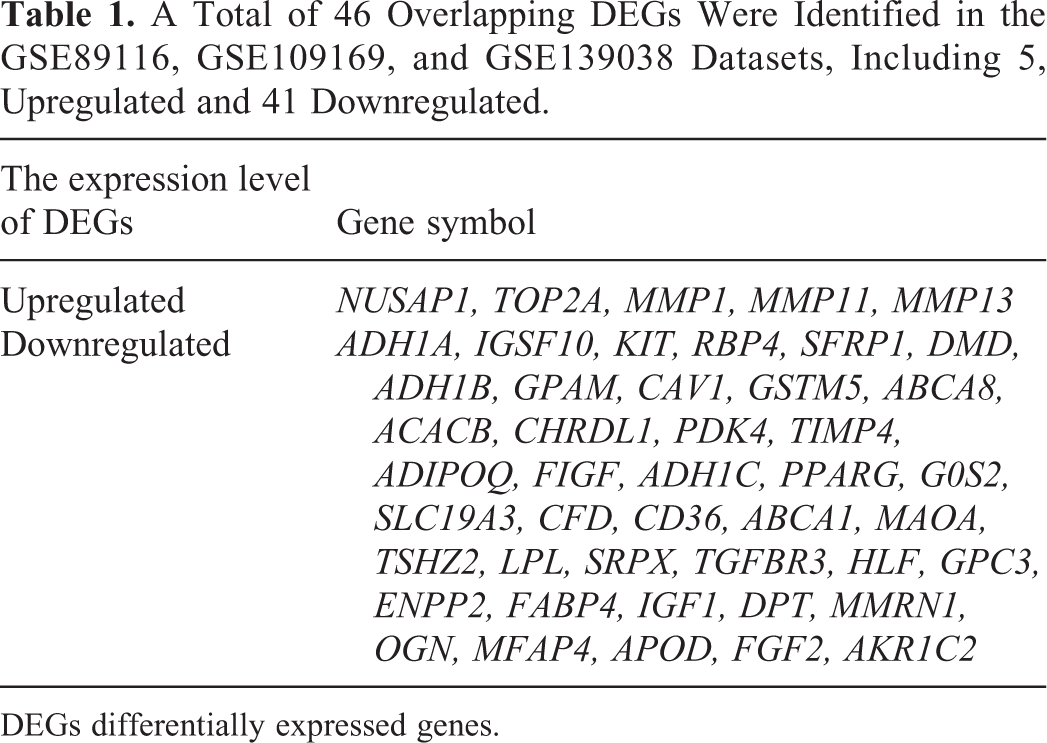
DEGs differentially expressed genes.
Enrichment Analysis
Enrichment analysis revealed the top 10 gene sets in biological process (BP), molecular function (MF), cellular component (CC), and KEGG pathways by WebGestalt using the ggplot2 package in the R language for visualization (Figure 2). The 46 DEGs were enriched in response to the following processes: Fatty acid, lipid localization, regulation of lipid metabolism, cellular lipid metabolism, lipid transport, muscle cell proliferation, lipid metabolism, primary alcohol metabolism, organic hydroxy compound metabolism and alcohol metabolism by BP analysis; nicotinamide adenine dinucleotide (NAD) activity, zinc-dependent, lipid transporter activity, monocarboxylic acid-binding, extracellular matrix structural constituent, zinc ion binding, carboxylic acid-binding, organic acid-binding, oxidoreductase activity, acting on the CH-OH group of donors, NAD or nicotinamide adenine dinucleotide phosphate as acceptor, oxidoreductase activity, acting on CH-OH group of donors by MF analysis; extracellular matrix, collagen-containing extracellular matrix, platelet α granule and cell surface by CC analysis; and PPAR signaling pathway, drug metabolism, tyrosine metabolism, chemical carcinogenesis, AMPK signaling pathway, metabolism of xenobiotics by cytochrome P450 and fatty acid degradation by KEGG pathway analysis (FDR < 0.05).

Enrichment analysis of 46 overlapping DEGs revealed top 10 geneSets in (A) BPs, (B) MFs, (C) CCs and (D) KEGG pathways by WebGestalt using the ggplot2 package in R language for visualization. DEGs, differentially expressed genes; BPs, Biological processes; MFs, Molecular Functions; CC, Cellular Components; KEGG, Kyoto Encyclopedia of Genes and Genomes; NAD, Alcohol Dehydrogenase; NADP, Nicotinamide Adenine Dinucleotide Phosphate.
Identification of the Significantly Expressed DEGs Through GEPIA
The most significant DEGs were identified by comparing the expression levels of the 46 DEGs between tissues from breast cancer patients and those from normal subjects, followed by overall survival (OS) analysis using GEPIA. A total of 6 DEGs, ADH1A, APOD, IGSF10, KIT, RBP4, and SFRP1, were identified as the most significantly expressed, having met the expression threshold in the GEO and GEPIA databases (Figure 3). These DEGs were also associated with the prognosis of breast cancer following their low expression in tumor tissues (Figure 4). Among these DEGs, ADH1A and IGSF10 were found to be novel biomarkers for breast cancer prognosis. Furthermore, the expression levels of ADH1A (P = 0.047), APOD (P = 0.02), and KIT (P = 0.047) were differentially expressed across tumor stages, whereas those of IGSF10 (P = 0.33), RBP4 (P = 0.11), and SFRP1 (P = 0.24) were not (Figure 5).

Expression level of ADH1A, APOD, IGSF10, KIT, RBP4 and SFRP1 between breast invasive carcinoma (BRCA) and normal breast tissues (GEPIA). (A) scatter diagram. (B) box plot. TPM, transcripts per million.

Prognostic value (overall survival) of the mRNA level of ADH1A, APOD, IGSF10, KIT, RBP4 and SFRP1 in breast cancer patients (GEPIA). TPM, transcripts per million.

Correlation between the expression of the 6 most significant DEGs and tumor stage in breast cancer patients (gene expression profiling interactive analysis). DEGs, differentially expressed genes.
Profiles of mRNA and Protein Expression
Analysis of the expression levels in the 6 significantly expressed DEGs using Oncomine revealed lower levels in breast cancer when compared with normal tissues (Figure 6). Similarly, immunohistochemistry data from the HPA project, revealed that the proportions with low or not detected expression of ADH1A, APOD, IGSF10, KIT, RBP4, and SFRP1 were 11/12, 2/12, 2/12, 47/47, 20/23, and 9/12 in breast cancer samples, respectively, whereas the proportions with low or not detected expression of ADH1A, APOD, IGSF10, KIT, RBP4 and SFRP1 were 2/7, 0/2, 0/1, 2/7, 2/5 and 0/3 in normal breast tissues (Figure 7).

Transcription levels of ADH1A, APOD, IGSF10, KIT, RBP4 and SFRP1 in different types of cancer (Oncomine).
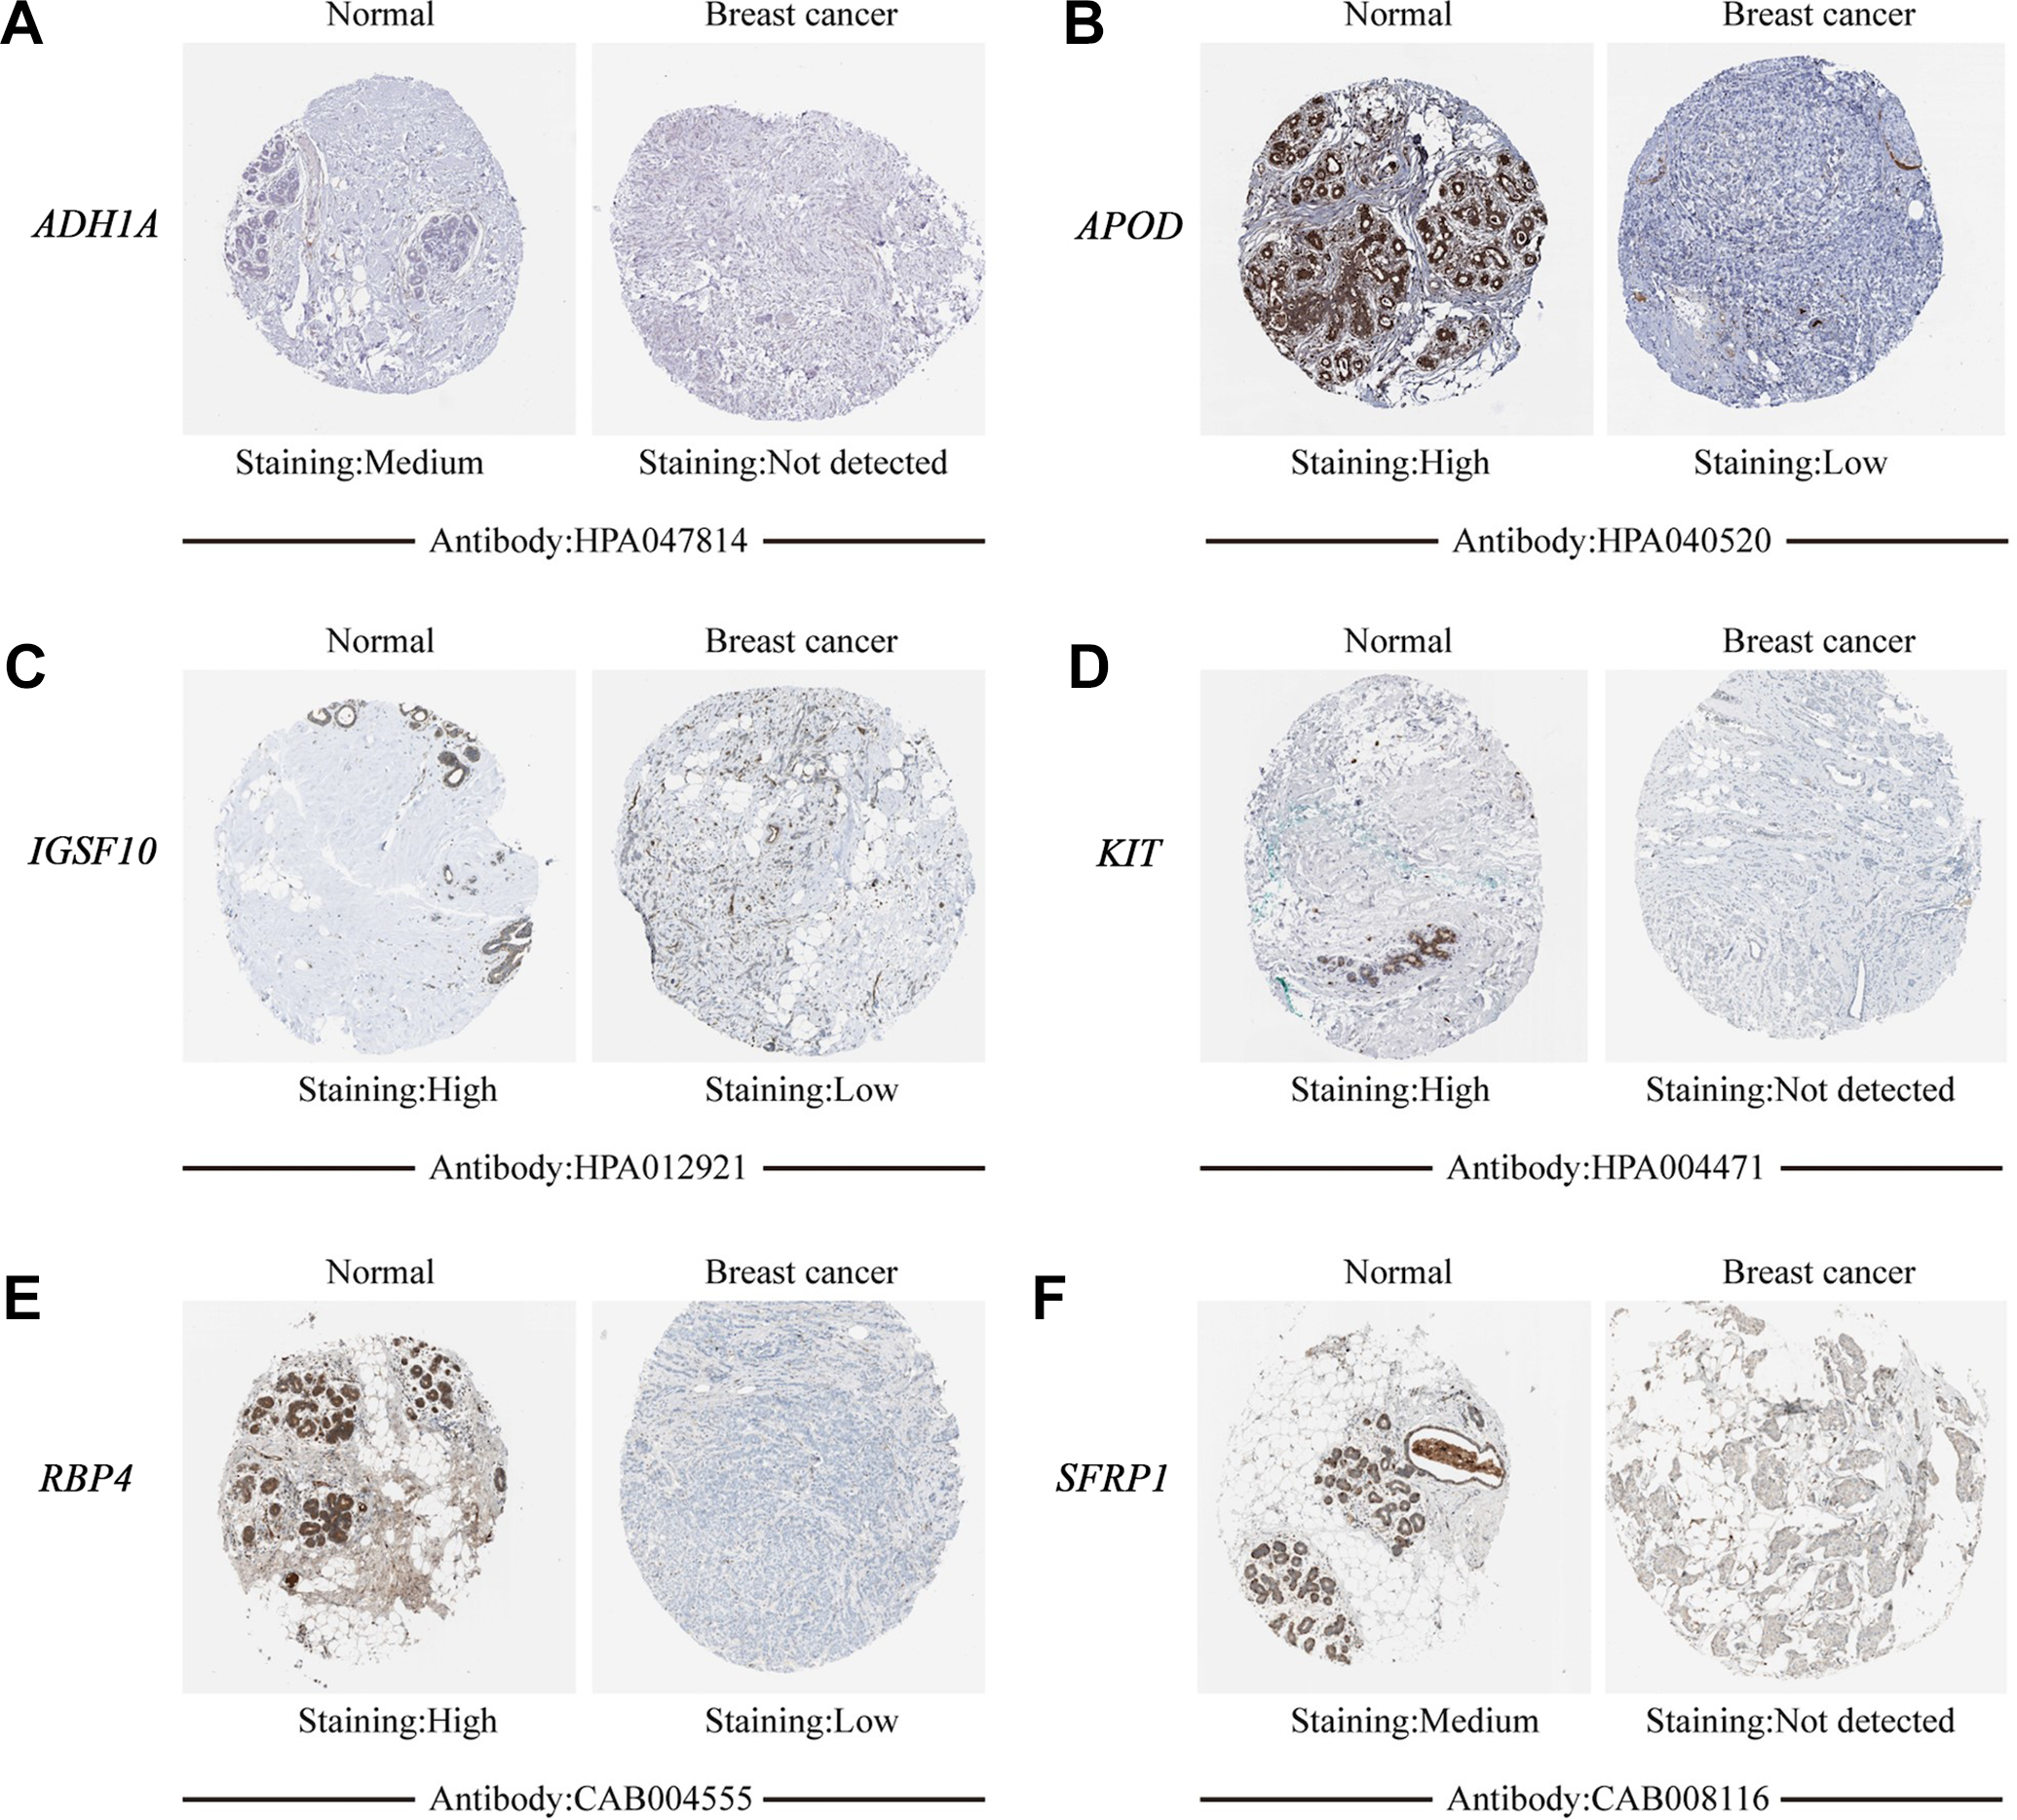
Representative immunohistochemical images of (A) ADH1A, (B) APOD, (C) IGSF10, (D) KIT, (E) RBP4 and (F) SFRP1 in breast cancer and normal breast tissues derived from the human protein atlas database.
Prognostic Value of the 6 Most Significantly Expressed DEGs
Results from the Kaplan Meier plotter revealed a positive correlation between the expression of ADH1A (P = 0.02), APOD (P = 0.026), IGSF10 (P = 0.0013), KIT (P = 6.2e−05), RBP4 (P = 0.017), and SFRP1 (P = 0.0031) and good prognosis in breast cancer (Log rank P < 0.05). These results indicated that the 6 genes were prognostic factors for breast cancer (Figure 8).

Prognostic value (overall survival) of mRNA level of ADH1A, APOD, IGSF10, KIT, RBP4 and SFRP1 in breast cancer patients (Kaplan-Meier plotter).
miRNA Prediction and Prognostic Analysis
The miRWalk tool predicted 1,570, 1,417, 2,140, 2,000, 1,338 and 1,624 miRNAs corresponding to the 6 significantly expressed DEGs. Lower numbers of the significantly expressed DEGs (74, 71, 38, 35, 24 and 11 corresponding to ADH1A, APOD, IGSF10, KIT, RBP4 and SFRP1, respectively) were obtained using TargetScan. The analysis of the resulting Venn diagram revealed 32, 49, 26, 18, 12 and 5 intersecting miRNAs. Verification of expression generated the following 25 miRNAs across the 6 significantly expressed DEGs (Cytoscape software for visualization); hsa-miR-9-5p, hsa-miR-877-5p, hsa-miR-194-5p, hsa-miR-509-3p, hsa-miR-1301-3p, hsa-miR-17-5p, hsa-miR-93-5p, hsa-miR-182-5p, hsa-miR-153-3p, hsa-miR-106b-5p, hsa-miR-330-5p, hsa-miR-20b-5p, hsa-miR-493-5p, hsa-miR-23c, hsa-miR-18a-5p, hsa-miR-148a-3p, hsa-miR-193a-3p, hsa-miR-130b-3p, hsa-miR-148b-3p, hsa-miR-193b-3p, hsa-miR-454-3p, hsa-miR-34a-3p, hsa-miR-185-5p, hsa-miR-27a-3p and hsa-miR-128-3p (Figure 9, Table 2). Analysis of overall survival across the 25 miRNAs revealed that hsa-miR-9-5p (P = 0.0046), hsa-miR-877-5p (P = 0.018), hsa-miR-509-3p (P = 0.01), hsa-miR-1301-3p (P = 0.036), hsa-miR-17-5p (P = 0.02), hsa-miR-93-5p (P = 0.036), hsa-miR-106b-5p (P = 0.00055), hsa-miR-493-5p (P = 0.012), hsa-miR-23c (P = 0.003), hsa-miR-18a-5p (P = 0.00087), hsa-miR-193a-3p (P = 0.012), hsa-miR-130b-3p (P = 0.00024), hsa-miR-148b-3p (P = 0.04), hsa-miR-193b-3p (P = 0.018), hsa-miR-454-3p (P = 0.018), hsa-miR-34a-3p (P = 0.027) and hsa-miR-185-5p (P = 0.0051) were associated with poor prognosis. Conversely, hsa-miR-182-5p (P = 0.035), hsa-miR-153-3p (P = 0.0064), hsa-miR-20b-5p (P = 0.028) and hsa-miR-148a-3p (P = 0.0039) were associated with good prognosis, whereas hsa-miR-194-5p (P = 0.92), hsa-miR-330-5p (P = 0.86), hsa-miR-27a-3p (P = 0.17) and hsa-miR-128-3p (P = 0.78) showed no significant association. Overall, 21 miRNAs were associated with breast cancer prognosis (Figure 10).
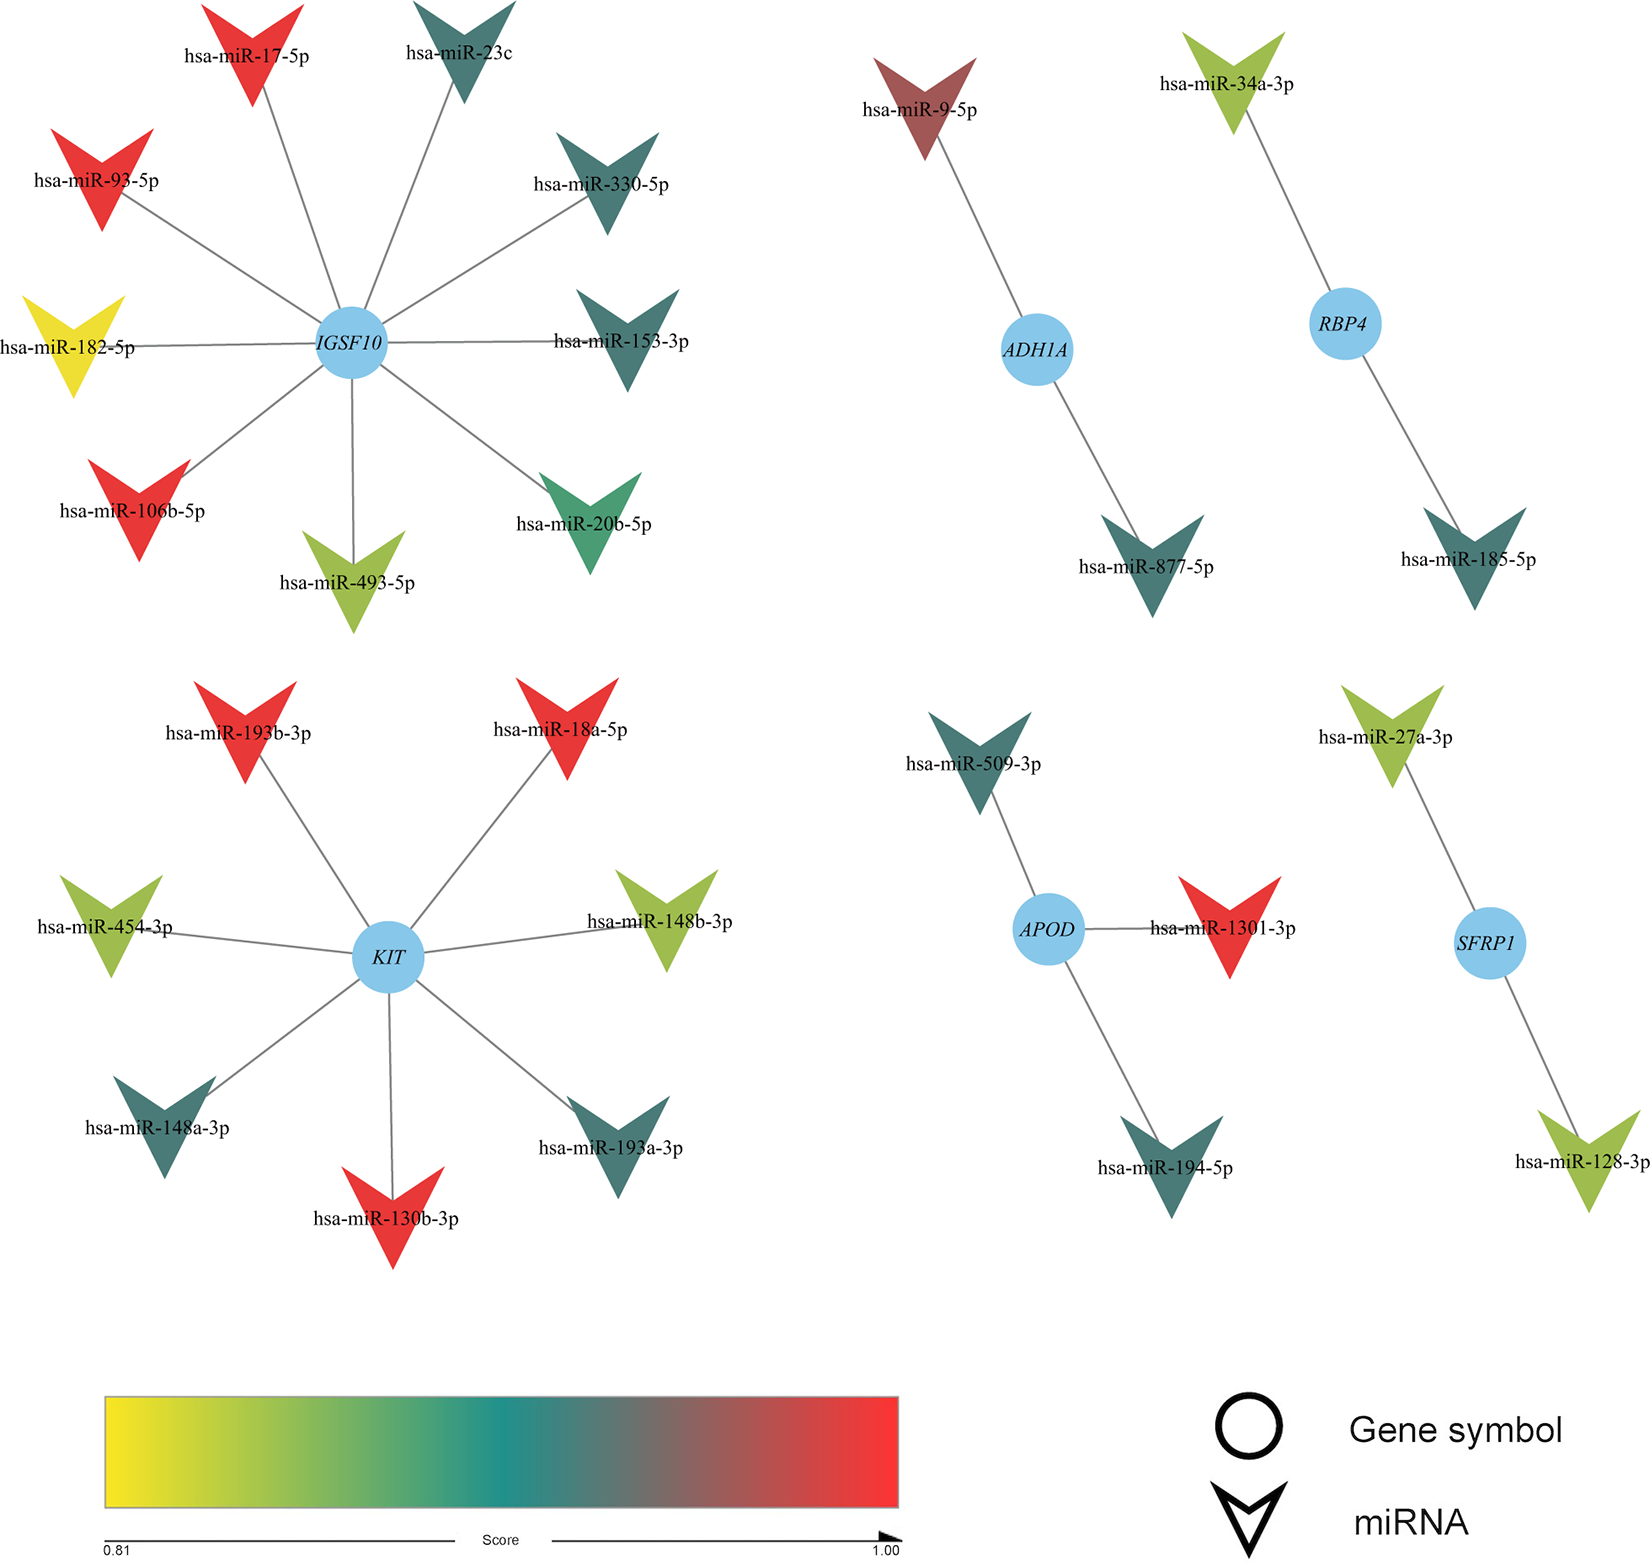
A total of 25 negative correlation pairs of miRNA-mRNA were predicted by miRWalk, targetscan and oncomir online tool. cytoscape software was used to construct the interaction network.
The miRNA Expression Levels of ADH1A, APOD, IGSF10, KIT, RBP4, and SFRP1 Shows Opposite Expression Level or Their Corresponding Target Genes in Breast Cancer Tissue, as Determined by OncomiR (t-test, FDR < 0.05).

miRNA, microRNA.

The prognostic value (overall survival) of the mRNA level of (A) IGSF10, (B) APOD, (C) ADH1A, (D) RBP4, (E) KIT, and (F) SFRP1 in breast cancer patients (Kaplan-Meier plotter).
RT-qPCR Validation of the 2 DEGs in Chinese Breast Cancer Tissues
To further verify the expression of the 2 novel DEGs in breast cancer tissues, we detected their expression in 10 samples of tumor tissues from Chinese breast cancer and 10 samples of adjacent non-tumor tissues. RT-qPCR results of ADH1A (P < 0.01) and IGSF10 (P < 0.01) expression in Chinese breast cancer tissues were consistent with the database analysis and showed significant down-regulation. (Figure 11).

RT-qPCR validation of 2 DEGs in Chinese breast cancer tissues. (A) expression level of ADH1A gene, (B) expression level of IGSF10 gene. ∗∗P < 0.01.
Discussion
Analysis of the 3 datasets from the GEO database revealed a total of 46 overlapping DEGs, out of which 5 and 41 were up-and downregulated, respectively. GO enrichment and KEGG pathway analysis of the DEGs further revealed the top 10 geneSets in BP, MF, and CC. Previous studies have described the importance of PPAR signaling pathway-related genes as predictors of neoadjuvant chemotherapy response and in early diagnosis of breast cancer. 15,16 Particularly, oncogenic tyrosine kinase has been implicated in the induction of multiple types of cancer, including hematological malignancies, breast, prostate, colon, and lung cancer, as well as breast and pancreatic cancer progression. 17,18 This signaling pathway may therefore be considered an important mechanism for breast cancer development. Numerous animal studies have reported that several common environmental chemicals are mammary glands carcinogens. These chemicals have also been shown to activate related hormone response pathways and enhance the sensitivity of the mammary glands to carcinogenesis. 19 AMPK is closely associated with the tumor-suppressive functions of LKB1 and P53, where it regulates cell survival signals, such as mTOR and Akt, leading to cell growth inhibition and cell cycle arrest. Besides, it participates in tumor drug resistance. 20 CYP2E1, on the other hand, is involved in the progression and metastasis of advanced breast cancer, 21 whereas JAK/STAT3-regulated fatty acid β-oxidation is essential for self-renewal and drug resistance in breast cancer stem cells. 22 The GO enrichment and KEGG pathway analysis results were consistent with findings from previous studies.
The present results indicated that ADH1A, APOD, IGSF10, KIT, RBP4, and SFRP1 were the most significantly expressed DEGs, and their expression levels were found to be consistent with microarray data from the GEO database. Besides, these DEGs showed an association with breast cancer patient prognosis. The expression levels of ADH1A, APOD, and KIT were significantly different across different tumor stages, whereas Oncomine and HPA indicated that the 6 DEGs exhibited significantly lower expression in breast cancer patients, compared to normal subjects. Moreover, Kaplan Meier plotter results revealed a positive correlation between the DEGs and breast cancer patient prognosis.
Previous studies have shown that alcohol dehydrogenase 1A (ADH1A) is positively correlated with the prognosis of hepatocellular carcinoma, as well as gastric and pancreatic cancer, confirming its potential as a biomarker. 23 -25 Besides, ADH1A participates in the occurrence and development of breast cancer via lipid metabolism and the PPAR pathway, 26 which is consistent with the results of our previous study, where PPAR signaling pathway and fatty acid degradation were identified using KEGG pathway analysis. In the present study, ADH1A was found to be a prognostic biomarker for breast cancer and has further been associated with tumor stage. APOD is a lipocalin that participates in various cellular processes, including cytoprotection, and is a biomarker positively correlated with the prognosis of breast and prostate cancer. 27 -29 IGSF10 is the 10th member of the immunoglobulin superfamily and a biomarker positively correlated with the prognosis of lung cancer. Knocking out IGSF10 is reported to activate the integrin β1/FAK pathway, thereby affecting proliferation and adhesion in lung cancer cells. 30 These findings confirmed, for the first time, that IGSF10 is positively correlated with breast cancer prognosis; and the underlying pathogenesis mechanism has been hypothesized to be the activation of the integrin β1/FAK pathway with decreased expression of IGSF10.
The present findings revealed downregulation of retinol-binding protein 4 (RBP4) and a positive association between this downregulation and breast cancer prognosis. Previous studies have implicated increased RBP4 levels with breast cancer risk. 31 Particularly, metastatic breast cancer patients exhibit higher RBP4 levels compared with healthy patients and non-metastatic breast cancer patients. 32 This indicates that RBP4 is a biomarker for poor prognosis, although other studies have reported an association between low expression levels and breast cancer occurrence. 16 Therefore, the association between the expression level and pathogenesis of RBP4 in breast cancer remains unclear, necessitating further research. Functionally, RBP4 participates in the pathogenesis of breast cancer through other molecules during lipid metabolism. KIT, a Receptor Tyrosine Kinase absent in 75% of breast-invasive ductal carcinoma, has previously been associated with lymph node metastasis. 33 Various tyrosine kinases, including KIT, FLT3, colony-stimulating factor 1 (CSF-1), and RET have been implicated in several malignant tumors, such as small cell lung cancer, gastrointestinal stromal tumor, breast cancer, and acute myeloid leukemia. 34 These studies indicate that a low KIT expression is associated with poor breast cancer prognosis.
The results of the present study revealed a low expression of SFRP1 in breast cancer patients and were positively correlated with the disease prognosis. However, previous studies have shown that SFRP1 is significantly overexpressed in triple-negative breast cancer, compared with other breast cancer subtypes, and its knockdown results in increased resistance to the standard chemotherapy for breast cancer. 35 These results indicate that breast cancer is a highly heterogeneous disease, and the same gene may exhibit different expression profiles across various subtypes. Therefore, individualized treatment is particularly important. miRNAs are a type of 18-25-nucleotide-long non-coding RNAs, which play crucial roles in human cancer. In the present study, miRWalk and TargetScan were used to predict corresponding miRNAs for the significantly expressed DEGs. Their expression levels were verified using OncomiR and their prognostic values were further predicted by Kaplan Meier plotter. Overall, 21 miRNAs associated with breast cancer prognosis were predicted, with 17 and 4 found to be negatively and positively associated with breast cancer prognosis, respectively.
Among these miRNAs, hsa-miR-9-5p, hsa-miR-18a-5p, 36 hsa-miR-17-5p, 37 hsa-miR-106b-5p, 38 hsa-miR-454-3p, 39 hsa-miR-182-5p 40 and hsa-miR-153-3p 41 have previously been implicated in breast cancer prognosis, whereas hsa-miR-877-5p has been associated with the pathogenesis and treatment of hepatocellular carcinoma. 42 On the other hand, hsa-miR-509-3p is associated with the prognosis of colorectal cancer 43 and hsa-miR-1301-3p with the recurrence of prostate cancer following radical prostatectomy. 44 hsa-miR-493-5p has been reported in adenovirus-infected children with a clear difference between infected and healthy people, 45 and hsa-miR-23c has been implicated in the migration and invasion of non-small cell lung cancer cells. 46 hsa-miR-193a-3p and hsa-miR-193b-3p are associated with precancerous lesions of gastric cancer, 47,48 and hsa-miR-130b-3p is involved in the occurrence and development of prostate and liver cancer, and in metastatic adrenocortical carcinoma. 49 -51 Moreover, studies have shown that hsa-miR-148a-3p and hsa-miR-148b-3p are downregulated and enriched in gastric cancer-related pathways, 52 whereas hsa-miR-34a-3p is associated with metastatic conjunctival melanoma. 53 A defect in hsa-miR-185-5p is associated with the late-stage and low overall survival rates of bladder cancer, 54 whereas hsa-miR-20b-5p has been implicated in the prognosis of colorectal cancer. 55 Finally, hsa-miR-148a-3p has been linked to drug resistance and the invasiveness of esophageal squamous cell carcinoma. Although these studies describe the association between miRNAs with the pathogenesis and prognosis of other cancer types, their expression levels and roles in breast cancer remain unknown. However, the present results revealed that the 14 miRNAs were highly expressed in breast cancer patients and further associated with the prognosis of the disease. These miRNAs may provide new targets for the development of breast cancer treatment.
We further validated the expression of the 2 novel DEGs in Chinese breast cancer tissues. Our results indicated that the expression of ADH1A and IGSF10 in Chinese breast cancer tissues was consistent with the database analysis and showed significant down-regulation.
The present study has some limitations. First, although new biomarkers associated with breast cancer are predicted, their mechanism of action remains unclear, necessitating further research. Secondly, the results need validation through experimental studies.
Conclusions
In the present study, 46 candidate DEGs are identified and their BP, MF and CC revealed. Further analysis of these genes reveals 6 significant DEGs that are downregulated in breast cancer patients, including 2 novel biomarkers (ADH1A and IGSF10), and 4 other genes (APOD, KIT, RBP4 and SFRP1) that are associated with the prognosis and potential pathogenesis of breast cancer. Besides, 25 miRNAs are predicted in the 6 genes, with 14 of these associated with breast cancer prognosis for the first time. Overall, the DEGs and miRNAs identified herein represent new biomarkers for the prediction, diagnosis and development of individualized prevention, treatment and prognosis approaches for breast cancer patients.
Supplemental Material
Supplemental Material, sj-pdf-1-tct-10.1177_1533033821992081 - Identification of Novel Biomarkers Associated With the Prognosis and Potential Pathogenesis of Breast Cancer via Integrated Bioinformatics Analysis
Supplemental Material, sj-pdf-1-tct-10.1177_1533033821992081 for Identification of Novel Biomarkers Associated With the Prognosis and Potential Pathogenesis of Breast Cancer via Integrated Bioinformatics Analysis by Meng Wu, Qingdai Li and Hongbing Wang in Technology in Cancer Research & Treatment
Supplemental Material
Supplemental Material, sj-pdf-2-tct-10.1177_1533033821992081 - Identification of Novel Biomarkers Associated With the Prognosis and Potential Pathogenesis of Breast Cancer via Integrated Bioinformatics Analysis
Supplemental Material, sj-pdf-2-tct-10.1177_1533033821992081 for Identification of Novel Biomarkers Associated With the Prognosis and Potential Pathogenesis of Breast Cancer via Integrated Bioinformatics Analysis by Meng Wu, Qingdai Li and Hongbing Wang in Technology in Cancer Research & Treatment
Supplemental Material
Supplemental Material, sj-pdf-3-tct-10.1177_1533033821992081 - Identification of Novel Biomarkers Associated With the Prognosis and Potential Pathogenesis of Breast Cancer via Integrated Bioinformatics Analysis
Supplemental Material, sj-pdf-3-tct-10.1177_1533033821992081 for Identification of Novel Biomarkers Associated With the Prognosis and Potential Pathogenesis of Breast Cancer via Integrated Bioinformatics Analysis by Meng Wu, Qingdai Li and Hongbing Wang in Technology in Cancer Research & Treatment
Footnotes
Abbreviations
Ethics Approval and Consent to Participate
This study was carried out in accordance with the guidelines of the Ethics Committee of the Affiliated Hospital of Xuzhou Medical University, with written informed consent from all subjects. All subjects gave written informed consent in accordance with the World Medical Association Declaration of Helsinki. The protocol was approved by the Affiliated Hospital of Xuzhou Medical University (Approval number: XYFY2019-KL095).
Declaration of Conflicting Interests
The author(s) declared no potential conflicts of interest with respect to the research, authorship, and/or publication of this article.
Funding
The author(s) received no financial support for the research, authorship, and/or publication of this article.
Supplemental Material
Supplemental material for this article is available online.
References
Supplementary Material
Please find the following supplemental material available below.
For Open Access articles published under a Creative Commons License, all supplemental material carries the same license as the article it is associated with.
For non-Open Access articles published, all supplemental material carries a non-exclusive license, and permission requests for re-use of supplemental material or any part of supplemental material shall be sent directly to the copyright owner as specified in the copyright notice associated with the article.