
Abstract
RNA-sequencing data and relevant clinical data in The Cancer Genome Atlas for 502 samples of papillary thyroid cancer (PTC) were analyzed to determine the prognostic value of soluble carrier family genes in PTC. We analyzed soluble carrier family gene expression and function in the samples. Clustering identified 2 clusters in the data. Risk characteristics were identified using LASSO and Univariate Cox regression analysis, which divided the patients into low and high-risk groups. The expression levels of 88 soluble carrier genes were significantly different between tumors and normal tissue. The 2 PTC clusters had different clinical outcomes and distributions of gene expression. The expression levels of SFXN1, SLC12A4, SLC35A1, SLC35E1, and SLCO1C1 were markedly different between the 2 groups. The high risk and low risk groups had significant different prognoses (P < 0.05). Significant differences were identified for disease free survival (DFS), sex and T stage between the 2 subgroups. The risk score was identified as an independent prognostic variable (P < 0.05) and as a predictor of clinicopathological variables. In patients with PTC, solute carrier gene expression showed differential associations with clinicopathological variables. The 5 genes could be used as prognostic factors for PTC, particularly to predict PTC recurrence.
Introduction
Thyroid carcinoma is the most common endocrine malignancy. The incidence of papillary thyroid cancer (PTC) has increased markedly worldwide in recent decades. In the United States, from 1975 to 2009, the annual incidence of thyroid cancer increased by nearly 3 times from 4.9 to 14.3 per 100 000 individuals. 1 PTC is the most common pathological type of all thyroid cancers, accounting for 80%-85% of patients with thyroid cancer. 1,2 Although most patients with PTC have a good prognosis, in general, mortality rates increase every year, especially for patients with advanced PTC who have local persistent disease, recurrent disease, distant metastases, or all three. 3,4
After appropriate treatment, 10%-20% of patients experience recurrence. A number of patients who experience recurrence eventually succumb to cancer. Recurrent disease usually requires repeated surgery, additional radioactive iodine (RAI), and more in-depth long-term surveillance. Patients with recurrence have poor prognosis and suffer higher postoperative complications and psychosocial stress. 5 Predicting the recurrence of PTC with high accuracy is critical for successful clinical management and personalized treatment. The risk stratification system from the American Thyroid Association (ATA) classifies and stages risk on the basis of the patients’ clinicopathological characteristics. It is difficult to estimate the specific recurrence risk of individual patients. Several models have been established to predict the recurrence of PTC using various clinicopathological features. 6 These models might ignore differences in tumor biology. In recent years, although some studies established PTC recurrence risk stratification models using genetic characteristics, some models experienced an over-fitting phenomenon, such that they could perform stratification efficiently for patients with stage I and II disease, but not for patients with stage III and IV disease. 7 Therefore, it is necessary to develop better and more accurate methods to predict the recurrence of PTC. 8
Solute carriers (SLCs) are a major family of membrane transporters, responsible for transporting toxins, drugs, hormones, neurotransmitters, and nutrients across cell membranes. The current version of the human genome contains more than 400 SLC genes. 9 However, the SLC transporter superfamily is less studied. In cancer, the expression pattern of SLC transporters undergoes tremendous changes, even greater than that of protein kinases. Overexpression of oncogenes and loss of tumor suppressors are related to changes in the expression of SLC transporters, especially in important metabolic process such as glutamine and amino acid metabolism. Accumulating evidence demonstrates that abnormal soluble carrier family gene expression is closely linked to many human diseases, including cancer. SLC family gene expression is associated with mortality in acute myeloid leukemia (AML). 10 Soluble carrier family expression is also associated with the prediction of poor outcome in renal cell carcinoma. 11 Fourteen SLC family 39 genes are potential prognostic biomarkers in patients with gastric cancer (GC), and may offer effective new strategies for GC therapy. 12 However, the soluble carrier family genes have not been well researched for their associations with PTC.
In the present study, we aimed to analyze the associations between the prognosis of a PTC cohort from The Cancer Genome Atlas (TCGA) and SLC expression. Consensus clustering analysis based on soluble carrier family gene expression patterns identified 2 PTC clusters that had different clinical outcomes. We then constructed a gene risk signature using the PTC cohort from the TCGA, which showed good performance to predict prognosis.
Results
Differentially Expressed Soluble Carrier Family Genes Between Tumor Groups and Normal Control Groups
We first compared the expression level of 450 soluble carrier family genes between normal groups and PTC groups in the TCGA dataset. Using the criteria of P < 0.05 and [log2 (fold change)] > 1, compared with their levels in the normal controls, the expression levels of 47 genes were markedly upregulated and 41 genes were markedly downregulated in the tumor samples (Figure 1).

The expression levels of soluble carrier family genes between the normal control and tumor groups the PTC cohort from the TCGA.
Functional Enrichment Analysis of Differentially Expressed SLC Genes
To gain an insight into the biological functions of the 88 differentially expressed SLC genes functional enrichment analysis was performed. Figure 2 summarizes the top 30 enriched gene ontology (GO) terms and 14 enriched pathways. GO enrichment shows that biological processes mainly identified differences in sulfate transport, oxalate transport, ammonium transport, amino acid import, organic cation transport, and sodium-independent organic anion transport. For molecular function (MF), transporter activity was enriched. Kyoto Encyclopedia of Genes and Genomes (KEGG) enrichment analysis identified pathways mainly related to differences in Vitamin digestion and absorption, Bile secretion, Protein digestion and absorption, and extracellular matrix (ECM)-receptor interaction (Figure 2).

Analysis of differentially expressed SLC genes’ functional enrichment. A, Biological processes and molecular functions as analyzed using GO. B, KEGG analysis of signaling pathways.
Consensus Clustering of Soluble Carrier Family Genes Revealed 2 Clusters of Patients With PTC That Had Different Clinical Outcomes
The cohort of patients with PTC was divided into 2 clusters (cluster 1 and cluster 2) on the basis of the similarity in their soluble carrier family genes expression, in which k = 2 was revealed as the most appropriated selection criterion (Figure 3A-C). We analyze these 2 sub-classes using principle component analysis (PCA), which showed that cluster 1 was clustered together and cluster 2 could also be clustered together, indicating that the classification was correct (Figure 3D). Patients with PTC in cluster 2 had a significant shorter disease-free survival (DFS) compared with those in cluster 1 (P = 0.009) (Figure 3E). We next evaluated the associations between the patients’ clinicopathological features and clustering. Cluster 1 and cluster 2 showed significant differences in stage (P < 0.05), T stage (P < 0.01), and N stage (P < 0.001), while no obvious differences were found for other parameters, such as age and sex.
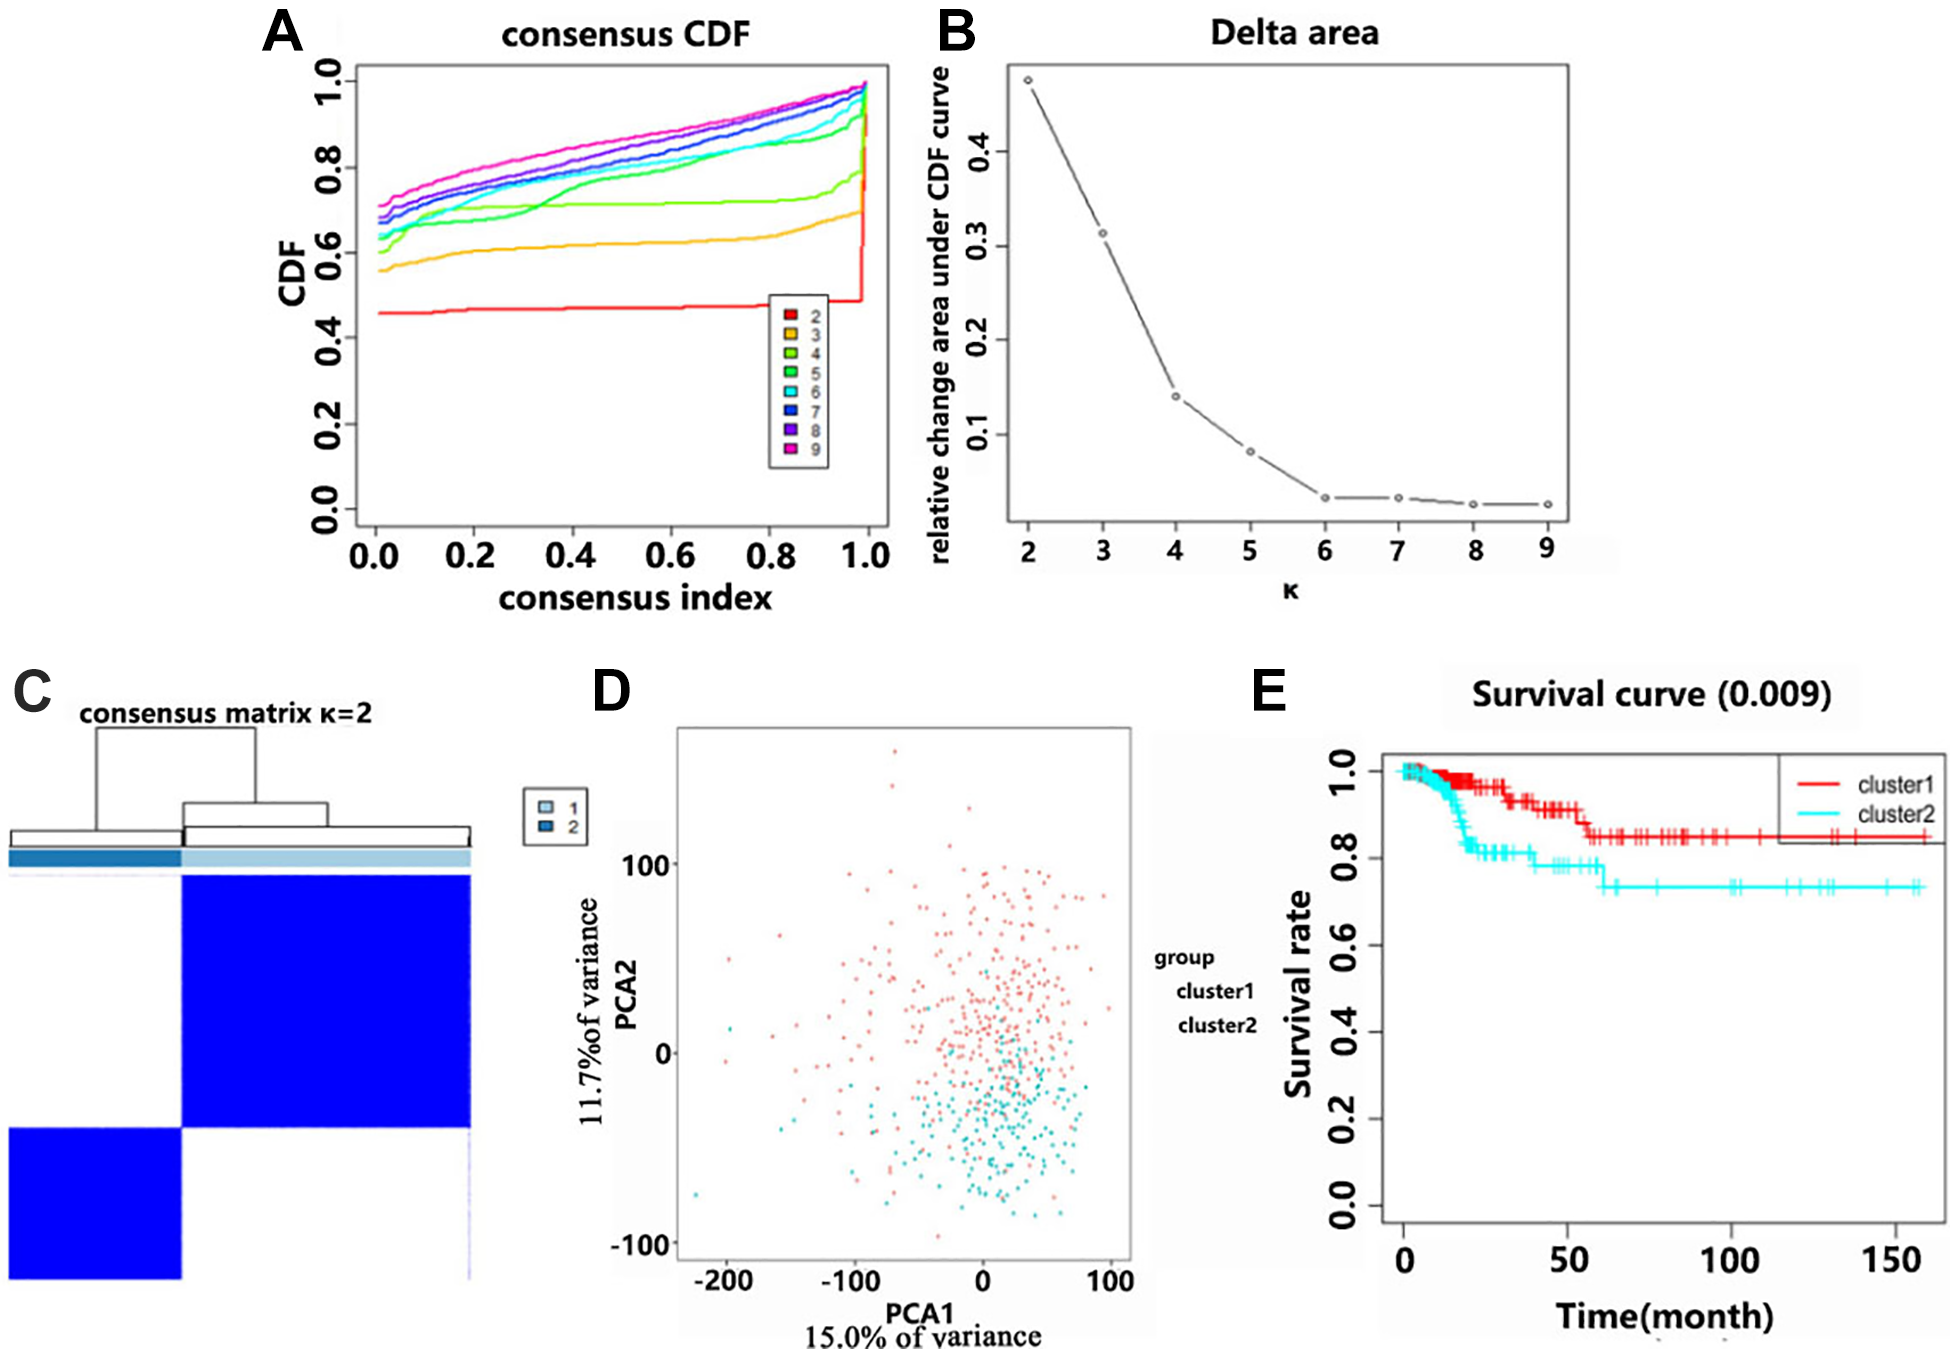
Analysis of disease-free survival (DFS) of 2 different clusters of patients with PTC in the TCGA data. A, Consensus clustering using the cumulative distribution function (CDF) for values of k from 2 to 9. B, Relative change in area under the CDF curve for values of k from 2 to 9. C, When k = 2, the TCGA cohort of patients with PTC could be divided into 2 distinct clusters. D, The TCGA data was subjected to PCA of the total RNA expression profile. Red indicates the data from the cluster 1 subgroup, and blue indicates the data from the cluster 2 subgroup. E, The DFS for patients with cluster 1 was significantly longer than that for patients in cluster 2.
Determination of the Prognostic Signature
To identify those soluble carrier family genes that were associated with DFS in the PTC cohort from the TCGA, we used univariate Cox regression. This analysis identified 5 genes (SFXN1, SLC12A4, SLC35A1, SLC35E1, and SLCO1C1) that were significantly correlated with DFS (P < 0.01). SLC12A4, SLC35A1, and SLCO1C1 were protective genes, with hazard ratios (HRs) less than 1. SFXN1 and SLC35E1 were high risk genes, with HRs larger than 1 (Table 1). The interactions among the 5 genes are shown in Figure 4A. Only SLC35E1 was associated with SFXN1 and SLC35A1. These 5 genes were selected to build a prognostic signature and the LASSO algorithm was used to obtain coefficients (Figure 4B and C). The formula used to calculate each patient’s risk score was: risk score = SFXN1*0.275 + SLC12A4*(−0.140) + SLC35A1*(−0.088) + SLC35E1*(0.115) + SLCO1C1*(−1.404). Using the risk score, 208 and 208 patients with PTC were divided into the high-risk and low-risk groups, respectively. According to survival analysis, the DFS of the low-risk group was significantly longer than that of the high-risk group (P = 8.27e−06) (Figure 4D). The underlying product (AUC) value of the subject operating characteristic curve predicting 3-year disease-free survival was 0.824 and the area under the subject operating characteristic curve predicting 5-year disease-free survival was 0.826 (Figure 4E). The expression levels of the 5 genes in the high-risk and low-risk groups differed significantly according to sex (P < 0.05) and T stage (P < 0.05) (Figure 4F).
The Process of Building the Signature Containing SLC Family Genes.a

a Univariate Cox regression analysis was used to determine the hazard ratio (HR) and 95% confidence interval (CI).

A, The correlations among these 5 genes were determined using Pearson correlation analysis. B and C. Multivariate Cox regression performed using LASSO was used to calculate the coefficients. D, Compared with that in the low-risk group, the DFS in the high-risk group was remarkably shorter. E, The prognostic signature’s predictive efficiency was evaluated using a ROC curve. F, The high-risk and low-risk groups showed significant differences for sex and T stage.
The Risk Score Based on the Gene Signature Is an Independent Recurrence Factor in the PTC Cohort From the TCGA
To ascertain whether the risk gene signature comprises an independent prognostic indicator for PTC recurrence and gain a deeper understanding of the relationships between risk scores and patients with PTC, univariate and multivariate Cox regression analyses were performed in the TCGA dataset. After deleting cases with some missing values, 345 cases were subjected to subsequent analysis. Univariate analysis showed that the stage (P < 0.05, HR = 1.459, 95% CI = 1.028-2.075), N stage (P < 0.001, HR = 3.813, 95% CI = 1.422-10.223), and risk score (P < 0.001, HR = 1.998, 95% CI = 1.538-2.596) correlated significantly with the DFS (Figure 5A). Further multivariate regression analysis of these parameters identified N stage (P < 0.05, HR = 3.754, 95% CI = 1.259-11.189) and risk score (P < 0.001, HR = 2.271, 95% CI = 1.533-3.364) as independent prognostic factors (Figure 5B).

Independent prognostic factors for patients with PTC in the TCGA cohort. A, Significant DFS-correlated factors identified using univariate analysis of risk scores and clinicopathological parameters. B, Independent prognostic variables identified using multivariate analysis of risk scores and clinicopathological parameters.
The Recurrence Risk Score Is Closely Related to the Clinicopathological Characteristics of PTC
To determine if the risk gene signature adds clinical prognostic value, we grouped the patients according to their clinicopathological variables: age, sex, extrathyroidal extension (ETE), histological type, and stage. As shown in Figure 6, the high-risk group had a markedly shorter DFS than the low-risk group for those cases at stage 1-2 (P = 0.00296), those at stage 3-4 (P = 0.00443), female cases (P = 0.0021), male cases (P = 0.00036), age ≥ 55 (P = 0.0222), or age < 55 (P = 0.00069), ETE cases (P = 0.00163), no ETE cases (P = 0.00270), N1 stage (P = 0.000555), T1-2 stage (P = 0.0181), T3-4 stage (P = 0.000193), or classical cases (P = 0.0038). However, no significant difference was found for DFS between high- and low-risk groups for patients with PTC with N0 stage disease (P = 0.0868), M0 stage disease (P = 0.0569), Follicular type disease (P = 0.1897), or Tall Cell type disease (P = 0.505).

Stratification of the differences in survival between the high- and low-risk groups using the clinicopathological parameters of the PTC cohort from the TCGA. Stratification of the difference in DFS between the high- and low-risk groups by PTC stage (A, B), sex (C, D), age (E, F), ETE (G, H), N stage (I, J), T stage (K, L), M0 stage (M), and histological type (N, O, P).
The relationships between these 5 genes and the clinicopathological variables of PTC were determined to investigate the clinical significance of their expression levels. The expression levels of SLC12A4 (P = 0.041) and SLC35A1 (P = 0.031) correlated significantly with ETE (Figure 7A and B). Compared with that in non-ETE cases, SLC35E1 expression was upregulated in ETE cases (P = 0.083), and SLC12A4 expression showed the opposite trend (Figure 7A and C). SFXN1 expression correlated significantly with age (P = 0.019, Figure 7D) and SLC35A1 expression correlated significantly with sex (Figure 7E). As the T stage increased, the expression of SLC12A4 decreased (Figure 7F). Considering that these genes are clinically important, we assessed their genetic variation, and found that mRNA upregulation was the most common type of mutation (Supplementary Figure 1). Four of the genes showed a mutation rate ≥ 5%. The most frequently mutated genes were SFXN1 and SLC35E1 (6%).

Relationship between the clinicopathological variables of PTC and the 5 genes. A-C, Relationship between ETE and 3 genes. D, Relationship between SFXN1 and age. E, Relationship between SLC35A1 and sex. F, Relationship between SLC12A4 and T stage.
We further tested these 5 genes expression in the 57 clinical PTC samples. Except for SLCO1C1, the expressions of SFXN1, SLC12A4, SLC35A1 and SLC35E1 in PTC tissues were significantly lower than those in para-cancerous tissues (P < 0.05) (Figure 8).

The relative expression levels of the 5 genes in PTC tissues and adjacent non-cancerous tissues (n = 57).
Pan-Cancer Analysis of Recurrence Risk Score
In order to investigate the clinical relevance of the prognostic risk model beyond PTC, we conducted a series of studies on all TCGA cancers including Thymoma (THYM), Testicular Cancer (TGCT), Stomach Cancer (STAD), Sarcoma (SARC), Prostate Cancer (PRAD), Pancreatic Cancer (PAAD), Ovarian Cancer (OV), Ocular melanomas (UVM), Melanoma (SKCM), Lung Squamous Cell Carcinoma (LUSC), Lung Adenocarcinoma (LUAD), Lower Grade Glioma (LGG), Liver Cancer (LIHC), Large B-cell Lymphoma (DLBC), Kidney Papillary Cell Carcinoma (KIRP), Cervical Cancer (CESC), Bile Duct Cancer (CHOL), Colon Cancer (COAD), Kidney Clear Cell Carcinoma (KIRC), Kidney Chromophobe (KICH), Endometrioid Cancer (UCEC), Adrenocortical Cancer (ACC), Bladder Cancer (BLCA), Breast Cancer (BRCA), Esophageal Cancer (ESCA), Glioblastoma (GBM), Head and Neck Cancer (HNSC). We analyzed the predictive efficiency of risk score on 3-year, 5-year and 10-year DFS in 27 types of tumors, as shown in Figure 9. The results showed that riskscore’s AUC was significantly different in different types of cancer. Among the 27 types of cancer tested, the ROC curve showed good predictive ability or inverse predictive ability in 15 types of cancer (AUC > 0.6 or AUC < 0.3) (Figure 9). In BLCA, CHOL and PAAD, risk score has inverse predictive ability. The Kaplan-Meier survival curve showed that an increase in riskscore was associated with shorter DFS in ThYM and KIRP (P < 0.05) (Figure 10).
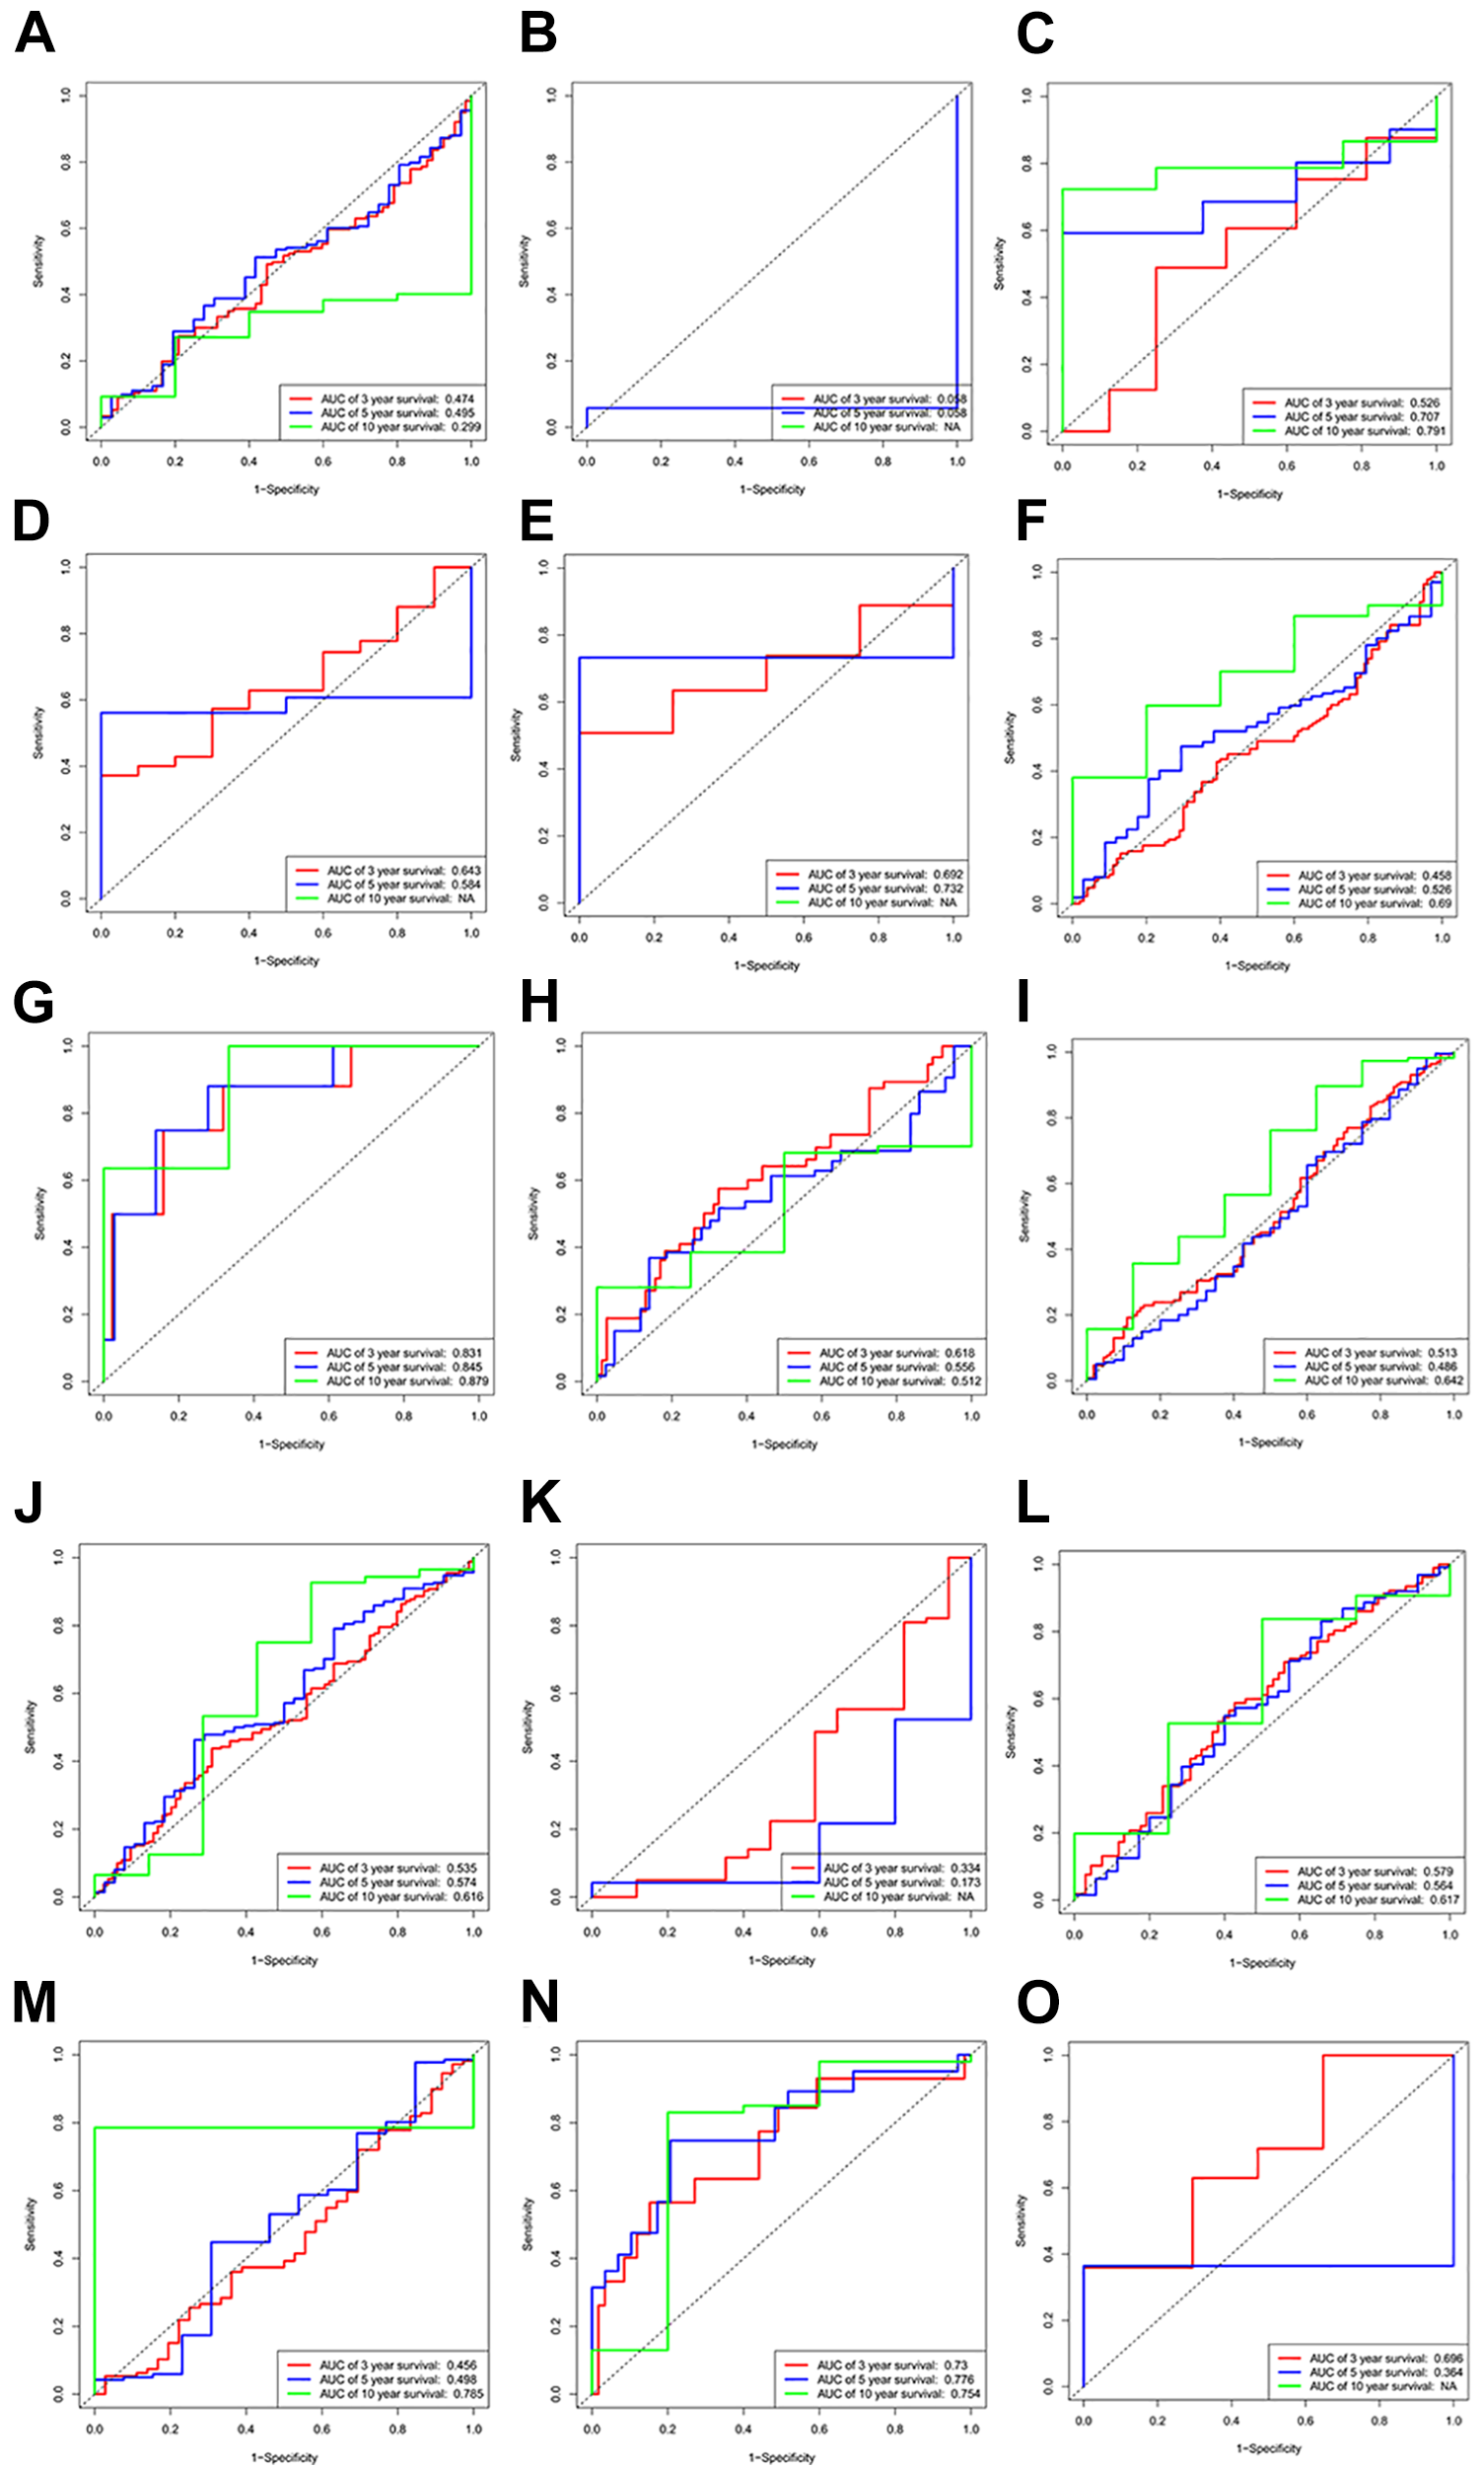
ROC curves were used to evaluate the predictive efficiency of prognostic features. A, Evaluate the predictive efficiency of risk scoring on BLCA using ROC curves. B, Evaluate the predictive efficiency of risk score on CHOL using ROC curves. C, Evaluate the predictive efficiency of risk scoring on DLBC using ROC curves. D, Evaluate the predictive efficiency of risk scoring on ESCA using ROC curves. E, Evaluate the predictive efficiency of risk scoring on GBM using ROC curves. F, Evaluate the predictive efficiency of risk scoring on HNSC using ROC curves. G, Evaluate the predictive efficiency of risk scoring on KICH using ROC curves. H, Evaluate the predictive efficiency of risk scoring on KIRP using ROC curves. I, Evaluate the predictive efficiency of risk scoring for IGG using ROC curves. J, Evaluate the predictive efficiency of risk scoring on LUAD using ROC curves. K, Evaluate the predictive efficiency of risk score on PAAD using ROC curves. L, Evaluate the predictive efficiency of risk scoring on SARC using ROC curves. M, Evaluate the predictive efficiency of risk scoring on STAD using ROC curves. N, Evaluate the predictive efficiency of risk score on THYM using ROC curves. O, Evaluate the predictive efficiency of risk scoring on UVM using ROC curves.

DFS was significantly shorter in the high-risk group compared with the low-risk group (A, B).
Discussion
Thyroid carcinoma is the most common endocrine malignancy in the word. Surgery is the preferred treatment for PTC. Although PTC usually has a good prognosis, some patients relapse after treatment.
In recent years, many different gene signatures have been used to predicted recurrence in a variety of cancers. For example, N6-methyladenosine RNA methylation regulators have value for recurrence prognosis in clear cell renal cell carcinoma. 13 There is also a reliable, individualized immune gene set-based signature to predict recurrence in early-stage lung adenocarcinoma, obtained using a least absolute shrinkage and selection operator model. 14 In addition, a 12-Chemokine signature was developed as a predictor of tumor recurrence in colorectal cancer. 15
The SLC gene superfamily encode transporter proteins. Transporters control the absorption and excretion of key compounds. Transporters are characterized by hydrophobicity and low relative abundance. 16 SLC genes have been implicated in cancer initiation and metabolic disease. 13,17 SLC transporter genes are pathogenic in cancers such as renal cell carcinoma, esophageal cancer, and liver cancer. 18
Many molecular markers of gene expression levels have been discovered that have potential value to predict PTC recurrence. For example, telomerase reverse transcriptase (TERT) promoter mutations were associated with recurrence. 19 Higher expression levels of GADD45B (encoding growth arrest and DNA damage inducible beta), using median expression as the threshold, was identified as being related to shorter DFS. 20 The expression of SYT12 (encoding synaptotagmin 12) predicted the presence or absence of disease during follow-up. 21 However, these markers were investigated individually and were not analyzed in combination as a signature. Previously, a 25-gene signature was identified an independent factor in predicting DFS in PTC 22 ; however, we considered that 25 genes are too many to analyze conveniently.
The results of the present study demonstrated that the prognosis of patients with PTC is associated with the expression of SLC family member genes. The study surveyed 450 SLC members, divided into 65 families. We showed that the expression of soluble carrier family genes in PTC was significantly altered in tumor tissues compared with that in normal tissues, suggesting that SLC family genes play an important role in PTC. GO pathways analysis suggested that the differentially expressed SLC genes regulate the occurrence and development of PTC by controlling transport and transporter activity.
Our results showed that patients with PTC from the TCGA could be divided into 2 subgroups with significantly different DFS durations, based on the expression pattern of the 450 SLC members. Univariate Cox analysis and LASSO Cox regression analysis of the TCGA data allowed us to construct a robust risk signature including 5 genes (SFXN1, SLC12A4, SLC35A1, SLC35E1, and SLCO1C1), which showed good performance for predicting the recurrence of PTC. Three of these genes have been reported in tumor research. SLC12A4, also referred to as K+-Cl− cotransporter 1 (KCC1), comprises a membrane protein that facilitates the co-transport of K+ and Cl-ions through the cell membrane. SLC12A4 expression correlated positively with increased survival in renal cell carcinoma and was suspected to contribute to the growth and aggressiveness of cervical cancer and endometrial adenocarcinoma. 23 Aberrations in SFXN1 (encoding tricarboxylate carrier protein) are associated with decreased survival in diffuse infiltrating gliomas. 24 SLC35E1 can predict the response of rectal carcinomas to neoadjuvant chemoradiotherapy. 25 SLCO1C1 and SLC35A1 have not been reported previously as being associated with cancer. SLCO1C1, as a specific thyroid hormone transporter, might play an important role in PTC. This was the first study to show that they could be used as prognostic markers for PTC.
Whether this five-gene signature has prognostic value for PTC recurrence is of great significance. Univariate analyses showed that DFS was associated with stage, N stage, and risk score. Multivariate analyses showed that DFS was associated significantly with N stage and risk score. Further confirmation was made by grouping the patients’ clinicopathological variables, which demonstrated that the risk signature could distinguish the DFS outcomes of patients with stage 1-2 disease, stage 3-4 disease, female cases, male cases, age ≥ 55, age <55, ETE, no ETE, stage N1, stage T1-2 stage T3-4, or classical cases. We also found that the expression of the 5 genes were differentially associated with different clinicopathological variables. Low SLC12A4 expression was associated with ETE and high stage T. The expression of SLC35A1 correlated negatively with female sex and ETE. The above results suggested that SLC12A4 and SLC35A1 are protective genes. High SLC35E1 expression was associated with ETE and high expression of SFXN1 correlated positively with older age. The above results suggested that SFXN1 and SLC35E1 are non-protective genes. Finally, risk scores show good prognostic value for a variety of cancers based on pan-cancer analysis. The prediction ability of risk score is verified from the side part. But there are still some limitations in this study. The main problem is we obtained only one prognostic cohort. Another independent cohort is required in the next study to further confirm the accuracy of the model.
Conclusion
We revealed the dramatically altered expression of soluble carrier family genes between PTC and normal controls, which might play a key role in the DFS of PTC. More importantly, a robust prognostic signature that correlated significantly with recurrence of PTC was constructed. This prognostic signature might serve as promising molecular biomarker to monitor PTC development and provide important guidance for selecting therapeutic strategies.
Methods
Source of Public Data
The RNA sequencing (RNA-seq) data and clinical information for the PTC samples, as well as the RNA-seq data of normal control samples, were obtained by downloading them from The National Cancer Institute Genomic Data Commons (GDC) (https://gdc.cancer.gov/). RNA-seq provides data fragments per kilobase million (FPKM) values. PTC cases (n = 502) and normal control samples (n = 58) were carried forward for subsequent analyses.
Data Preprocessing and Analysis of Differential Expressed Soluble Carrier Family Genes
Differentially expressed genes between PTC samples and normal control samples were screened using the Limma package. 26 We analyzed 450 SLC genes in the study, whose detailed annotations were reviewed in the website of bioparadigms (http://slc.bioparadigms.org).
Functional Analysis
For the functional enrichment of differentially expressed SLC genes, the Bohao Online Enrichment Tool (http://enrich.shbio.com/) was used. To assess the relevant functional categories, GO and KEGG analyses were used, in which categories with P and q values less than 0.05 were considered significant.
Consensus Clustering Analysis
To determine whether prognosis was associated with the expression levels of SLC family genes, data for the PTC data from the TCGA was clustered into different groups based on the consensus expression of SLC family genes using “ConsensusClusterPlus” in the R package. The results of grouping were verified using PCA. Between the clusters, the distribution of age, sex, DFS, and stage were compared using a chi-squared test.
Generation and Prediction of the Prognostic Signature
We removed more than 10% of the SLC genes that showed no expression in the tumor samples. To assess the correlation between the remaining SLC genes and DFS in the PTC cohort from the TCGA, we used univariate Cox analysis for survival analysis in R (P < 0.01). Risky genes were considered as those with an HR larger than 1, while protective genes were considered as those with an HR less than 1. A five-gene prognostic signature (SFXN1, SLC12A4, SLC35A1, SLC35E1, and SLCO1C1) was identified. The associations among these 5 genes were analyzed using Pearson correlation analysis (Supplementary Figure 1). Based on the minimum criteria, these 5 genes were selected to build the risk signature. To calculate the risk scores for the TCGA dataset we used the coeficients obtained from the LASSO algorithm. Based on the median value of the risk scores, the TCGA PTC cohort was subjected to stratification analysis to generate a high-risk group and low-risk group. The Kaplan-Meier method with a 2-sided log-rank test was used to calculate the difference in DFS between the high-risk and low-risk groups. To evaluate the prediction accuracy of the prognostic model, we constructed a ROC curve. To compare the distribution of the clinicopathological parameters between the high-risk and low-risk group, the chi-squared test was used. Pheatmap in the R package was used to generate heatmaps for data visualization. Univariate and multivariate Cox regression analyses were employed to determine the independent prognostic variables for PTC in the TCGA cohort. We further evaluated the survival difference between the high-risk and low-risk groups via stratification according to age, sex, ETE, histological type, and stage.
Patients and Tissue Specimens
Fifty-seven pairs of fresh tissue samples comprised of PTC and adjacent non-cancerous thyroid tissues were obtained from patients who underwent surgery in the First Hospital of China Medical University between 2018 and 2019. All tissue samples were frozen in liquid nitrogen immediately after surgical resection, and then stored at −80°C until later use.
qRT-PCR Analysis
Total RNA was extracted from frozen tissues using RNAiso (Takara, Dalian, China). qRT-PCR was performed using PrimeScript™ RT-Master Mix and SYBR® Premix Ex Taq™ II (Takara) in the Light Cycler 480 system (Roche, USA). The primers used comprised SLC12A4(sense):5-TCTTTCTGATGTGCTACCTGTT-3;SLC12A4(antisense):5-CAGTGATAGTACTTGAACCGGG-3.SLCO1C1(sense):5-TGGGAGTTGGAACACTGCTCATTG-3;SLCO1C1(antisense):5-AGGAGACACGGAGAGATGCTGAG-3.SLC35E1(sense):5-CCTATGCACACACCGTCAAG-3;SLC35E1(antisense):5-CCTATGCACACACCGTCAAG-3.SLC35A1(sense):5-GTTAAGTGTGCCATCGTTAGTG-3;SLC35A1(antisense):5-GGAATCTTCAACTGGTAGGTCA-3.SFXN1(sense):5-TGGGATCAAAGCACTTTCATTG-3;SFXN1(antisense):5-TTTCTGTAAGACCAGGAGGAAC-3.GAPDH(sense):5-TGCACCACCAACTGCTTAGC-3;GAPDH(antisense): 5-GGCATGGACTGTGGTCATGAG-3. The relative expression levels were calculated by the 2-ΔCT method (CT, cycle threshold).
Pan-Cancer Analysis
In order to expand the application range of the prognostic model and to evaluate the prediction accuracy of the prognostic model, we constructed ROC curves for 27 cancers. We also used Kaplan Meier method to analyze the relationship between Riskscore and DFS. According to the median risk score, different TCGA cohorts were stratified and divided into high risk group and low risk group. The difference in DFS between high risk group and low risk group was calculated.
Statistical Analysis
The Kolmogorov-Smirnov test was used analyze the relationship between the clinicopathological characteristics of patients with PTC and the 5 genes. All statistical tests were performed in a 2-sided manner. Statistical significance was accepted at P < 0.05 and 0.01.
Supplemental Material
Supplemental Material, sj-png-1-tct-10.1177_15330338211036314 - Identification of a Signature Comprising 5 Soluble Carrier Family Genes to Predict the Recurrence of Papillary Thyroid Carcinoma
Supplemental Material, sj-png-1-tct-10.1177_15330338211036314 for Identification of a Signature Comprising 5 Soluble Carrier Family Genes to Predict the Recurrence of Papillary Thyroid Carcinoma by Rui Han, Wei Sun and Hao Zhang in Technology in Cancer Research & Treatment
Footnotes
Authors’ Note
Rui Han and Wei Sun contributed equally to this study. The studies involving human participants were reviewed and approved by the Ethics Committee of the First Affiliated Hospital of China Medical University. The patients/participants provided their written informed consent to participate in this study. All animal studies were conducted in accordance with the principles and procedures outlined in the guidelines of the Institutional Animal Care and Use Committee (IACUC) of China Medical University (IACUC approval number: TZ2019137).
Acknowledgments
This work was supported by the National Natural Science Foundation of China (grant number 81902726), the Project funded by China Postdoctoral Science Foundation (grant number 2018M641739), and Natural Science Foundation of Liaoning Province (grant number 20180530090).
Declaration of Conflicting Interests
The author(s) declared no potential conflicts of interest with respect to the research, authorship, and/or publication of this article.
Funding
The author(s) declared the following potential conflicts of interest with respect to the research, authorship, and/or publication of this article: This work was supported by the National Natural Science Foundation of China (grant number 81902726), the Project funded by China Postdoctoral Science Foundation (grant number 2018M641739), and Natural Science Foundation of Liaoning Province (grant number 20180530090).
Supplemental Material
Supplemental material for this article is available online.
References
Supplementary Material
Please find the following supplemental material available below.
For Open Access articles published under a Creative Commons License, all supplemental material carries the same license as the article it is associated with.
For non-Open Access articles published, all supplemental material carries a non-exclusive license, and permission requests for re-use of supplemental material or any part of supplemental material shall be sent directly to the copyright owner as specified in the copyright notice associated with the article.