
Abstract
Purpose:
This study aimed to evaluate (1) the performance of the Auto-Planning module embedded in the Pinnacle treatment planning system (TPS) with 30 left-side breast cancer plans and (2) the dose-distance correlations between dose-based patients and overlap volume histogram-based (OVH) patients.
Method:
A total of 30 patients with left-side breast cancer after breast-conserving surgery were enrolled in this study. The clinical manual-planning (MP) and the Auto-Planning (AP) plans were generated by Monaco and by the Auto-Planning module in Pinnacle respectively. The geometric information between organ at risk (OAR) and planning target volume (PTV) of each patient was described by the OVH. The AP and MP plans were ranked to compare with the geometry-based patients from OVH. The Pearson product-moment correlation coefficient (R) was used to describe the correlations between dose-based patients (APs and MPs) and geometry-based patients (OVH). Dosimetric differences between MP and AP plans were evaluated with statistical analysis.
Result:
The correlation coefficient (mean R = 0.71) indicated that the AP plans have a high correlation with geometry-based patients from OVH, whereas the correlation coefficient (mean R = 0.48) shows a weak correlation between MP plans and geometry-based patients. The dosimetric comparison revealed a statistically significant improvement in the ipsilateral lung V5Gy and V10Gy, and in the heart V5Gy of AP plans compared to MP plans, while statistical reduction was seen in PTV V107% for MP plans compared to AP plans.
Conclusion:
The overall results of AP plans were superior to MP plans. The dose distribution in AP plans was more consistent with the distance-dose relationship described by OVH. After eliminating the interference of human factors, the AP was able to provide more stable and objective plans for radiotherapy patients.
Introduction
Breast cancer is the most common malignant tumor in women, ranking first in both morbidity and mortality. 1 As a standard treatment for early breast cancer, whole-breast irradiation after breast-conserving surgery can effectively improve the local control rate and long-term survival rate. 2 With the development of radiation therapy technology for breast cancer treatment, intensity modulated conformal radiation therapy (IMRT) and volume arc intensity modulated radiation therapy (VMAT) are proposed. Compared to traditional techniques, IMRT and VMAT can provide more-uniform dose distribution in the target area and offer better protection to organs at risk (OAR). 3,4 Moreover, compared to the IMRT plan, the VMAT plan can provide better homogeneity of planning target volume (PTV), protect the endangered organs (especially the lung and heart) with a lower absorbed dose, and reduce monitor units (MUs) and treatment time. With better performance during the radiotherapy treatment process, the VMAT technology has become the first choice for most patients with early breast cancer after breast-conserving surgery. 5 -8 However, clinical manual planning (MP) is very time-consuming, and its optimization results mainly depend on personal performance and experience. The results of the same manual plan may fluctuate with different planners due to differences in skills, habits, and methods. 9 -11
In recent years, the rapid development of Auto-Planning (AP) has become the focus of radiotherapy treatment. The AP aims to reduce the manual time required for optimization and automatically optimize the objective function to achieve the desired effect. Moreover, the implementation of an automatic process can potentially reduce the objective differences between physicists as well as the overall planning quality. Current research on applying AP to different types of cancer shows that while AP produces a high-quality clinically acceptable plan, it can improve the efficiency of the optimization process and the quality of the plan while eliminating the need to repeat experiments during manual planning. 12 -15 However, most of that researches focusing on the dosimetric comparison between manual plans and automatic plans to demonstrate the superiority of the AP.
Kazhdan et al 16 proposed a novel overlapping volume histogram (OVH), which describes the 1-dimensional distance distribution of each endangered organ relative to the tumor. According to the OVH curve, the geometry of the organ relative to the tumor can be quickly identified. 17 The geometry of the endangered organ and target area is used to identify patients with similar treatment plans. By comparing the geometric differences of different patients, the quality of a group of plans is expected to be estimated. 18 In this study, we proposed an innovative method based on dose-distance relationship described by the OVH curve to evaluate the quality of AP plans and its correlation with the OVH curve.
Material and Method
Patient Selection
Thirty patients treated between 2018 and 2019 in our radiotherapy center after left-side breast-conserving surgery were selected in for this study. All patients were diagnosed with early breast cancer after breast-conserving surgery and did not have metastatic lymph nodes. In order to demonstrate the advantages of AP plans, we choose the Monaco planning system with better dose distribution to complete MP plans. 19 The patients’ plans were generated by an experienced medical physicist using the Monaco (version 5.10) treatment planning system (TPS) and satisfied clinical requirements. The plans were implemented by the VMAT technique with 6 MV photon beams on Elekta Synergy linear accelerator (Elekta AB, Stockholm, Sweden) or Elekta Versa linear accelerator respectively (Elekta AB, Stockholm, Sweden).
The patients were scanned using a large aperture computed tomography (CT) system (SOMATOM Sensation Open, Siemens, Germany) with a slice 5 mm thick. The clinical target volume (CTV) comprising the whole mammary gland was delineated on Pinnacle (Version 9.10) TPS. The planning target volume (PTV) was 0.4 cm extended in 3-dimensional margins from the CTV and was contracted to 5 mm under the skin. The boundary of the PTV was not allowed to encroach into the ipsilateral lung. All OARs, including ipsilateral lung, contralateral lung, heart, and contralateral breast, were delineated on Pinnacle TPS (Philips, Fitchburg, WI, USA), in accordance with the National Comprehensive Cancer Network guidelines 2018 and report 9804 of the Radiation Therapy Oncology Group. A prescription dose of 50 Gy in 25 fractions was specified for each patient.
According to the standards and experiences of OAR constraints in our radiotherapy center, constraints of OARs for whole breast radiotherapy (WBRT) after breast-conserving surgery are as follows: PTV: V50Gy > 95%, V55Gy < 5%. Ipsilateral lung: V20Gy < 20%, V10Gy < 30%, V5Gy < 45%. Heart: V10Gy < 10%, Dmean < 5 Gy. Contralateral breast: Dmean < 5 Gy.
The images and structures of each patient were transmitted to Monaco TPS for optimization. A tangent field that rotates clockwise and counterclockwise twice from a specific start and stop angle was set for each plan. The coordinates of the isocenter (ISO) was defined on the edge of PTV. The results of clinical plans were approved by a qualified oncologist and satisfied minimal clinical requirements.
Auto-Planning Module
The AP plans can be achieved using the Treatment Techniques module embedded in Pinnacle 9.10 TPS. The module consists a Technique Library that provides a variety of templates for planners to apply to different types of patients. These templates are available for planners to revise or create with a group of parameter settings in the Technique Window. The constraints for the APs with left-side breast cancer after breast-conserving surgery have been listed in Table 1.
Clinical Constraints for APs.

Besides the constraints for OARs, there are some initial parameters including the Tuning balance, Dose Fall-off margin, Hot-spot Maximum Goal, and Cold-spot ROIs that need to be set in the Technique Window. Tuning balance is a percentage of weight that can be adjusted between Target coverage and OAR sparing. Dose Fall-off margin represents how quickly the dose declines per unit distance. Hot-spot Maximum Goal and Cold-spot ROIs influence the uniformity and conformability of the target area. Other necessary settings, including machine type, coordinate of ISO, and beam start and stop angle, will remain the same as the clinical plan.
Ten experimental patients were planned prior to formal optimization in the AP module in order to create a standard template as shown above for 30 APs optimization. The PTV of a few plans were unable to achieve the requirement of V50Gy > 95% in the first round of optimization due to the unfavorable patient anatomy. For such cases, an increment of a small amount of MUs directly is acceptable under the condition of V55Gy < 5%.
Application of OVH Curve
The OVH describes the 1-dimensional geometric relationships between OAR and Target, which is potentially related to the dose distribution of the plan. 16 When a target T expanded a specific distance r, the proportion of the volume that overlaps with the OAR is defined as:

where d(p, T) is the specific distance of p from the tumor’s boundary, and |O| signifies the volume of the OAR. 16
The OAR absorbed dose is directly related to the extension distance from the target volume if the dose distribution of the target is relatively conformable to the target area. Figure 1 shows an example of OVH for 2 OARs. The Y-axis represents the volume of the target area that overlaps with the OAR after a certain distance expansion. The X-axis represents the specific distance expanded from the target area. For the same percentage of overlap volume OVH(v) >0, if the expanded distance r1 < r2, then the dose absorbed on OAR is concluded as D1 > D2.

An example of OVH for 2 OARs; for the same volume V, the extended distance r1 < r2 indicates dose absorbed on OAR D1 > D2.
In this study, the PTV was expanded with a uniform distance of 2 mm from all directions to overlap with the ipsilateral lung and heart. The extension distance will increase uniformly until the overlap volume equals the volume of each OAR.
Four indicators including V5Gy, V10Gy, and V20Gy of ipsilateral lung and V5Gy of heart will be used as comparisons between 2 plans (AP and MP) and OVH ranking. We will first select the 5 patients with the best results based on the results of 30 MP plans on Monaco. These 5 patients will be the basis used for the subsequent OVH ranking. Then the remaining 25 patients will be ranked and compared in different methods.
The first ranking is based on the optimized results obtained from MPs on Monaco.
The second ranking is based on the results of automatic optimization from APs on Pinnacle.
The third ranking is based on the size of the PTV extension distance obtained under a specific OVH volume.
For 30 patients with similar anatomical structures, OVH curves are prone to cross each other. In order to identify the ranking of OVHs for 25 patients, a specific volume on the OVH graph needs to be defined. In this study, we chose the average value of the top 5 plans as the representative volume to determine the ranking of OVHs for 25 patients. For example, to identify the ranking of 25 OVHs according to the indicator of the ipsilateral lung V5Gy, we first ranked the 30 MPs on Monaco according to its volume of ipsilateral lung V5Gy. Then the top 5 plans were selected to calculate the average value (Vmean). On the OVH graph of the ipsilateral lung of the 25 patients, we were able to rank the PTV-extension distance d according to this Vmean. This ranking is supposed to correspond to the dose distribution of 5Gy in the ipsilateral lung of the 25 patients. According to the previously stated theory, the greater the extension distance d from the PTV, the lower the volume of V5Gy of the ipsilateral lung in the plan. Then, the ranking of MPs and APs was compared with the ranking of OVH. Under the same conditions, it was estimated that the ranking results of the AP plans will be more consistent with the OVH ranking results.
Result
Overlap Volume Histogram (OVH) for 25 Patients
Thirty MPs were ranked first according to the V5Gy, V10Gy, and V20Gy of the ipsilateral lung and V5Gy of the heart. Then the top 5 plans were selected and the average volume was calculated from the MPs ranking. The OVH of the remaining 25 patients of V5Gy, V10Gy, and V20Gy of the ipsilateral lung and V5Gy of the heart were generated in Figure 2. The OVH graph shows that each patient’s curve is very close to each other due to the anatomical similarity of the 25 patients with left-side breast cancer. Therefore, the OVH graph needs to be amplified at the average volume Vm in order to identify the ranking order of 25 patients.
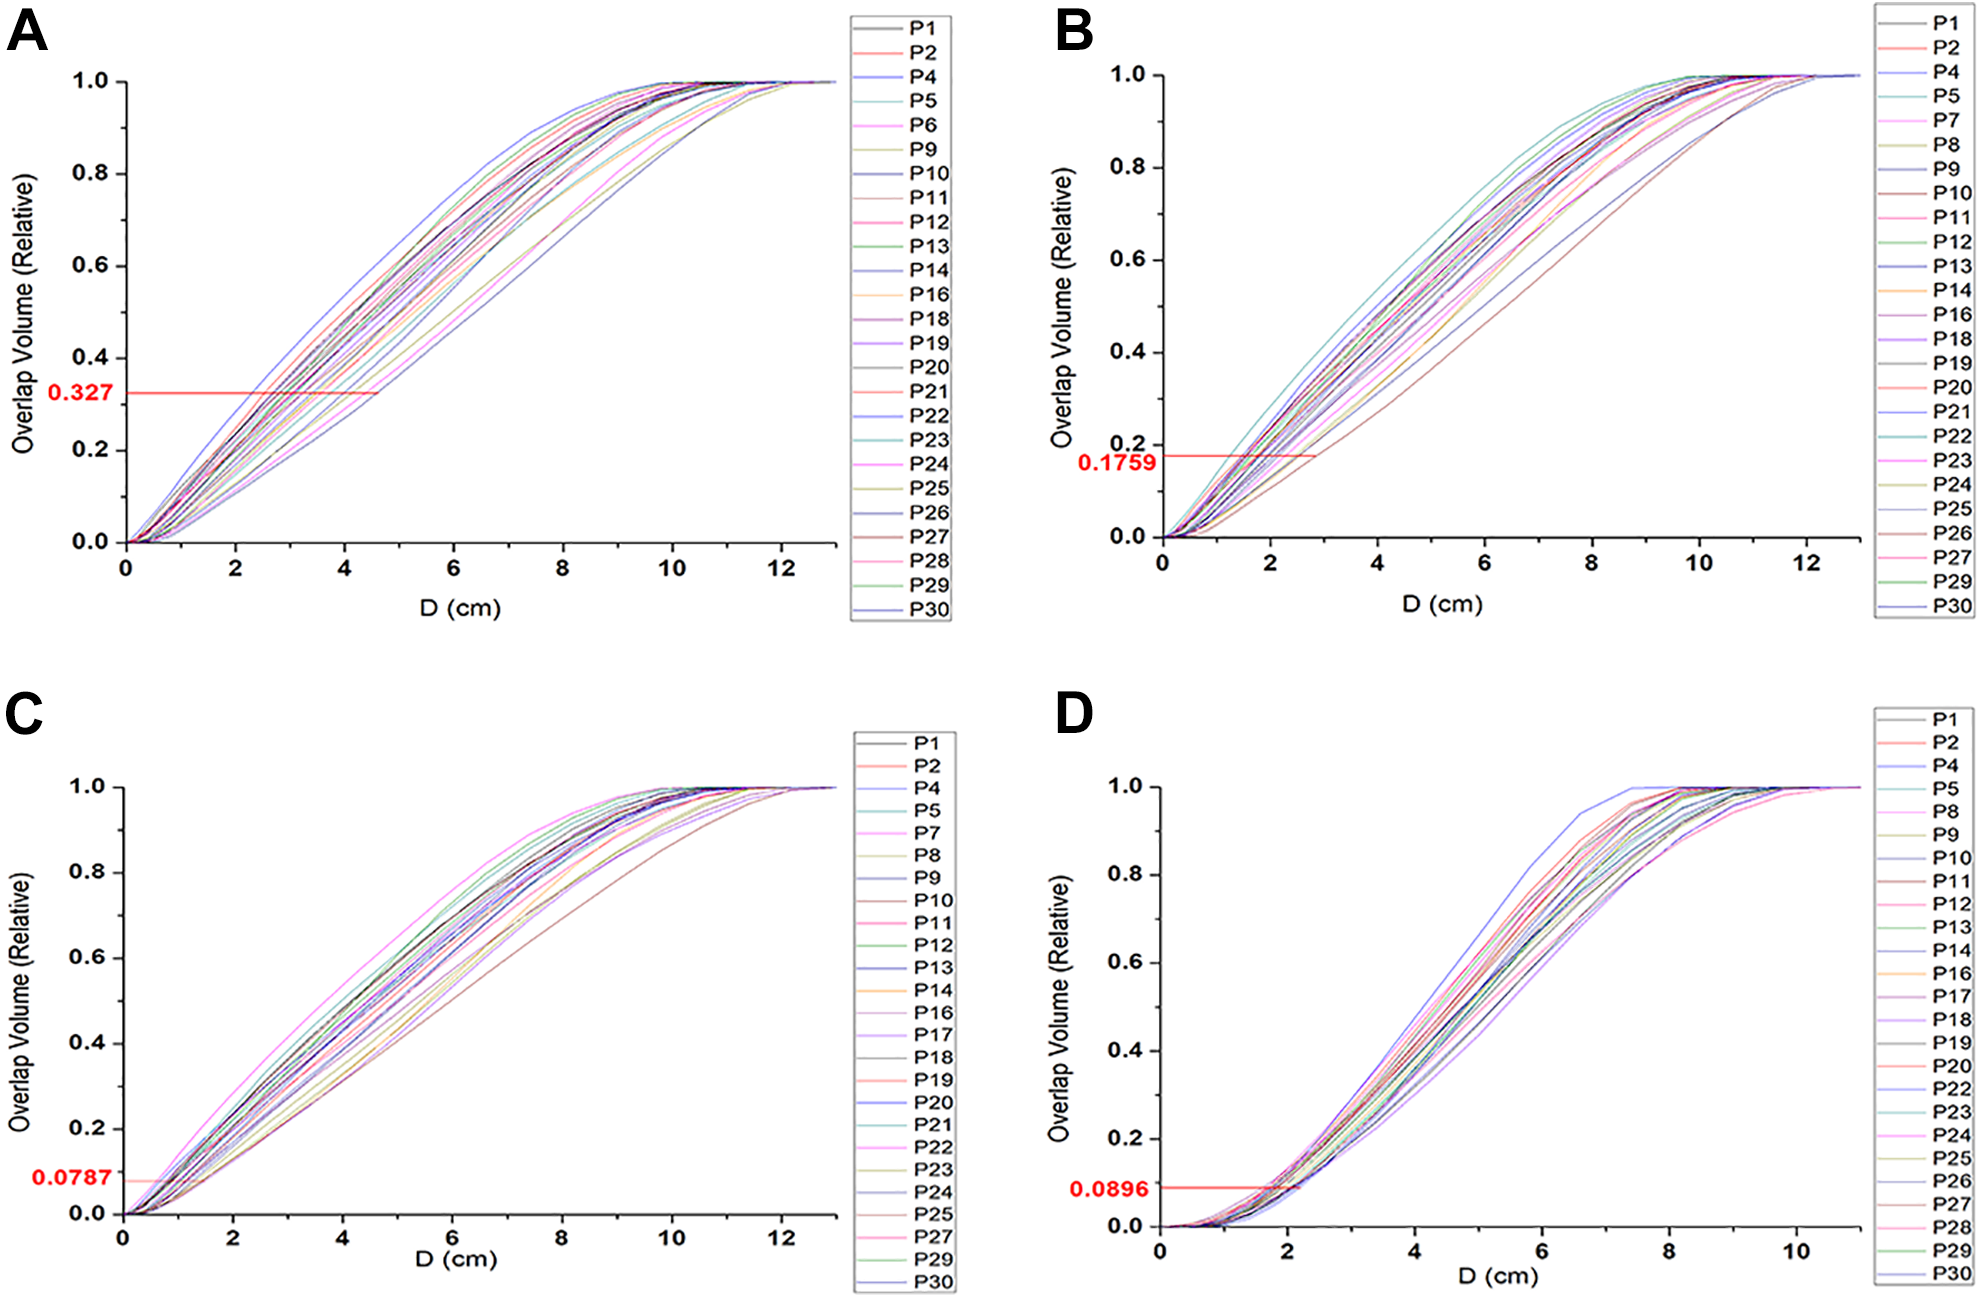
OVH of the ipsilateral lung for 25 patients ranked from (A) V5Gy, (B) V10Gy, and (C) V20Gy, and OVH of heart for 25 patients ranked from (D) V5Gy. The ranking of 25 patients from superior to inferior can be identified sequentially from right to left on the legend.
According to the ranking of OVHs based on the extension distance d from PTV, the quality of a group of plans is expected to be identified. Then, the ranking of APs and MPs based on their dosimetric value is compared to the ranking of OVH for further assessment of the quality of the plans.
Statistical Analysis Based on OVH Ranking
According to the volume of the ipsilateral lung V5Gy, V10Gy, V20Gy, and heart V5Gy, the rankings of 25 cases of AP and MP were obtained and compared with the rankings of 25 cases based on the OVH curve. The Pearson product-moment correlation coefficient was used to describe the degree of linear correlation between the dose-based and geometry-based patients. The scatter chart in Figure 3 shows the ranking of 3 different methods according to the optimized result of AP plans, MP plans, and the extension distance d of OVH. The gray and yellow trend lines represent the degrees of linear correlation between automatic plans and manual plans respectively and the OVH ranking. The figure reveals that in all the results, the correlation degree (mean R = 0.71) between the AP ranking and the OVH-based ranking of 25 patients was higher than the correlation degree (mean R = 0.48) between the MP ranking and the OVH-based ranking. Such results indicate to a certain extent that after eliminating the interference of human subjective factors, the stability of AP is improved in comparison to that of MP optimized with subjective bias. In addition, whether it is in AP plans or MP plans, the degree of correlation (AP: mean R = 0.4; MP: mean R = 0.19) between the heart’s ranking and the OVH ranking was lower than that of the ipsilateral lung (AP: mean R = 0.82; MP: mean R = 0.58). This is probably because in the plan optimization, we artificially listed the ipsilateral lung as the priority target more constraints were applied to restrict the lung dose in both plans. This caused the dose in the lungs to follow the rule of dropping regularly as the distance from the target area increased.

Ranking of OVHs, APs, and MPs in (A) ipsilateral lung V5, (B) ipsilateral lung V10, (C) ipsilateral lung V20, and (D) heart V5. R is the correlation coefficient between AP and MP ranking, respectively, and OVH-based ranking.
Dosimetric Comparison Between AP and MP
The dosimetric comparison of PTV, the ipsilateral lung, and the heart are listed and compared in Table 2. No statistical difference was seen in the comparison of maximum dose point D2CC in PTV. Statistical improvement in AP was observed in PTV V95% coverage from 98.16% to 98.94%, while statistical reduction was seen in PTV V107% from 24.57% to 7.59% for MP plans compared to AP plans. The higher hot pot volume in PTV for AP is probably because we set a relatively loose target condition in AP module to limit the hot spots for achieving lower dose distribution in OARs. Comparing the dosimetric parameters between OARs for AP and MP plans, V5Gy and V10Gy in the ipsilateral lung and V5Gy in the heart of AP plans showed a better result compared to MP plans, whereas V20Gy in the ipsilateral lung of manual plans revealed preferable results. Moreover, the standard deviation value of automatic plans in all groups were smaller than those of manual plans, which indicates a more stable and less scattered optimization result of the AP plans.
Dosimetry Comparison Between AP and MP.

Discussion
For the optimization process of manual plans, the planning and design of VMAT are based on the relative position of the target area and the OARs; some dosimetry constraints are manually added based on experience and then TPS is used for de-optimization. During this optimization process, the planner will repeatedly modify the parameters and try different dosimetry constraints according to the present result. This is an iterative process to obtain a treatment plan that meets clinical requirements. The trial-and-error process is very lengthy and time-consuming, and prone to human errors. This could be one of the reasons why the dose distribution of various indicators of OARs in APs are better than those in MPs in Table 2. Moreover, the standard deviation of various indicators in APs is also smaller than that in MPs, which shows that the result of AP plans is more stable. Similar results have been proven in many publications. 12 -15
The geometric relationship between the target volume and OARs significantly affects the dose distribution in the physical plans. In many research articles, the effectiveness of the OVH method for plan evaluation and plan quality improvement has been described. 18,20 The distance-dose correspondence established by OVH can provide a general estimate of the plan quality before optimization. 18, 21 -23 Because of the relative objectivity and independence of the AP during the optimization process, the results obtained from it can reflect the correspondence more accurately between anatomical structure and dose distribution. The research verified the effectiveness of OVH and the superiority of AP through the comparison of 3 results: MPs, APs, and OVH prediction. In the previous results in Figure 3, it was seen that in comparison to MPs, the results of APs show a more consistent correlation with OVH. This result illustrates the objectivity of the results of APs after reducing the interference of human factors. In addition, in the comparison of MPs and APs dosimetry, the results of V5Gy, V10Gy of the ipsilateral lung, V5Gy of the heart in APs were significantly better than MPs. Only when comparing the V20Gy of the ipsilateral lung were the results of APs slightly inferior to MPs. This is probably because the radiation oncologists in our department usually pay more attention to the dose of the ipsilateral lung in breast cancer patients. In order to make the dose lower, more constraints were applied to the ipsilateral lung when the medical physicist optimized the plan. The result of such plans may cause asymmetrical dose distribution in the patient.
It should be pointed out that only 2 OARs (ipsilateral lung and heart) were used as research objects in this research. Three other important OARs, the contralateral breast, the contralateral lung and the spinal cord were taken into the calculations of MP plans and AP plans but were not incorporate into research process. One of the reasons is that the ipsilateral lung and the heart are the OARs the oncologists in our department most concerned about. For patients with left breast cancer after breast-conserving surgery, their target area is usually smaller than that of patients with advanced breast cancer. Therefore, the dose absorbed by the contralateral breast, contralateral lung and the spinal cord is very low due to their father distanced position relative to PTV. Another and possibly the most important reason is that the dose distribution in patients is more compact when the OAR is close to the PTV. Typically, when the OAR is far from the PTV, the dose distribution becomes more irregular. Thus, the distance-dose correspondence of OVH become meaningless when applied with the 3 OARs located further from PTV.
Although the results obtained in this study are consistent with our expectations, this does not mean that the same will hold true for other types of diseases. First, breast cancer after breast-conserving surgery is a relatively rare disease. For most patients, the shape of PTV and the anatomical position of PTV and OARs have relatively high similarities. Dose distribution around PTV can be more compact with a very low dose to surrounding OARs comparing to other types of diseases. (Under this situation, it also proves the advantages of AP over MP from the side.) Secondly, although the optimization process of AP reduces the interference of human subjective factors, there are certain subjective factors in the initial settings of AP. For example, the modification of the restriction conditions in the template and the parameter setting of hot and cold spots will affect the result of the APs. 24,25 In addition, the number of patients enrolled in this study is limited. The result could be more conclusive with a larger sample size and more different type of diseases as the research object.
Conclusion
In conclusion, because of the distance-dose correspondence provided by OVH in this study, it is proven that the AP offers fairer and more objective optimization result due to its independent and simple optimization process. When artificially optimizing the plan, we often pay too much attention to a certain index of OAR and ignore the dose distribution of other OARs that may cause potential side effects to patients. The application of AP can potentially reduce human errors and save more time for medical physicists to devote to other tasks.
Footnotes
Abbreviations
TPS, Treatment Planning System; OVH, Overlap Volume Histogram; MP, Manual Planning; AP, Auto-planning; OAR, Organ at Risk; PTV, Planning Target Volume; CTV, Clinical Target Volume; IMRT, Intensity Modulated Conformal Radiation Therapy; VMAT, Volume Arc Intensity Modulated Radiation Therapy; MUs, Monitor Units; CT, Computed Tomography; WBRT, Whole Breast Radiotherapy; ISO, isocenter.
Authors’ Note
Yijiang Li, Han Bai, and Danju Huang contributed equally to this work. Yijiang Li and Han Bai proposed the original idea and method; Yijiang Li and Danju Huang collected the data, performed the data analysis, and wrote the manuscript; all authors have read the manuscript and gave their personal advice for revision. All research data are available for reasonable requests and will be supplied from corresponding author. This research does not involve any human or animal trials. The plans generated in this study are only used for research purposes. Thus, this study does not require an ethics committee approval.
Declaration of Conflicting Interests
The author(s) declared no potential conflicts of interest with respect to the research, authorship, and/or publication of this article.
Funding
The author(s) disclosed receipt of the following financial support for the research, authorship, and/or publication of this article: This study was supported in part by Applied Fundamental Research in Yunnan Province (Joint Special Project of Kunming Medical University). Grant number: 2019FE001(-244), 2019/07—2022/06.